Abstract
There is great interest in understanding the mechanisms of expression underlying long-term potentiation (LTP). They are agreed to involve an increase in synaptic efficacy, which is described by three multiplicative parameters: p, the probability of neurotransmitter release; n, the number of active release sites; and q, the postsynaptic unit response to transmitter release. We report three new lines of evidence suggesting that increases in p contribute to LTP expression. (i) When the contributions to LTP by p, n, and q are maximized, and p alone is decreased, another high-frequency stimulation elicits additional LTP. The additional potentiation is only associated with decreases in paired-pulse facilitation (PPF) suggesting an increase in p. (ii) There is an inverse relationship between baseline Ip and the magnitude of LTP elicited, consistent with Ip having more or less room to increase when p is smaller or greater. (iii) It has been shown that there is an inverse relationship between the magnitude of LTP induced and the associated changes in PPF. Now I find that decreasing p before inducing LTP moves the set-point for measuring those changes in PPF from before to after p is decreased, which would only occur if p contributes to LTP. Three lines of evidence, then, suggest that increases in p contribute to LTP expression, which is consistent with a presynaptic contribution to LTP. These experiments do not address potential postsynaptic contributions.
Keywords: synaptic plasticity, presynaptic, rat, hippocampus, CA1
Long-term potentiation (LTP) is of great interest as a cellular substrate that contributes to memory storage. Its mechanisms of expression are intensely debated, but are agreed to involve an increase in synaptic efficacy. Therefore, they must involve increases in one or more of the three multiplicative parameters that describe synaptic efficacy: p, the probability of neurotransmitter release; n, the number of active release sites; and q, the postsynaptic unit response to transmitter. Identifying which parameters increase with LTP is important for suggesting underlying loci of change. This, in turn, directs efforts at elucidating the mechanisms underlying LTP to one side of the synapse or the other. Increases in p or q, for example, direct one to pre- or postsynaptic loci. Increases in n, however, can result from either pre- or postsynaptic changes.
The possibility that p increases with LTP has been tested with some evidence supporting its involvement (1–4) and other evidence weighing against it (5–9). One approach to addressing this question has been to test for associated changes in paired-pulse facilitation (PPF). PPF is an increase in a second population excitatory postsynaptic potential (pEPSP) when it follows shortly after a first (<0.5 s), which is attributed to increases in p (5, 10). Because neurotransmitter release is limited, maneuvers that increase p decrease PPF by decreasing the capacity for p to increase (11, 12). This lead to the hypothesis that if LTP involves increases in p, then PPF might decrease as it is induced. Most authors (13–18), including ourselves, however, have found no change in average PPF as LTP is induced (but see ref. 19). But PPF in individual slices does change: it increases or decreases depending on its initial value (20, 21, 22).
The mechanism underlying the increases and decreases in PPF was initially unclear. To better understand the result, we modeled the changes in PPF with LTP and found that they are better explained by increases in the number of release sites than by increases in p (23). In addition, modeling suggested that increases in n could obscure the detection of increases in p of the original release sites (porig). To determine whether there are increases in porig, then, I have held n constant, and report evidence that porig, in fact, increases with LTP. Some early results were reported in abstract form (24).
MATERIALS AND METHODS
Brains from adult Sprague–Dawley rats (150–200 g) were quickly removed and placed in iced saline. The hippocampi were dissected out and 400 μm slices were made perpendicular to the septotemporal axis with a vibratome (Technical Products International, St. Louis). Slices were transferred to a Haas-type (25) interface recording chamber (Medical Systems, Greenvale, NY) at 32.5 ± 0.1°C and maintained using standard procedures (22).
Two perfusing salines were used: a normal-calcium solution containing 120 mM NaCl, 3 mM KCl, 23 mM NaHCO3, 11 mM dextrose, 1.5 mM CaCl2, and 1.2 mM MgCl2; and a high-calcium saline containing 120 mM NaCl, 2.4 mM KCl, 25 mM NaHCO3, 10 mM dextrose, 4.5 mM CaCl2, 1.5 mM MgCl2, and 10 μM picrotoxin. Both were gassed with 95% O2/5% CO2. As indicated, the solution contained 200 μM 2-hydroxysaclofen to reduce γ-aminobutyric acid type B (GABAB)-mediated inhibition (Research Biochemicals, Natick, MA), 20 μM CdCl2, 100 μM d,l-amino-phosphono-valerate (APV) to block N-methyl-d-aspartate (NMDA) currents, or 6-cyano-7-nitroquinoxaline-2,3-dione (CNQX; Research Biochemicals) to reduce α-amino-3-hydroxy-5-methyl-4-isoxazole propionic acid (AMPA) currents. CNQX was dissolved in dimethyl sulfoxide and diluted for use (final dimethyl sulfoxide concentration, 0.01–0.1%). The N-type calcium channel antagonist ω-conotoxin GVIA (ω-CgTX; Sigma, 10 μM) (26, 27) was prepared in water and was drop applied.
Microelectrodes were pulled from 1.5-mm outside diameter glass tubing using a Flaming/Brown micropipette puller (Sutter Instruments, Novato, CA) and were filled with 750 mM NaCl (resistances were 1 to 5 MΩ). Stimulation at 20-sec intervals was given via bipolar, Teflon-coated platinum stimulating electrodes (stimulus duration, 50 μsec).
Stimulus intensities were used that initially yielded a 1.3 mV pEPSP. That intensity was used throughout each experiment. High-frequency stimulation (HFS) consisted of 10 trains (100 Hz, 50 msec) at 200-msec intervals. PPF was measured with a 55-msec interstimulus interval.
pEPSP slopes were determined by linear regression over the maximum initial slope points. To avoid bias, the same time-points on the initial slope were analyzed throughout the experiment. Standard statistical tests were used (28).
RESULTS
LTP Expression Through Increases in p Alone.
Three predictions of the hypothesis that increases in p contribute to LTP expression were tested. The first was that when potential contributions to LTP by increases in n and q were eliminated, then LTP would be elicited through increases in p alone. This was tested by saturating LTP (Fig. 1A) and then applying ω-CgTX to selectively lower p (open arrow). n and q, then, could no longer increase so that if additional potentiation were elicited, it could only be due to increases in p. Another HFS, in fact, elicited additional LTP. The same result was obtained when less LTP was elicited in saturating it (Fig. 1B). Averaging and normalizing across all slices demonstrates the additional potentiation elicited by HFS with ω-CgTX (Fig. 1C, •) vs. the previous HFS in which LTP was saturated (○, 24.6 ± 5.8% vs. −0.3 ± 2.2% [mean ± SEM], n = 8, P = 0.0027, t test). These results are surprising considering that this paradigm biases against additional LTP: decreasing the pEPSP size used for the last HFS decreases cooperativity and thereby should decrease the LTP elicited (29). These results are similar, however, to the finding that LTP could not be elicited when p was large, but could be elicited after it was decreased (30).
Figure 1.
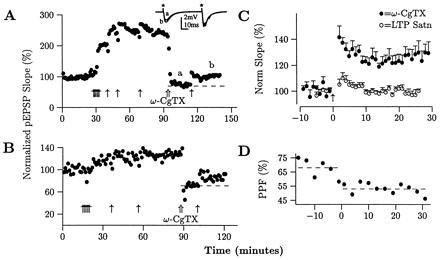
LTP can be expressed through increases in p. (A) LTP was saturated by repeated HFS (arrows), thereby maximizing the potential contributions to LTP by increases in the three synaptic parameters p, n, and q. ω-CgTX was then applied (⇑), which decreases only p. HFS then elicited additional LTP, which should only be due to increases in p. (B) Even when less LTP was induced at saturation (25.7%), additional LTP was still elicited after applying ω-CgTX. (C) Superimposing the average, normalized HFS before ω-CgTX application (○) and the HFS with ω-CgTX (•) demonstrates the additional LTP elicited by the last HFS (24.6 ± 5.8% vs. −0.3 ± 2.2%, averages ± SEM, n = 8, P = 0.0027 by t test). (D) All slices that potentiated showed decreases in PPF (−5.7 ± 2.3%, P = 0.016 by Sign Test; all changes are in percent PPF rather than percent change), consistent with increases in p. An example is shown in D where PPF decreased from 68 to 53% with the last HFS administered to the slice in A.
We reasoned that if the additional LTP elicited by the final HFS in Fig. 1 A–C was due to increases in p alone, then PPF should have decreased, as increases in p are associated with decreases in PPF (11, 12). All slices in which additional potentiation was elicited (7/8), in fact, showed decreases (−5.7 ± 2.3%, P = 0.016, Sign Test, all changes in PPF are in absolute percent rather than percent changes), consistent with increases in p. An example is shown in Fig. 1D where PPF decreased from 68 to 53% with the last HFS given to the slice in Fig. 1A. One could argue that these decreases were due to postsynaptic saturation. However, the amplitude of the pEPSPs used for the final HFS were typically smaller than the original 1.3 mV pEPSPs (Fig. 1A). And HFS with a 1.3 mV pEPSP decreases PPF only half the time (23), suggesting that the decreases in PPF observed every time here are due to increases in p.
The mechanism of expression for PPF of AMPA-mediated responses has classically been ascribed to a presynaptic loci. Evidence for this comes from examining quantal parameters (5, 31–35), presynaptic calcium transients during PPF (36), and the effect of altering membrane potential (37), and from finding that maneuvers that alter p are associated with changes in PPF (11, 12, 38). However, there is also evidence for a postsynaptic component to its expression (39). Thus, the finding that PPF decreases does not guarantee that the additional LTP elicited above is due to increases in p. Nonetheless, the finding that additional LTP can be elicited after saturation by decreasing p argues independently that increases in p can support LTP.
Five alternate explanations for the additional LTP elicited in Fig. 1C were considered. First, ω-CgTX might have washed-out over the time-course of the experiments (40). ω-CgTX, however, shows no wash-out over 40 min (Fig. 2A, n = 3), which was recently confirmed (41). Second, the additional potentiation might have been due to release of ω-CgTX from its receptor by HFS. To test this, ω-CgTX was applied and HFS was given in the presence of APV, which blocks LTP. There was no change in the pEPSP in a single slice (Fig. 2B) or in the group average (Fig. 2C, n = 4, 95 ± 5% of baseline) indicating that the additional potentiation was due to LTP.
Figure 2.
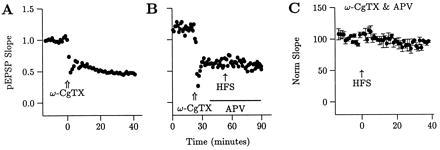
The potentiation associated with the final HFS in Fig. 1 is not due to reversal of the ω-CgTX-induced depression of the pEPSP. (A) ω-CgTX-induced depression does not reverse spontaneously over the 40-min duration after application in Fig. 1 (n = 3, average shown). (B and C) ω-CgTX-induced depression does not reverse with HFS in the presence of APV, which blocks LTP induction, either in a single slice (B) or for the group average (C, n = 4).
Third, the additional LTP might have been unique to using ω-CgTX. Thus, cadmium (Cd2+), another calcium channel antagonist, was tested. After LTP saturation, Cd2+ was applied and an additional HFS was given. 5 of 7 slices showed additional potentiation vs. the preceding HFS (Fig. 3A, displayed as in Fig. 1B, 14.6 ± 4.3% vs. −2.8 ± 3.6%, P = 0.022). Thus, the effect was not specific to ω-CgTX. Less LTP was probably induced with Cd2+ vs. ω-CgTX (14.6 vs. 24.6%) because Cd2+ partially blocks NMDA receptors (42), which decreases the probability of inducing LTP (43). The additional LTP was also associated with decreases in PPF indicating that p had increased (−12.3 ± 4.0%, 4 of 5 slices). A decrease in one slice from 90 to 73% is shown (Fig. 3B).
Figure 3.
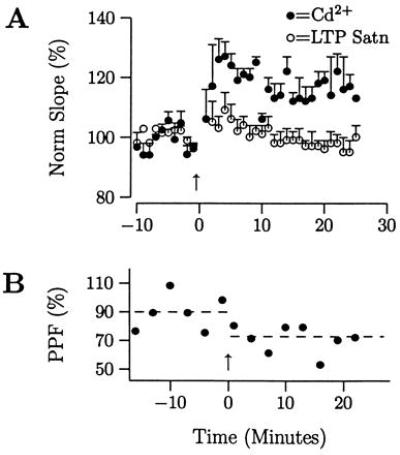
Additional LTP is elicited after LTP saturation when p is decreased by cadmium (Cd2+). (A) Using the same protocol as in Fig. 1 A and B, LTP was saturated, Cd2+ was washed-in, and an additional HFS was given (data not shown). Displaying the data as in Fig. 1C demonstrates that additional LTP was elicited [14.6 ± 4.3% with Cd2+ (•) vs. −2.8 ± 3.6% (○), P = 0.022; additional potentiation in 5 of 7 slices], despite Cd2+ blocking NMDA receptors (42). (B) PPF decreased in association with the additional LTP by −12.3 ± 4.0% (4 of 5 slices). The change in PPF for one slice from 90 to 73% is shown.
Fourth, the additional LTP might have been due to a decrease in current flow from a saturated level. Or ω-CgTX and Cd2+ may have acted through another postsynaptic mechanism. To test these possibilities, LTP was saturated and the size of the pEPSPs were decreased through a postsynaptic rather than a presynaptic mechanism—i.e., by washing-in CNQX (Fig. 4A). To ensure that the depressing effect of CNQX was maximized, 10 μM CNQX was washed in until the pEPSP amplitude was near zero (Fig. 4A). Then the CNQX concentration was changed to 0.5 μM and the size of the pEPSPs increased as CNQX washed out. When the pEPSP slopes stabilized, an additional HFS was administered. Because the size of the pEPSPs was increasing as CNQX washed out, this biased toward observing additional LTP; however, no additional LTP is evident in individual slices (Fig. 4A) or the group average (Fig. 4B, 3.9 ± 2.7% vs. 0.3 ± 2.2%, P = 0.64, n = 9).
Figure 4.
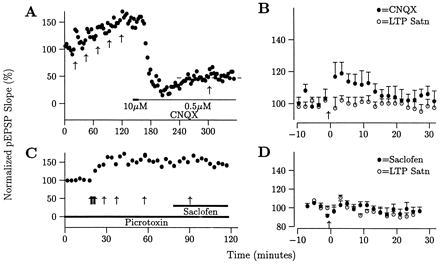
The additional LTP elicited by HFS after applying ω-CgTX or Cd2+ is not due to a postsynaptic effect (e.g., saturation of current entry) or a change in inhibition. (A and B) HFS after LTP saturation and bath-application of CNQX (bar) did not yield additional LTP in a single slice (A) or for the group average (B; 3.9 ± 2.7% vs. 0.3 ± 2.2%, P = 0.64, n = 9). (C and D) HFS after LTP saturation and bath-application of 5-hydroxysaclofen (bar) also did not result in additional LTP (−4.3 ± 9.6% vs. −8.3 ± 3.2%, P = 0.70, n = 3). All experiments were performed in the presence of picrotoxin.
These experiments suggest that the ability to elicit additional LTP is specific to having decreased p rather than having decreased the postsynaptic response. They also address the concern that a delay before the final HFS might have allowed additional LTP to be elicited (44). Because there was a longer delay in CNQX than in ω-CgTX, these experiments are biased toward evoking more LTP in CNQX than in ω-CgTX. One might also be concerned that the longer delay in CNQX decreased the probability of eliciting LTP; however, the Cd2+ experiments had the same delay and yet showed LTP. Finally, one could argue that if LTP relied on “AMPAfication,” then CNQX might block the induction of LTP or mask its expression. However, it is well known that LTP can be induced even when AMPA receptors are blocked (45, 46). And, CNQX/DNQX do not mask LTP expression when smaller concentrations are present (45, 46).
Finally, the additional LTP might have been due to a decrease in inhibition. This would increase depolarization during HFS and produce additional LTP. The GABAA antagonist picrotoxin was present in all experiments. The effect of a decrease in GABAB receptor activity was tested here by adding 5-hydroxysaclofen after LTP saturation, and giving another HFS (Fig. 4C). No additional LTP was elicited (Fig. 4D, −4.3 ± 9.6% vs. −8.3 ± 3.2%, P = 0.70, n = 3).
In summary, five control experiments suggest that the results of Figs. 1 and 3 are most easily explained by the ability of increases in p to support LTP expression.
LTP Magnitude Correlates with Initial p.
A second prediction of the hypothesis that increases in p contribute to LTP is that there should be an inverse relationship between baseline p and the magnitude of LTP elicited. This would occur because as baseline p is increased or decreased, the range for p to increase with LTP would be correspondingly smaller or greater. This prediction was tested by comparing the LTP elicited in three groups of slices. Group 1 was tested in the normal-calcium saline. Baseline p was greater in group 2 because of testing in the high-calcium saline. The 3-fold increase in calcium produces a 7.4-fold increase in pEPSP size elicited by the same stimulus intensity (22). And baseline p was less in group 3 because of adding ω-CgTX. The baseline pEPSPs were 1.3 mV in all groups, which was about one-third of the maximum elicitable pEPSP on an input–output curve. LTP was then saturated by repeated HFS until no additional LTP was elicited.
Examples of LTP saturation from slices in groups 1 (Fig. 5A), 2 (Fig. 5B), and 3 (Fig. 5C) are shown. The average LTP at saturation was 91.4 ± 11.7% (Fig. 5D, filled bar, n = 27), 33.8 ± 7.1% (open bar, n = 20), and 79.2 ± 16.6% (hatched bar, n = 10). The three means differ significantly [P < 0.005 by ANOVA, F(2;53) = 7.63]. The inverse relationship between baseline p and LTP magnitude suggests that increases in p contribute to LTP, but four other explanations were tested.
Figure 5.
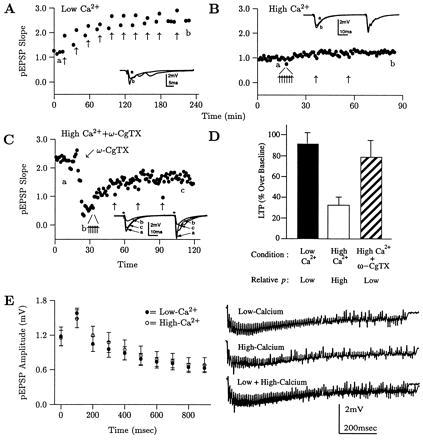
There is an inverse relationship between initial p and the magnitude of LTP elicited suggesting that p increases with LTP. (A–C) Examples of LTP saturation in slices examined in the low- (A) or high-calcium saline (B), or in the high-calcium saline after application of ω-CgTX (C). (D) The average LTP at saturation for the three groups was 91.4 ± 11.7% (filled bar, n = 27), 33.8 ± 7.1% (open bar, n = 20), and 79.2 ± 16.6% (hatched bar, n = 10, three different groups of slices). The means differ significantly [F(2;53) = 7.63, P < 0.005, ANOVA). (E) The differences in LTP are not due to differences in synaptic activity during HFS due, for example, to neurotransmitter depletion. (Right) Examples traces from HFS in the low- and high-calcium salines delivered for 1 sec at 100 Hz. (Left) Average ± SEM for all slices, sampled at 100-msec intervals, indicates that synaptic activity during HFS in the two salines is equivalent (n = 6 and 5).
First, there could have been slice selection bias. To avoid this, the data in groups 2 and 3 were obtained in alternating groups of slices. Second, the lesser LTP elicited in group 2 might be attributed to the previous induction of LTP by the high-calcium saline itself. Such LTP, however, occurs in a higher-calcium, high-potassium saline. In addition, groups 2 and 3 were studied in the same high-calcium saline, differing only in that ω-CgTX was added to group 3 just before HFS.
Third, there might have been a difference in synaptic activity during HFS. In the high-calcium saline, for example, there could have been more transmitter depletion during HFS, which would lead to less NMDA receptor activation, and less LTP. To test for this, we gave HFS at 100 Hz for 1 sec to slices in high- and normal-calcium saline. Versus Fig. 5D, this is twice as many stimuli over half the time. Examples of the resulting synaptic activity (raw traces) are shown in Fig. 5E Right. Ten points in each raw trace were measured at 100-msec intervals. The mean ± SEM for all traces are plotted in Fig. 5E Left (○, high-calcium; and • normal-calcium). Because the two curves are identical, synaptic activities under the two conditions are identical. To specifically examine transmitter depletion, the final points at 900 msec were compared and did not differ (0.65 ± 0.07 mV for normal-calcium vs. 0.68 ± 0.15 mV for high-calcium, n = 6 and 5, P = 0.84).
Finally, if the initial pEPSP magnitudes differed between groups, the differences in LTP magnitude could be attributed to differences in cooperativity. To avoid this, the same size pEPSPs (1.3 mV) were used for each experiment. It could be argued that the pEPSPs should be the same percentage of the maximum observed on an input–output curve. The 1.3 mV pEPSPs, in fact, tend to be about the same percentage of maximum in our hands because slices are selected that produce a 3.5–4 mV pEPSP. A 1.3-mV pEPSP, then, is consistently about one-third of that. It could also be argued that a stronger stimulus is needed to produce the 1.3 mV pEPSP in the normal-calcium saline, which might produce more LTP. Two arguments, however, weigh against this. First, in the high-calcium saline, the activity of fewer synapses is necessary to produce the 1.3-mV pEPSP because there is greater activity per synapse. That should induce greater LTP vs. the normal-calcium saline. Second, because the extracellular calcium is greater, more calcium should enter postsynaptically during HFS, also increasing LTP. Thus, it is somewhat surprising that less LTP is elicited in high-calcium. Evidently the decrease in LTP due to greater p outweighs the increase due to greater postsynaptic calcium influx since the net effect is a decrease in LTP.
Thus, these four alternate explanations do not appear to explain the data of Fig. 5. It appears that the best explanation is that baseline p affects LTP magnitude.
Lowering Baseline p Changes the Set-Point for Measuring Changes in PPF.
There is a significant correlation between the magnitude of LTP induced and the associated change in PPF (20, 21, 23). A subset of that data obtained in high-calcium is shown in Fig. 6 B and D (○). The third test of the hypothesis that increases in p contribute to LTP involved examining the effect of altering baseline p on that relationship between LTP and PPF. The protocol used for this test is shown in Fig. 5C. PPF was measured at baseline, ω-CgTX was applied, PPF was remeasured, LTP was saturated, and PPF was remeasured.
Figure 6.
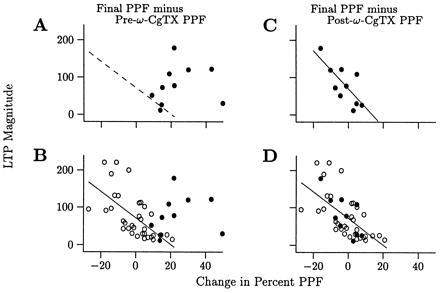
Decreasing p at baseline alters the set-point for measuring change in PPF suggesting that p contributes to LTP. There is a linear correlation between the magnitude of LTP induced and the associated change in PPF (20, 21, 23) as shown in B and D (○, linear regressions shown). Here we tested whether decreasing p with ω-CgTX before inducing LTP disrupts that relationship. Protocol is shown in Fig. 5C. (A) When change in PPF is calculated using time-points “c” and “a” in Fig. 5C, there is no correlation between change in PPF and LTP magnitude (n = 10, r = 0.37, P > 0.05 by linear regression, dotted line = regression for open circles in B). (B) Data from A (•) is superimposed over control data (○), demonstrating a loss of correlation. (C and D) When change in PPF is calculated using points “b” and “c,” there is a significant correlation between change in PPF and LTP (C, r = 0.87, n = 10, P < 0.005, linear regression shown) that is similar to that of the control data (D, ○, data from C superimposed).
We reasoned that if increases in p contribute to LTP, then changing baseline p from “a” to “b” would destroy the correlation between PPF and LTP when change in PPF is calculated using points “a” and “c.” On the other hand, if the correlation between PPF and LTP is an epiphenomena, it would persist using those points.
When change in PPF is calculated using points “c” and “a,” there is, in fact, no correlation with LTP magnitude (Fig. 6A, r = 0.37, n = 10, P > 0.05 by linear regression). Superimposing that data (•) on the control data in Fig. 6B (○) shows that the points are outside the range of controls. In contrast, when the values of PPF at “c” and “b” are used, there is a significant correlation between change in PPF and LTP magnitude (Fig. 6C, r = 0.87, n = 10, P < 0.005, solid line = linear regression) that is similar to control data (Fig. 6D). The difference in slopes of the linear regression lines for this (Fig. 6D, •, −5.22) and the control data (○, −3.54) is not significant. The move of the set-point from “a” to “b” by ω-CgTX supports the hypothesis that increases in p contribute to LTP.
DISCUSSION
This study presents three lines of evidence supporting the hypothesis that increases in p contribute to LTP expression. (i) After contributions by q and n are maximized for a given set of conditions, LTP can be elicited through increases in p alone. (ii) There is an inverse correlation between baseline p and the magnitude of LTP elicited. (iii) When p is decreased before inducing LTP, it moves the set-point for measuring change in PPF versus LTP magnitude.
It was previously shown that average PPF does not change with LTP, but PPF in individual slices does change (22), and the changes correlate with the magnitude of LTP induced (23). These results were confirmed recently (20, 21). What mechanisms underlying LTP produce these consistent results? Neural modeling suggests that they are due to an increase in n with LTP (23), which is supported by two more recent reports of an increase in n (47, 48).
Increases in n may then make it difficult to demonstrate changes in either p or PPF with LTP. As an example, if porig increases, but new release sites are added with a low p, then both average p and PPF would not change. One might then mistakenly conclude that porig had not increased when, in fact, those increases were just obscured by the increases in n (23). To address the question, then, of whether porig also increases, one has to hold n constant. By doing this, I was able to demonstrate here that, in fact, increases in p can also support LTP (Figs. 1 and 3).
An increase in p with LTP was demonstrated here by saturating LTP, decreasing p, and giving an additional HFS. A similar paradigm was recently used by another group to demonstrate that slices with a high p from young animals do not express LTP until p is lowered by decreasing extracellular calcium (30). I had also initially decreased p after LTP saturation by decreasing extracellular calcium, and an additional HFS had also elicited additional LTP. This maneuver, however, also increased fiber volley size indicating that new axonal fibers were recruited. To avoid recruiting experimentally naive fibers, we subsequently used ω-CgTX or cadmium to lower p as they do not alter the fiber volley. Using a very different paradigm, an increase in p with LTP was also recently demonstrated by examining MK-801 occlusion of NMDA receptors in naive slices vs. after LTP induction (49).
How is it that after LTP is saturated, decreasing p allows more LTP to be expressed via increases in p? The mechanism underlying LTP is evidently not an increase in presynaptic calcium influx (36), and therefore must be due to a downstream effect on p. There may be several other downstream factors that also affect p. LTP may appear to saturate, then, when a combination of factors causes p to reach a maximum. The contribution to p by LTP, however, may not be maximal at that point. Thus, decreasing p through decreasing calcium influx may allow the expression of an increase in p via the mechanisms of LTP.
Three lines of evidence, then, support the hypothesis that increases in p contribute to LTP. These increases suggest that presynaptic mechanisms contribute to LTP expression. From our other work, LTP also appears to involve an increase in n, which could be due to either pre- or postsynaptic mechanisms. These new release sites apparently have a lower p than porig since the net effect of increases in porig and n is no change in average p: hence average PPF also does not change with LTP. Because the contribution of increases in p to LTP varies with the initial conditions, the relative contributions of p and n to LTP also vary with the initial conditions.
Acknowledgments
I thank Daniel Johnston, Stephen Williams, Erik Cook, Costa Colbert, David Jaffe, Dana Giulian, and Jeffrey Noebels for comments on this manuscript. This work was funded by a National Institutes of Health grant.
ABBREVIATIONS
- LTP
long-term potentiation
- PPF
paired-pulse facilitation
- p
probability of neurotransmitter release
- n
number of neurotransmitter release sites
- q
postsynaptic unit response
- HFS
high-frequency stimulation
- pEPSP
population excitatory postsynaptic potential
- NMDA
N-methyl-d-aspartate
- APV
amino-phosphono-valerate
- AMPA
α-amino-3-hydroxy-5-methyl-4-isoxazole propionic acid
- CNQX
6-cyano-7-nitroquinoxaline-2,3-dione
- ω-CgTX
ω-conotoxin GVIA
- Cd2+
cadmium
- GABA
γ-aminobutyric acid
References
- 1.Bekkers J M, Stevens C F. Nature (London) 1990;346:724–728. doi: 10.1038/346724a0. [DOI] [PubMed] [Google Scholar]
- 2.Stevens C F, Wang Y. Nature (London) 1994;371:704–707. doi: 10.1038/371704a0. [DOI] [PubMed] [Google Scholar]
- 3.Larkman A, Hannay T, Statford K, Jack J. Nature (London) 1992;360:70–73. doi: 10.1038/360070a0. [DOI] [PubMed] [Google Scholar]
- 4.Malinow R, Tsien R W. Nature (London) 1990;346:177. doi: 10.1038/346177a0. [DOI] [PubMed] [Google Scholar]
- 5.Foster T C, McNaughton B L. Hippocampus. 1991;1:79–91. doi: 10.1002/hipo.450010108. [DOI] [PubMed] [Google Scholar]
- 6.Manabe T, Renner P, Nicoll R A. Nature (London) 1992;355:50–55. doi: 10.1038/355050a0. [DOI] [PubMed] [Google Scholar]
- 7.Kullmann D M. Neuron. 1994;12:1111–1120. doi: 10.1016/0896-6273(94)90318-2. [DOI] [PubMed] [Google Scholar]
- 8.Manabe T, Nicoll R A. Science. 1994;265:1888–1891. doi: 10.1126/science.7916483. [DOI] [PubMed] [Google Scholar]
- 9.Hessler N A, Malinow R. Soc Neurosci Abstr. 1994;20:846. [Google Scholar]
- 10.Katz B, Miledi R. J Physiol (London) 1968;195:481–492. doi: 10.1113/jphysiol.1968.sp008469. [DOI] [PMC free article] [PubMed] [Google Scholar]
- 11.Anwyl R, Mulkeen D, Rowan M J. Brain Res. 1989;503:148–151. doi: 10.1016/0006-8993(89)91716-2. [DOI] [PubMed] [Google Scholar]
- 12.Asztely F, Hanse E, Gustafsson B. Brain Res. 1990;521:355–358. doi: 10.1016/0006-8993(90)91567-z. [DOI] [PubMed] [Google Scholar]
- 13.McNaughton B L. J Physiol (London) 1982;324:249–262. doi: 10.1113/jphysiol.1982.sp014110. [DOI] [PMC free article] [PubMed] [Google Scholar]
- 14.Muller D, Lynch G. Brain Res. 1989;479:290–299. doi: 10.1016/0006-8993(89)91631-4. [DOI] [PubMed] [Google Scholar]
- 15.Zalutsky R A, Nicoll R A. Science. 1990;248:1619–1624. doi: 10.1126/science.2114039. [DOI] [PubMed] [Google Scholar]
- 16.Manabe T, Wyllie D J A, Perkel D J, Nicoll R A. J Neurophysiol. 1993;70:1451–1459. doi: 10.1152/jn.1993.70.4.1451. [DOI] [PubMed] [Google Scholar]
- 17.Ghijsen W E J M, Da Silva F H L. In: Long-Term Potentiation: A Debate of Current Issues. Baudry M, Davis J L, editors. Cambridge, MA: MIT Press; 1991. pp. 45–55. [Google Scholar]
- 18.Arai A, Black J, Lynch G. Hippocampus. 1994;4:1–10. doi: 10.1002/hipo.450040103. [DOI] [PubMed] [Google Scholar]
- 19.Voronin L L, Kuhnt U. Neurosci Res Commun. 1990;6:149–155. [Google Scholar]
- 20.Buonomano D V, Merzenich M M. J Neurophysiol. 1996;76:631–636. doi: 10.1152/jn.1996.76.1.631. [DOI] [PubMed] [Google Scholar]
- 21.Kleschevnikov A M, Sokolov M V, Kuhnt U, Dawe G S, Stephenson J D, Voronin L L. Neuroscience. 1997;76:829–843. doi: 10.1016/s0306-4522(96)00342-9. [DOI] [PubMed] [Google Scholar]
- 22.Schulz P E, Cook E P, Johnston D. J Neurosci. 1994;14:5325–5337. doi: 10.1523/JNEUROSCI.14-09-05325.1994. [DOI] [PMC free article] [PubMed] [Google Scholar]
- 23.Schulz P E, Cook E P, Johnston D. J Physiol (Paris) 1995;89:3–9. doi: 10.1016/0928-4257(96)80546-8. [DOI] [PubMed] [Google Scholar]
- 24.Schulz P E, Cook E P, Johnston D. Soc Neurosci Abstr. 1994;20:846. doi: 10.1523/JNEUROSCI.14-09-05325.1994. [DOI] [PMC free article] [PubMed] [Google Scholar]
- 25.Haas H L, Schaerer B, Vosmansky M. J Neurosci Methods. 1979;1:323–325. doi: 10.1016/0165-0270(79)90021-9. [DOI] [PubMed] [Google Scholar]
- 26.Aosaki T, Kasai H. Pflügers Arch. 1989;414:150–156. doi: 10.1007/BF00580957. [DOI] [PubMed] [Google Scholar]
- 27.Wu L G, Saggau P. J Neurosci. 1994;14:5613–5622. doi: 10.1523/JNEUROSCI.14-09-05613.1994. [DOI] [PMC free article] [PubMed] [Google Scholar]
- 28.Zar J H. Biostatistical Analysis. 2nd Ed. Englewood Cliffs, NJ: Prentice–Hall; 1984. [Google Scholar]
- 29.McNaughton B L, Douglas R M, Goddard G V. Brain Res. 1978;157:277–293. doi: 10.1016/0006-8993(78)90030-6. [DOI] [PubMed] [Google Scholar]
- 30.Bolshakov V Y, Siegelbaum S A. Science. 1995;269:1730–1734. doi: 10.1126/science.7569903. [DOI] [PubMed] [Google Scholar]
- 31.Hess G, Kuhnt U, Voronin L L. Neurosci Lett. 1987;77:187–192. doi: 10.1016/0304-3940(87)90584-2. [DOI] [PubMed] [Google Scholar]
- 32.Storm J F. Soc Neurosci Abstr. 1992;18:1340. [Google Scholar]
- 33.Andreasen M, Hablitz J J. J Neurophysiol. 1994;72:326–336. doi: 10.1152/jn.1994.72.1.326. [DOI] [PubMed] [Google Scholar]
- 34.Debanne D, Guerineau N C, Gahwiler B H, Thompson S M. J Physiol (London) 1996;491:163–176. doi: 10.1113/jphysiol.1996.sp021204. [DOI] [PMC free article] [PubMed] [Google Scholar]
- 35.Chen Y, Chad J E, Wheal H V. Neurosci Lett. 1996;218:204–208. doi: 10.1016/s0304-3940(96)13149-9. [DOI] [PubMed] [Google Scholar]
- 36.Wu L G, Saggau P. J Neurosci. 1994;14:645–654. doi: 10.1523/JNEUROSCI.14-02-00645.1994. [DOI] [PMC free article] [PubMed] [Google Scholar]
- 37.Clark K A, Randall A D, Collingridge G L. Exp Brain Res. 1994;101:272–278. doi: 10.1007/BF00228747. [DOI] [PubMed] [Google Scholar]
- 38.Ferchmin P A, Eterovic V A, Rivera E M, Teyler T J. Brain Res. 1995;689:189–196. doi: 10.1016/0006-8993(95)00568-b. [DOI] [PubMed] [Google Scholar]
- 39.Wang J-H, Kelly P T. J Neurophysiol. 1996;76:276–286. doi: 10.1152/jn.1996.76.1.276. [DOI] [PubMed] [Google Scholar]
- 40.Ellinor P T, Zhang J-F, Horne W A, Tsien R. Nature (London) 1994;372:272–275. doi: 10.1038/372272a0. [DOI] [PubMed] [Google Scholar]
- 41.Wheeler D B, Randall A, Tsien R W. J Neurosci. 1996;16:2226–2237. doi: 10.1523/JNEUROSCI.16-07-02226.1996. [DOI] [PMC free article] [PubMed] [Google Scholar]
- 42.Mayer M L, Vyklicky L, Jr, Westbrook G L. J Physiol (London) 1989;415:329–350. doi: 10.1113/jphysiol.1989.sp017724. [DOI] [PMC free article] [PubMed] [Google Scholar]
- 43.Collingridge G L, Kehl S J, McLennan H. J Physiol (London) 1983;334:33–46. doi: 10.1113/jphysiol.1983.sp014478. [DOI] [PMC free article] [PubMed] [Google Scholar]
- 44.Huang Y-Y, Colino A, Selig D K, Malenka R C. Science. 1992;255:730–733. doi: 10.1126/science.1346729. [DOI] [PubMed] [Google Scholar]
- 45.Kauer J A, Malenka R C, Nicoll R A. Neuron. 1988;1:911–917. doi: 10.1016/0896-6273(88)90148-1. [DOI] [PubMed] [Google Scholar]
- 46.Muller D, Joly M, Lynch G. Science. 1988;242:1694–1697. doi: 10.1126/science.2904701. [DOI] [PubMed] [Google Scholar]
- 47.Liao D, Hessler N A, Malinow R. Nature (London) 1995;375:400–403. doi: 10.1038/375400a0. [DOI] [PubMed] [Google Scholar]
- 48.Isaac J T R, Nicoll R A, Malenka R C. Neuron. 1995;15:427–434. doi: 10.1016/0896-6273(95)90046-2. [DOI] [PubMed] [Google Scholar]
- 49.Kullmann D M, Erdemli G, Asztely F. Neuron. 1996;17:461–474. doi: 10.1016/s0896-6273(00)80178-6. [DOI] [PubMed] [Google Scholar]


