Abstract
Trk receptor activation by neurotrophins is often considered to have a defined set of actions on target neurons, including supporting neuronal survival, inducing morphological differentiation, and regulating a host of target genes that specify neuronal phenotype. It is not known if all such regulatory effects are obligatory, or if some may vary depending on the cell context in which the receptors are expressed. We have examined this issue by comparing neurotrophin effects on the regulation of electrical excitability and morphological differentiation in two strains of PC12 cells. We found that while neurotrophins induced neurite extension and increased calcium currents in both PC12 cell types, sodium current levels were regulated in only one of these strains. Moreover, we found little correlation between calcium current levels and the extent of morphological differentiation when compared in individual cells of a single strain. Thus, the regulatory effects of neurotrophins on cell phenotype are not fully determined by the Trk receptors that they activate; rather, they can vary with differences in cell context that arise not only between different cell lineages, but also between individual cells of clonal relation.
Neurotrophins are well established as growth factors that regulate the survival and differentiation of many neuronal cell types. Although neurotrophins can elicit diametrically opposite effects—proliferation in fibroblast cells, for instance, versus differentiation in PC12 cells—these divergent actions of neurotrophins have only been studied between very different cell types. Little is known about how more subtle differences among cells of similar type and origin influence the regulation of cell phenotype by neurotrophins.
This issue arises even at the earliest stages of nervous system development, when multiple cell types must be generated from homogeneous populations of precursor cells—such determination of cellular phenotype depends upon both extracellular signals and intrinsic properties of individual cells (1, 2). Peptide growth factors have been shown to be important extracellular signals in these processes, inducing proliferation [e.g., basic fibroblast growth factor (bFGF)] or neuronal differentiation [e.g., neurotrophin-3 (NT-3)], depending on the identity of the factor (3, 4). Multiple cell types arise even in the absence of apparent differences in environment, implying that intrinsic differences among precursor cells can generate diversity in their progeny. In vitro, single, clonally derived cortical precursor cells placed in separate but identical environments generate neuronal and nonneuronal cells that vary considerably in their ratios and phenotypes (5). In vivo, cortical proliferative zone cells divide asymmetrically in the horizontal plane, enabling one daughter cell to become a postmitotic neuron while the other remains a mitotic precursor cell (6). Mechanisms such as specific orientation of the cleavage plane may engender the asymmetric localization of proteins important in determining cellular phenotype (7).
To what extent, then, do extracellular signals such as neurotrophins influence cellular phenotype, and to what extent is phenotype determined by the cell itself? To address this question, we examined two hallmarks of neurotrophin-induced neuronal differentiation—excitability and morphology—and compared how their regulation by each of the neurotrophins differs between closely related neuronal precursor cell types. First, we examined differences in the ability of neurotrophins to regulate voltage-gated sodium and calcium currents in two different strains of PC12 cells: native, which express only TrkA, and PC12nnr5 cells, PC12 cells that express none of the Trk receptors (8). Responsiveness to specific neurotrophins—nerve growth factor (NGF), brain-derived neurotrophic factor (BDNF), NT-3, and NT-4/5 (9)—was conferred using gene transfection to introduce TrkA, TrkB, or TrkC cDNAs into these cells. We were thus able to measure the effects of each neurotrophin on a clonal population of cells and to determine if the same profile of phenotypic changes was induced by neurotrophins in two closely related cell types. We found that while neurotrophins increased voltage-gated calcium currents in both PC12 strains, they increased voltage-gated sodium currents in only one of these strains.
Second, we asked how neurotrophin regulation of cell size (a measure of the extent of morphological differentiation) and calcium currents varied within a clonal population of PC12 cells. Although both of these phenotypic aspects were strongly regulated in both PC12 strains, the relative amount of cell growth versus calcium current expression among individual cells of the same strain differed dramatically. Thus, not only cell strain/type differences, but also contextual differences among clonally related cells, can modulate—and perhaps respecify—the regulatory effects of neurotrophins on cell phenotype.
MATERIALS AND METHODS
Biolistic Transfection and Plasmids.
Cells were transiently transfected to express Trk receptors using biolistic transfection, a method in which gold particles coated with plasmid DNA are accelerated at high velocity into cells (10). A standard protocol was followed using a PDS-1000 biolistics device (Bio-Rad) (11); rupture pressure was 900 psi with cells placed 9 cm from the pressure aperture. The expression construct for trkA contained a human trkA cDNA driven by cytomegalovirus (CMV) in pCMV5 (generous gift of M. Chao, Cornell University Medical College, New York); that for trkB contained rat trkB cDNA (generous gift of Regeneron Pharmaceuticals, Tarrytown, NY) subcloned into the EcoRI site behind CMV in pcDNA1/Amp (Invitrogen); and that for trkC contained a rat cDNA for trkC driven by CMV in pcDNA1neo (Regeneron Pharmaceuticals). Sham transfections of the two PC12 cell lines used a CMV–reporter construct encoding green fluorescent protein (GFP; generous gift of M. Chalfie, Columbia University).
Cell Culture.
Cell lines were maintained in tissue culture flasks and plated onto 35-mm culture dishes (Corning) for electrophysiology experiments. All media components were from GIBCO/BRL. Recombinant human BDNF, NT-3, and NT-4/5 (generously provided by Regeneron Pharmaceuticals) and purified mouse 2.5s NGF (Collaborative Biomedical Products, Bedford, MA) were used at a final concentration of 100 ng/ml. Cells used in experiments were fed medium and factor every 2–3 days; control and treated cells were of the same passage number (<40). Cells were transfected via biolistics and/or treated with neurotrophin the day after plating, and used 3–8 days afterwards.
PC12trkB cells (ref. 12; generous gift of Regeneron Pharmaceuticals) were grown in DMEM with 6% fetal bovine serum, 6% horse serum, 100 units/ml penicillin–streptomycin, 1% l-glutamine, and 0.4 mg/ml G418, at 37°C with 7.5% CO2. In cells transiently transfected with trkC (see below), morphological differentiation (neurite extension and somal enlargement) was apparent 2–3 days after transfection and NT-3 treatment. Control cells associated with a biolistically transfected group were either (i) neither transfected nor neurotrophin-treated, (ii) transfected but not neurotrophin-treated, or (iii) not transfected but neurotrophin-treated. Comparison of ionic currents in untreated, sham-transfected (with GFP or both GFP and trkC expression constructs) cells showed that biolistics itself had no significant effects on sodium current levels (controls, 0.08 ± 0.02 nA, n = 13; transfected, 0.11 ± 0.04 nA, n = 12; P > 0.6 by ANOVA), calcium currents (controls, 0.26 ± 0.04 nA, n = 4; transfected, 0.33 ± 0.06 nA, n = 12; P > 0.6), or capacitance (controls, 26 ± 1 pF, n = 4; transfected, 31 ± 4 pF, n = 12; P > 0.5). Because no significant differences were observed between different control groups, these current measurements were pooled.
PC12nnr5 cells (ref. 8; generous gift of L. Greene) were grown on collagen in Opti-MEM with 1% N2, 100 units/ml penicillin–streptomycin, and 1% l-glutamine at 37°C with 7.5% CO2. The procedures for transfected cells and their associated controls were as described for trkC and NT-3 in PC12trkB cells. Measured levels in untreated, sham-transfected (with GFP or both GFP and trkB expression constructs) cells were indistinguishable in calcium current levels (controls, 40 ± 3 pA, n = 50; transfected, 44 ± 5 pA, n = 6; P > 0.6) and capacitance (controls, 18 ± 1 pF, n = 56; transfected, 22 ± 2 pF, n = 6; P > 0.1).
Electrophysiology.
Data included in this study were from over 600 cells. Sylgard-coated patch pipettes had resistances of 2–5 MΩ. Whole-cell patch clamp recordings were made using standard techniques (13) with an Axopatch-1D patch clamp amplifier (Axon Instruments, Foster City, CA). Data were sampled at 100- and 500-μsec intervals for sodium and calcium currents, respectively, and filtered at 5 kHz. Subsequent digital filtering was performed as in ref. 14. Cell capacitances were measured by integration and compensated for manually using patch clamp circuitry; residual capacitance and leak currents were subtracted digitally. Holding potential was −70 mV; voltage steps were made at 1 Hz. Statistical significance of the data was determined in all cases by ANOVA.
For PC12trkB cells, the external saline contained 130 mM NaCl, 2 mM MgCl2, 10 mM CaCl2, 10 mM Hepes, adjusted to pH 7.2 with NaOH. Potassium currents were blocked using an internal solution containing 128 mM CsCl, 2 mM MgCl2, 1 mM CaCl2, 11 mM EGTA, and 5 mM Hepes, adjusted to pH 7.2 with CsOH. Sodium and calcium currents were easily distinguished by their distinct kinetic properties. Sodium currents were measured by subtracting calcium currents extrapolated to t = 0 from the sodium current peak. Peak calcium currents were measured 25 msec after the voltage step; the accuracy of these methods was confirmed using tetrodotoxin to isolate calcium currents (15).
Sodium currents were measured similarly in PC12nnr5 cells. Due to the small amplitude of calcium relative to sodium currents, calcium currents were isolated and measured separately using an external solution of 130 mM tetraethylammonium (TEA)-Cl, 10 mM CaCl2, 2 mM MgCl2, 10 mM Hepes, 5 mM 4-aminopyridine, adjusted to pH 7.2 with TEA-OH. The internal solution contained 120 mM CsCl, 20 mM TEA-Cl, 2 mM MgCl2, 11 mM EGTA, 1 mM CaCl2, 10 mM Hepes, adjusted to pH 7.2 with CsOH.
Immunocytochemistry.
Cells were fixed in 4% paraformaldehyde/5% sucrose in PBS for 15 min, incubated with a primary antibody to the intracellular domain of TrkC (1:500; Santa Cruz Biotechnology), and visualized with a horseradish peroxidase-conjugated goat anti-rabbit secondary antibody (1:250; Vector Laboratories) followed by diaminobenzidine treatment.
RESULTS
To study neurotrophin regulation of electrical and morphological aspects of differentiation, we used whole-cell recording techniques to measure levels of functional voltage-gated ion channels and cell capacitance before and after neurotrophin treatment. In two strains of PC12 cells representing closely related cellular contexts (see below), responsiveness to a neurotrophin, if not already present, was generated by transfection of exogenous trk receptors. Trk receptors expressed in these cells were activated by their primary neurotrophin ligand; that is, NGF was used to activate TrkA, NT-4/5, or BDNF to activate TrkB, and NT-3 to activate TrkC (12).
Exogenous Expression of Trk Receptors in PC12 and PC12nnr5 Cells.
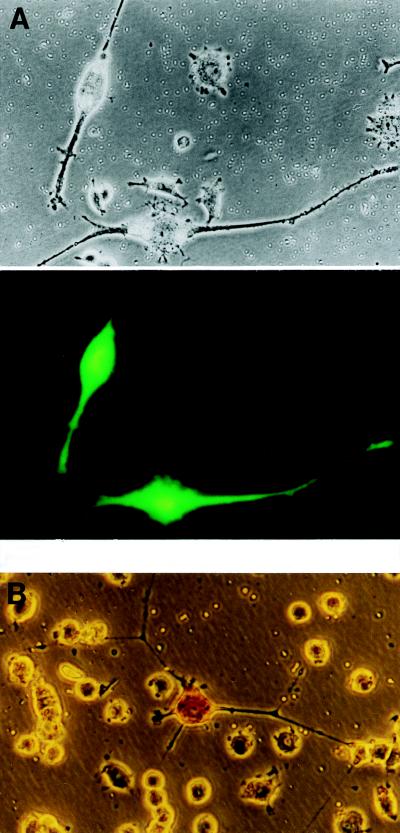
The first cell line used, PC12trkB, are PC12 cells stably transfected to express TrkB in addition to their native TrkA receptors, and thereby respond to NGF, NT-4/5, and BDNF (12). To generate responsiveness to NT-3, PC12trkB cells were transiently transfected with trkC using biolistics. Successfully transfected cells were identified visually and confirmed by GFP cotransfection or TrkC immunostaining (Fig. 1A). The PC12trkB cell line thus afforded a common cell background capable of responding to all neurotrophins.
Figure 1.
trkC transfection confers NT-3 responsiveness to PC12trkB and PC12nnr5 cells. (A) (Upper) NT-3 treatment caused extensive neurite and cell body growth in PC12trkB cells transfected with trkC. Untransfected cells in the field were unable to respond to NT-3, remaining small and spherical. (Lower) Cotransfection with GFP confirmed that only trkC-transfected cells responded to NT-3 treatment. (B) PC12nnr5 cells transfected with trkC extend long neurites in response to NT-3. Transfected cells stained with an antibody to TrkC (note dark cell body of the neurite-bearing cell), while nontransfected cells remained small and round.
The second cell line used was PC12nnr5 cells which, unlike their parental PC12 cells, are unresponsive to NGF due to lack of TrkA expression (8, 16, 17). Importantly, these cells appear to be deficient only at the receptor level, as transfection of trkA into these cells restores full NGF binding and responsiveness, including morphological differentiation and the expression of several diagnostic late genes (16, 17). Because PC12nnr5 cells do not express any functional Trk receptors, they provided a “blank” background that could be transfected with trkA, trkB, or trkC using biolistics, and then treated with the corresponding neurotrophin (Fig. 1B). Because only one subtype of Trk receptor was expressed at a time, these cells precluded the possibility of cross-activation or interactions among multiple Trk receptor subtypes.
In all cases, cells expressing Trk receptors responded by neurite extension to corresponding neurotrophins within 2–3 days after treatment. Consistent changes in voltage-gated calcium and sodium current levels were first detected after 3 days of treatment.
Neurotrophin Regulation of Ionic Currents in PC12trkB Versus PC12nnr5 Cells.
Neurotrophin effects on excitability were characterized by measurement of calcium and sodium currents, two voltage-gated ionic current species central to neuronal excitability.
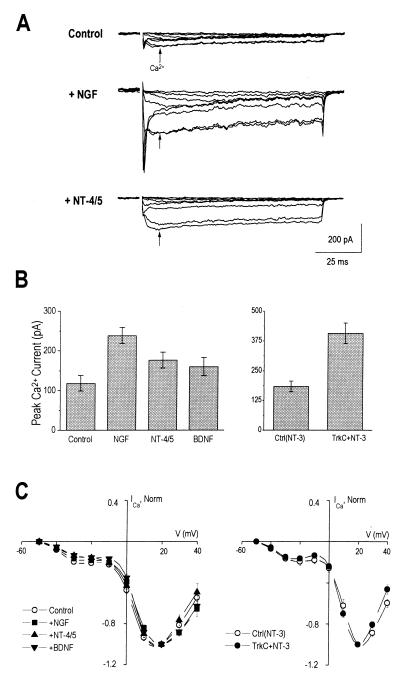
Calcium currents. In untreated PC12trkB cells, voltage-gated calcium currents were uniformly small, on the order of 100 pA at peak. Calcium currents increased in response to activation of each of the three Trk receptors (Fig. 2 A and B), although different neurotrophins increased currents to varying degrees (1.5- to 2.2-fold). Functionally, the total calcium current expressed was similar for all neurotrophins, comprising both low voltage-activated (LVA)- and high voltage-activated (HVA)-type channels. The relative contribution of these two classes of calcium channels was not affected by neurotrophin treatment, indicated by the similarity of normalized I–V relations between neurotrophin-treated and control cells (Fig. 2C). Additionally, calcium channel inactivation, measured by comparing peak to steady-state current, was not significantly different among treated and control cells, suggesting that the relative contribution of inactivating and non-inactivating calcium current types did not change with neurotrophin treatment (Table 1).
Figure 2.
Neurotrophins increase voltage-gated calcium currents in PC12trkB cells, but do not affect the relative contribution of different calcium current subtypes. (A) Whole-cell calcium currents (arrows) were easily distinguished from sodium currents by their slow activation kinetics and little inactivation. Representative traces show increased calcium currents in neurotrophin-treated cells compared to controls. Currents were elicited by voltage steps to between −50 and +20 mV in 10 mV increments from a prepulse of −120 mV. Traces were digitally filtered at 400 Hz. (B) Average peak calcium currents increased following treatment with (Left) NGF, NT-4/5, and (Right) NT-3. NGF increased peak calcium currents 2.0-fold over controls (NGF-treated, 0.24 ± 0.02 nA, n = 31; controls, 0.12 ± 0.02, n = 22; P < 5 × 10⁻⁴). NT-4/5 increased calcium currents by 1.5-fold (0.18 ± 0.02, n = 18, P < 0.05), but BDNF had no significant effect (0.16 ± 0.02, n = 20, P > 0.15). NT-3 also increased calcium currents in trkC-transfected cells, by 2.2-fold (0.41 ± 0.04, n = 33) compared to controls (0.18 ± 0.02, n = 19, P < 5 × 10⁻⁴). (C) Normalized current–voltage (I–V) relations for calcium currents were indistinguishable between control and neurotrophin-treated groups. Superposition of NGF- and NT-4/5 with BDNF-treated groups and controls (Left), as well as trkC plus NT-3 cells with their associated controls (Right) indicated that although neurotrophins increased current amplitude, overall voltage dependence of calcium currents were unchanged. The estimated contribution of low voltage activated (LVA)-type calcium current relative to total current, measured by the ratio of current at −20 mV to +20 mV, was 0.2 in all cases. Averaged I–V relations for each group were normalized to peak current levels at +20 mV; mean ± SE are shown.
Table 1.
Neurotrophins did not alter the inactivation properties of calcium currents in PC12trkB cells
| Peak to steady-state Ca2+ current ratio | n | |
|---|---|---|
| Control | 1.3 ± 0.04 | 25 |
| NGF | 1.3 ± 0.04 | 44 |
| NT-4/5 | 1.3 ± 0.02 | 24 |
| BDNF | 1.3 ± 0.03 | 27 |
| Control (NT-3) | 1.4 ± 0.08 | 18 |
| TrkC + NT-3 | 1.6 ± 0.08 | 31 |
The degree of calcium channel inactivation, reflecting the relative contribution of different current subtypes to the total calcium current, was measured by comparing peak calcium current at 25 msec (reflecting the transient component) to steady-state calcium current at 75 msec (reflecting the non-inactivating component). Mean ± SE are shown; all P > 0.1.
In untreated PC12nnr5 cells, voltage-gated calcium currents were also uniformly low, and increased significantly in trkA-, trkB-, and trkC-transfected, neurotrophin-treated cells (Fig. 3 A and B). Peak calcium currents were increased 2- to 3-fold by all neurotrophins, but neither voltage-dependence of steady-state currents (Fig. 3C) nor the relative contribution of LVA-type calcium currents (Table 2) was significantly altered. Thus, as in PC12trkB cells, TrkA, TrkB, and TrkC activation in PC12nnr5 cells all appeared to increase functional types of calcium current already expressed at low levels in untreated cells.
Figure 3.
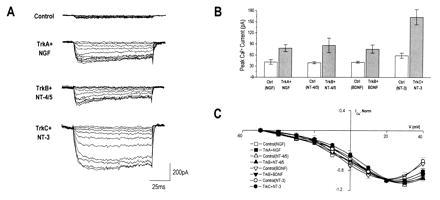
Neurotrophins regulate the level, but not the voltage dependence, of calcium currents in trk-transfected PC12nnr5 cells. (A) PC12nnr5 cells were transfected with trkA, trkB, or trkC and treated with NGF, NT-4/5 or BDNF, or NT-3, respectively. Representative calcium currents are shown for control and neurotrophin-treated cells, elicited by voltage steps to between −50 and +40 mV in 10 mV increments from a prepulse of −120 mV. (B) Average peak calcium currents increased 2- to 3-fold in response to all of the neurotrophins. Mean currents (±SE, pA): TrkA plus NGF, 79 ± 9 (n = 53), controls 41 ± 6 (n = 38); TrkB plus NT-4/5, 86 ± 20 (n = 15), controls, 39 ± 3 (n = 30); TrkB plus BDNF, 76 ± 11 (n = 28), controls, 41 ± 3 (n = 56); TrkC plus NT-3, 162 ± 20 (n = 39), controls, 59 ± 7 (n = 46). All paired P values <0.005. (C) Averaged calcium I–V relations (normalized to peak current at +20 mV) revealed no significant differences between control (open symbols) and transfected, neurotrophin-treated cells (filled symbols). As in PC12trkB cells, the estimated contribution of LVA-type calcium current at −20 mV, relative to total calcium current at +20 mV, was ≈0.2 for all groups.
Table 2.
Neurotrophins did not alter the inactivation properties of calcium currents in PC12nnr5 cells
| % prepulse inactivation | n | |
|---|---|---|
| Control (NGF) | 10 ± 4 | 12 |
| TrkA + NGF | 15 ± 2 | 21 |
| Control (BDNF) | 15 ± 3 | 15 |
| TrkB + BDNF | 14 ± 4 | 14 |
| Control (NT-3) | 16 ± 5 | 16 |
| TrkC + NT-3 | 10 ± 5 | 10 |
Prepulse inactivation of LVA-type calcium channels, a measure of their contribution to the total calcium current, was not significantly different in neurotrophin-treated cells versus controls (mean ± SE, P > 0.2 for all groups). The degree of inactivation was measured as the percent change in current amplitude elicited by a depolarizing pulse following a −40 mV prepulse relative to a −120 mV prepulse.
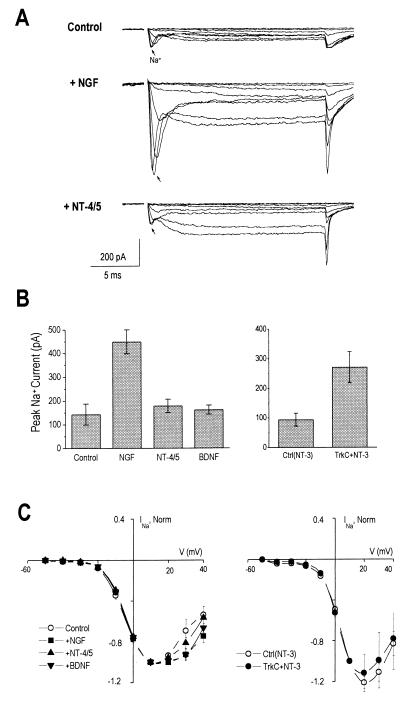
Sodium currents. As with basal calcium current levels in these two cell lines, sodium currents in untreated PC12trkB cells were consistently small, averaging <150 pA at peak. Upon activation of TrkA with NGF or TrkC with NT-3, peak sodium current levels increased ≈3-fold (Fig. 4 A and B). In contrast, activation of TrkB had no effect—neither NT-4/5 nor BDNF affected sodium currents significantly. Similar to neurotrophin-induced increases in calcium current, the large increases in peak sodium current produced by TrkA and TrkC activation did not appear to involve different types of sodium current, since comparison of I–V relations showed that the voltage dependencies of peak sodium current were indistinguishable among all neurotrophin-treated and control cells (Fig. 4C, but see ref. 18). Thus, at a functional level, sodium currents induced by NGF and NT-3 differed only in magnitude from controls.
Figure 4.
NGF and NT-3 increase sodium currents in PC12trkB cells, but do not affect the voltage dependence of the currents. (A) Whole-cell currents were recorded on a fast time scale to analyze sodium currents (arrows), elicited as in Fig. 2A. Traces were digitally filtered at 2 kHz. (B Left) NGF increased average peak sodium currents by 3.1-fold (mean ± SE, nA: 0.45 ± 0.05, n = 32) relative to untreated cells (0.14 ± 0.04, n = 21, P < 10−4). Neither NT-4/5 (0.18 ± 0.03, n = 16) nor BDNF (0.16 ± 0.02, n = 22), however, affected sodium current levels significantly (p > 0.5). (Right) NT-3 increased peak sodium currents by 2.9-fold in trkC-transfected PC12trkB cells (0.27 ± 0.05, n = 21), relative to controls (0.09 ± 0.02, n = 18, P < 5 × 10⁻³). (C) Averaged I–V relations for sodium currents (normalized to peak current at +10 mV) were not affected by neurotrophin treatment.
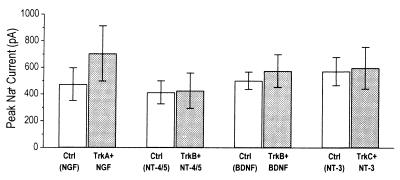
While activation of TrkA and TrkC strongly regulated voltage-gated sodium currents in PC12trkB cells, activation by TrkA, TrkB, or TrkC did not alter sodium current levels in PC12nnr5 cells (Fig. 5). Because activation of these receptors in the same cells induced substantial increases in both calcium currents and cell size (see below), transfected PC12nnr5 cells did express functional levels of exogenous Trk receptors. Thus, the lack of sodium current induction indicated that neurotrophins are unable to regulate sodium currents in the context of PC12nnr5 cells.
Figure 5.
Sodium currents are not regulated by neurotrophins in PC12nnr5 cells. No significant differences in average peak sodium currents were observed between any of the trk-transfected, neurotrophin-treated PC12nnr5 cells (filled bars) and their controls (open bars). Mean currents ± SE (nA) are as follows: TrkA plus NGF, 0.71 ± 0.21 (n = 23), controls, 0.47 ± 0.12 (n = 17); TrkB plus NT-4/5, 0.43 ± 0.13 (n = 14), controls, 0.41 ± 0.09 (n = 10); TrkB plus BDNF, 0.58 ± 0.12 (n = 24), controls, 0.50 ± 0.07 (n = 24); TrkC plus NT-3, 0.60 ± 0.16 (n = 21), controls, 0.57 ± 0.11 (n = 14). All paired P values >0.4.
Neurotrophin Regulation of Neurite Outgrowth Versus Calcium Current Levels in PC12nnr5 Cells.
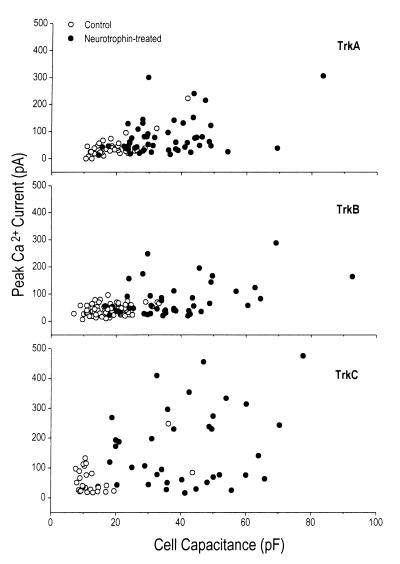
The effects of neurotrophins on the morphology of trk-transfected PC12nnr5 cells, like the effects on calcium currents, were substantial (Fig. 1). Morphological differentiation was quantified by cell capacitance, which is proportional to total membrane surface area. Average 2- to 3-fold increases in calcium currents were paralleled by 2- to 3-fold increases in capacitance, which at first suggested that calcium current density (current amplitude/membrane area) was not significantly changed by neurotrophins. Indeed, in no case did neurotrophins significantly affect current density in either cell type. However, when we compared cell size and calcium current level in individual cells, it became evident that these aspects of cell phenotype were not always concomitantly regulated (Fig. 6). Only a subset of cells responded to neurotrophins by increasing both calcium current and cell size, while a substantial number of cells responded primarily with an increase in only one of these parameters. This was most apparent in trkC-transfected PC12nnr5 cells treated with NT-3, which showed the greatest changes in calcium current and cell size, but often in only one or the other for a given cell (Fig. 6). In fact, we underestimated the lack of correlation between cell size and calcium current regulation, since the identification of successfully transfected cells excluded cells that did not extend processes but may have shown increases in calcium current. A similar lack of correlation between capacitance and voltage-gated current changes was also observed in PC12trkB cells (data not shown). Thus, calcium current regulation, rather than being a secondary effect of increases in cell size, represents an independent regulatory target of Trk receptors distinct from those underlying changes in cell morphology.
Figure 6.
Calcium current and cell size are not coregulated by neurotrophins in PC12nnr5 cells. Peak calcium currents were plotted against capacitance for individual cells. Control cells (open symbols) clustered in the lower left portion of the graph, indicating that calcium currents and cell sizes were small and varied minimally. trk-transfected, neurotrophin-treated cells (filled symbols) showed increased calcium currents and cell sizes, but notably, often one increased without the other. (Top) trkA plus NGF and associated controls. (Middle) trkB plus NT-4/5 or trkB plus BDNF, and controls. (Bottom) trkC plus NT-3 cells and controls.
DISCUSSION
We have examined whether neurotrophins induce an obligatory and fixed program of differentiation in target cells, or whether aspects of phenotypic regulation by neurotrophins may vary depending on cell context. Although neurotrophins can have quite different effects on cells of unrelated type (ref. 12; for reviews, see refs. 19 and 20), much less is known about how more subtle variations between cells of common origin or, indeed, between cells of clonal origin, can give rise to differences in the interpretation of neurotrophin signals. In these experiments, we used the regulation of functional ion channel levels and cell size as indicators of neuronal differentiation, reasoning that membrane excitability is a particularly sensitive measure of the individuality of different neurons and neuronal cell types.
Our results indicate that subtle differences in cell context can indeed have major effects on the regulatory actions of neurotrophins. We found, comparing two closely related neuronal cell lines, that while voltage-gated calcium currents were regulated by activation of any of the Trk receptors in both PC12trkB and PC12nnr5 cells, voltage-gated sodium currents could be regulated by neurotrophins only in PC12trkB cells. We also found that among individual PC12nnr5 cells, there was independent and often divergent regulation of cell size vs. calcium current levels, indicating that the degree to which a given neurotrophin regulates particular target proteins varies, even among cells of the same type. Cellular context, in addition to Trk receptor identity, was thus important in specifying the precise phenotypic consequences of neurotrophin-induced differentiation.
Although we did not directly measure transfected Trk receptor levels, it is unlikely that variable levels of Trk expression could account for the phenotypic differences (or similarities) we observed between cell types and individual cells. First, latency and rate of neurite extension in PC12 cells are proportional to Trk receptor levels; a 20-fold overexpression of TrkA enables neurites to extend within a few hours of NGF application instead of 2–3 days for endogenous levels of Trk expression (21). In our experiments, overt neurite extension was always first observed 2–3 days after neurotrophin treatment of transfected cells, and the extents of morphological differentiation were comparable between different trk-transfected populations (Fig. 6). These data strongly suggest that expression levels of the different Trk receptors were not substantially different. Second, the lack of correlation between cell capacitance and current expression (Fig. 6, sodium data not shown) further argues against a dependence of ionic current regulation on receptor level.
It was striking that, in every case of current regulation, neurotrophins increased levels of some or all of the ionic current types already expressed at basal levels in untreated cells. This result suggests that only a certain set of ion channels in a given cell is available for potential regulation by neurotrophins. Although our data show that these ion channels are not obligatory targets of neurotrophin regulation, they may constitute a subset of ion channel genes to which neurotrophins are constrained in regulating membrane excitability.
Beyond their basal effects on neuronal survival, neurotrophins have been proposed to have instructive effects on neuronal phenotype that may be involved in the development and plasticity of neural circuitry (22, 23). If so, then it would not be surprising, as we have found, that at least some of the regulatory effects of neurotrophins are dependent on the “cell context” of target neurons, as determined by factors such as cell lineage, stage of cell cycle, orientation of cell division, microenvironment, and history of electrical activity. Indeed, such differences may account for conflicting results observed by different labs studying neurotrophin effects on similar cell strains (24–28).
While our experiments do not address the molecular mechanisms by which cell context determines the actions of a given Trk receptor, it is unlikely that the precise cellular differences between PC12trkB and PC12nnr5 cells, or between individual PC12nnr5 cells, would be generalizable to all cell types. Our data show that even among cells of the same origin, the activation of a specific receptor type alone does not fully determine the downstream consequences of that receptor. Thus, at least in terms of intrinsic excitability and cell size, cell context can have substantial effects on the way target cells interpret neurotrophin signals. It is possible that other target genes and proteins required for all neurons may be obligatory targets of neurotrophin regulation. In support of this idea, we found that neurotrophins induced neurite extension in both cell lines studied, a process that involves the coordinate regulation of a large number of target genes (29).
Acknowledgments
We thank N. Ip, R. Lindsay, and Regeneron Pharmaceuticals for generously providing neurotrophins, trk cDNAs, and PC12trkB cells, and for advice and support. We also thank M. Chao for the trkA cDNA construct; M. Chalfie for GFP clones; D. Sherwood, D. Riddle, and D. Chikaraishi for helpful discussions; and S. Won for work on the trkB expression construct. This work was supported by the Bryan Scholars Fund (N.T.S.), a Sigma-Xi Grant-in-Aid of Research, the Ruth K. Broad Foundation (S.S.L.), the McKnight Endowment Fund for Neuroscience, the Alfred P. Sloan Foundation, and National Institutes of Health Grant NS32742 (D.C.L.).
ABBREVIATIONS
- NT
neurotrophin
- BDNF
brain-derived neurotrophic factor
- NGF
nerve growth factor
- GFP
green fluorescent protein
- LVA
low voltage activated
- I–V
current–voltage
References
- 1.Temple S, Qian X. Neuron. 1995;15:249–252. doi: 10.1016/0896-6273(95)90030-6. [DOI] [PubMed] [Google Scholar]
- 2.McConnell S K. Neuron. 1995;15:761–768. doi: 10.1016/0896-6273(95)90168-x. [DOI] [PubMed] [Google Scholar]
- 3.Ghosh A, Greenberg M E. Neuron. 1995;15:89–103. doi: 10.1016/0896-6273(95)90067-5. [DOI] [PubMed] [Google Scholar]
- 4.Vicario-Abejon C, Johe K K, Hazel T G, Collazo D, McKay R D G. Neuron. 1995;15:105–114. doi: 10.1016/0896-6273(95)90068-3. [DOI] [PubMed] [Google Scholar]
- 5.Davis A A, Temple S. Nature (London) 1994;372:263–266. doi: 10.1038/372263a0. [DOI] [PubMed] [Google Scholar]
- 6.Chenn A, McConnell S K. Cell. 1995;82:631–641. doi: 10.1016/0092-8674(95)90035-7. [DOI] [PubMed] [Google Scholar]
- 7.Rhyu M S, Knoblich J A. Cell. 1995;82:523–526. doi: 10.1016/0092-8674(95)90022-5. [DOI] [PubMed] [Google Scholar]
- 8.Green S H, Rydel R E, Connolly J L, Greene L A. J Cell Biol. 1986;102:830–843. doi: 10.1083/jcb.102.3.830. [DOI] [PMC free article] [PubMed] [Google Scholar]
- 9.Lindsay R M, Wiegand S J, Altar A, DiStefano P S. Trends Neurosci. 1994;17:182–190. doi: 10.1016/0166-2236(94)90099-x. [DOI] [PubMed] [Google Scholar]
- 10.Pecorino L T, Lo D C. Curr Biol. 1992;2:30–32. doi: 10.1016/0960-9822(92)90421-6. [DOI] [PubMed] [Google Scholar]
- 11.Lo D C, McAllister A K, Katz L C. Neuron. 1994;13:1263–1268. doi: 10.1016/0896-6273(94)90412-x. [DOI] [PubMed] [Google Scholar]
- 12.Ip N Y, Stitt T N, Tapley P, Klein R, Glass D J, Fandl J, Greene L A, Barbacid M, Yancopoulos G D. Neuron. 1993;10:137–149. doi: 10.1016/0896-6273(93)90306-c. [DOI] [PubMed] [Google Scholar]
- 13.Hamill O, Marty A, Neher E, Sakmann B, Sigworth F. Pflügers Arch. 1981;391:85–100. doi: 10.1007/BF00656997. [DOI] [PubMed] [Google Scholar]
- 14.Colquhoun D, Sigworth F J. In: Single-Channel Recording. Sakmann B, Neher E, editors. New York: Plenum; 1983. pp. 191–263. [Google Scholar]
- 15.Lesser S S, Lo D C. J Neurosci. 1995;15:253–261. doi: 10.1523/JNEUROSCI.15-01-00253.1995. [DOI] [PMC free article] [PubMed] [Google Scholar]
- 16.Loeb D M, Maragos J, Martin-Zanca D, Chao M V, Parada L F, Greene L A. Cell. 1991;66:961–966. doi: 10.1016/0092-8674(91)90441-z. [DOI] [PubMed] [Google Scholar]
- 17.Loeb D M, Greene L A. J Neurosci. 1993;13:2919–2929. doi: 10.1523/JNEUROSCI.13-07-02919.1993. [DOI] [PMC free article] [PubMed] [Google Scholar]
- 18.Toledo-Aral J J, Brehm P, Halegoua S, Mandel G. Neuron. 1995;14:607–611. doi: 10.1016/0896-6273(95)90317-8. [DOI] [PubMed] [Google Scholar]
- 19.Snider W D. Cell. 1994;77:627–638. doi: 10.1016/0092-8674(94)90048-5. [DOI] [PubMed] [Google Scholar]
- 20.Levi-Montalcini R, Skaper S D, Dal Toso R, Petrelli L, Leon A. Trends Neurosci. 1996;19:514–519. doi: 10.1016/S0166-2236(96)10058-8. [DOI] [PubMed] [Google Scholar]
- 21.Hempstead B L, Rabin S J, Kaplan L, Reid S, Parada L F, Kaplan D R. Neuron. 1992;9:883–896. doi: 10.1016/0896-6273(92)90241-5. [DOI] [PubMed] [Google Scholar]
- 22.Thoenen H. Science. 1995;270:593–598. doi: 10.1126/science.270.5236.593. [DOI] [PubMed] [Google Scholar]
- 23.Lo D C. Neuron. 1995;15:979–981. doi: 10.1016/0896-6273(95)90085-3. [DOI] [PubMed] [Google Scholar]
- 24.Fanger G R, Jones J R, Maue R A. J Neurosci. 1995;15:202–213. doi: 10.1523/JNEUROSCI.15-01-00202.1995. [DOI] [PMC free article] [PubMed] [Google Scholar]
- 25.Usowicz M M, Porzig H, Becker C, Reuter H. J Physiol (London) 1990;426:95–116. doi: 10.1113/jphysiol.1990.sp018128. [DOI] [PMC free article] [PubMed] [Google Scholar]
- 26.Garber S, Hoshi T, Aldrich R W. J Neurosci. 1989;9:3976–3987. doi: 10.1523/JNEUROSCI.09-11-03976.1989. [DOI] [PMC free article] [PubMed] [Google Scholar]
- 27.Streit J, Lux H D. Pflügers Arch. 1987;408:634–641. doi: 10.1007/BF00581167. [DOI] [PubMed] [Google Scholar]
- 28.O’Lague P H, Huttner S L, Vandenberg C A, Morrison-Graham K, Horn R. J Neurosci Res. 1985;13:301–321. doi: 10.1002/jnr.490130120. [DOI] [PubMed] [Google Scholar]
- 29.Halegoua S, Armstrong R C, Kremer N E. Curr Top Microbiol Immunol. 1991;165:119–170. doi: 10.1007/978-3-642-75747-1_7. [DOI] [PubMed] [Google Scholar]


