Abstract
Periventricular leukomalacia is characterized by a reduction in brain matter and secondary ventriculomegaly and is a major cause of developmental delay and cerebral palsy in prematurely born infants. Currently, our understanding of the pathogenesis of this condition is limited. In animal models, features of periventricular leukomalacia can be induced by hypoxia and activation of A1 adenosine receptors (A1ARs). Using mice that are deficient in the A1AR gene (A1AR–/–), we show that A1ARs play a prominent role in the development of hypoxia-induced ventriculomegaly in neonates. Supporting a role for adenosine in the pathogenesis of developmental brain injury, ventriculomegaly was also observed in mice lacking the enzyme adenosine deaminase, which degrades adenosine. Thus, adenosine acting on A1ARs appears to mediate hypoxia-induced brain injury ventriculomegaly during early postnatal development.
Keywords: brain, premature, infant, periventricular leukomalacia
Periventricular leukomalacia (PVL) is a neurological disorder characterized by reduction in white matter tissue in periventricular and other brain regions (1, 2). The loss of parenchymal brain tissue results in secondary ventricular expansion, or ventriculomegaly (1, 3–5). Five to 10 percent of very low birth weight preterm infants will manifest some form of PVL, making it one of the most common forms of brain injury currently affecting premature infants (1). PVL is associated with significant morbidity, as affected individuals may have intellectual impairment, alterations in visual function, and cerebral palsy (4, 6, 7).
Two forms of PVL have been described: diffuse PVL, characterized by a general loss of cortical matter (1), and focal PVL, which involves local necrosis with secondary cyst formation deep in the cerebral white matter (1). Risk factors for PVL include perinatal stress, sepsis, hypoxia, and premature birth (1). In animal models, a PVL-like phenotype can be induced by exposure of neonates to hypoxia or reduction in cerebral blood flow (8–10).
Recently, we found that treatment of rats with an A1 adenosine receptor (A1AR) agonist during early postnatal life induces a PVL-like phenotype (11), which includes ventriculomegaly, reduction in white and gray matter volumes, reduced myelin basic protein (MBP) expression, and diminished total axon volume (11). These observations raise the possibility that the adenosinergic system may play a role in PVL pathogenesis.
Adenosine is a nucleoside that can be released by all cells (12). After increased tissue activity, hypoxia, or ischemia, adenosine levels increase >100-fold, triggering activation of ARs (13, 14). To date, four ARs have been identified, including A1R and A3R that couple to Gi/Go and A2AR and A2BR that couple to Gs/Golf (15–18). Of these different receptors, A1ARs have a high affinity for adenosine and are fully activated when adenosine levels increase ≈10-fold over basal concentrations (19). In the brain, A1ARs are abundant and widely expressed (20, 21). In comparison, A2AARs are predominantly expressed in striatum, whereas A2BAR and A3AR expression in brain is difficult to detect (22, 23). During development, A1AR expression in the nervous system of rodents is seen as early as embryonic day 12. By the end of gestation, A1ARs are expressed (24), albeit not at adult levels. Because A1AR activation can induce PVL and adenosine levels increase with hypoxia (25), we hypothesized that adenosine acting on A1ARs may play a role in the pathogenesis of PVL. To test this hypothesis, A1AR knockout mice that have been previously characterized and do not have nervous system defects (26) were studied after hypoxic rearing.
Methods and Materials
Mice. C57-BL6/OlaHsd A1AR-deficient mice (A1AR–/–), which have been described (26), were used. We determined A1AR animal genotypes by PCR having first confirmed that PCR-based genotyping and Southern blot analysis give equivalent results for genotyping. The PCR primer pairs used were: TAC ATT GGC ATC GAG GTC CTC ATT and GAG CTC TGG GTG AGG ATG AGG AC to detect the regions spanning transmembrane 1 and 3; TAC TTC AAC TTC TTC GTC TGG GT and CTT GTG GAT TCG GAA GGC ATA GA to detect the region spanning transmembranes 4 and 5, which are not present in –/– mice; and GCG ATA CCG TAA AGC ACG AG and CCG TGT TCC GGC TGT CAG CG to detect the neomycin cassette.
Adenosine deaminase (ADA)-deficient (Ada–/–) mice were generated and genotyped as described (27). These mice were on a mixed background of 129/Sv, C57Blk6, and FVB/N strains. Control mice were Ada+/+.
Studies were performed at the Yale University School of Medicine, and all protocols and procedures were reviewed and approved by the Yale University Animal Care and Use Committee.
Hypoxia Exposure. Mice were reared under either hypoxic or normoxic conditions from postnatal day (P) 3 to P14. On P3, litters of pups were placed with the dam in a Plexiglas chamber in which ambient O2 levels were continuously monitored and controlled. Oxygen levels were monitored by using a Cameron Instrument (Ontario, Canada) Dual Channel Oxygen Monitor attached to O2 electrodes placed at each end of the chamber. O2 levels were then fed to a laboratory computer to provide a record of levels throughout the experimental period. Mice raised in hypoxia were maintained at 9.5 ± 1.0% O2. Normoxic animals were exposed to O2 in the range of 22–23%. A small fan was used to continuously circulate air, and appropriate filter canisters were used to remove excessive levels of CO2 and humidity within the box. Twice weekly, the box was opened for <5 min and the cages, water, and food were changed.
Because C57-BL6 dams do not normally care for pups in hypoxic conditions, pups were cross-fostered with CD-1 dams. For each study, a pregnant C57-BL6 animal was paired at postconceptual day 15. After the dams had given birth, the CD-1 offspring were removed.
Ventricular Area Measurements. Ventricular area was determined as described (11). Mice were weighed, anesthetized (2% halothane), and decapitated. The brains were frozen on dry ice and stored at –80°C. Sections spanning the brain were cut on a cryostat at a thickness of 20 μm. Sections were mounted onto glass slides and stained with hematoxylin. Serial sections through the midstriatum were photographed to include the lateral ventricle region. The border of each ventricle for each section was then outlined, and the cross-sectional ventricular areas were determined with image pro software (Image Pro, Boston). The mean area (±SEM) was then calculated from serial sections spanning the midstriatum.
White Matter Staining. Tissue sections were fixed with 4% paraformaldehyde in PBS for 20 min at room temperature and incubated with 10% normal goat serum plus 0.3% Triton X-100 in 0.1 M PBS (pH 7.4) for 60 min to block nonspecific binding. The sections were incubated with monoclonal MBP antibody (SMI-99; Sternberger Monoclonals, Baltimore) at a dilution of 1:1,000 in PBS with 5% normal goat serum plus 0.1% Triton X-100 at 4°C overnight, followed by incubation of Alexa Fluor 495 anti-mouse IgG (Molecular Probes) at a dilution of 1:200.
Western Blot Analysis. Protein from whole brains was extracted as described (28). Tissues was lysed in 1% SDS and 1× PBS and sonicated, and the homogenates were boiled for 3–5 min. Supernatants were collected by centrifugation at 12,000 rpm for 5 min at 4°C and stored at 80°C until use. Protein concentration was determined with the BCA protein kit (Pierce) by using BSA as a standard. Aliquots of 15–30 μg of protein (80 μg of protein for IGF-II) were separated on 7.5% or 12.5% polyacrylamide gel and transferred onto a poly(vinylidene difluoride) membrane (Amersham Biosciences). Labeling was detected by using the ECL kit (Amersham Biosciences). Anti-MBP antibody (1:1,500) and anti-GAPDH (1:2,000) were from Chemicon. To ensure the equal loading and accuracy of changes in protein abundance, the protein levels were normalized to GAPDH. The abundance of GAPDH paralleled the amount of total protein loaded. Image analysis was performed with image pro.
Receptor-Labeling Autoradiography. In situ autoradiography was performed as described (24). Sections were labeled with 2 nM 8-phenyl,1,3-dipropylxanthine (DPCPX) for 60 min at room temperature with gentle shaking (29). To determine nonspecific binding, 100 nM unlabeled DPCPX was included in some incubations. Sections were then exposed to Hyperfilm (Amersham Biosciences) for 6 weeks.
Brain Adenosine Determinations. Mice were anesthetized with avertin, and the brain was rapidly removed and frozen in liquid nitrogen to prevent metabolism of adenine nucleotides and nucleosides. Adenine nucleosides were extracted from frozen brain tissue by using 0.4 M perchloric acid as described (30). Adenosine was separated and quantified by using RP-HPLC according to established procedures (27, 30).
Statistical Analysis. Data were expressed as means (±SEM), and comparisons between treatment groups were performed by using ANOVA with a Bonferroni posttest comparison of the means. Some data were analyzed with a Student's unpaired t test.
Results
Mice were reared under either hypoxic or normoxic conditions from P3 to P14. Because C57-BL6 dams do not normally care for pups in hypoxic conditions, pups were cross-fostered with CD-1 dams. Mice and their dams were placed in chambers maintained at 9.5 ± 1.0% oxygen. Control A1AR mice (+/+) were raised in room air. For the first series of experiments, litters of A1AR+/+ mice were studied (three litters, six to eight pups per litter). Animals were placed in 9.5% oxygen from P3 to P14. After P14, animals were killed and brains were analyzed.
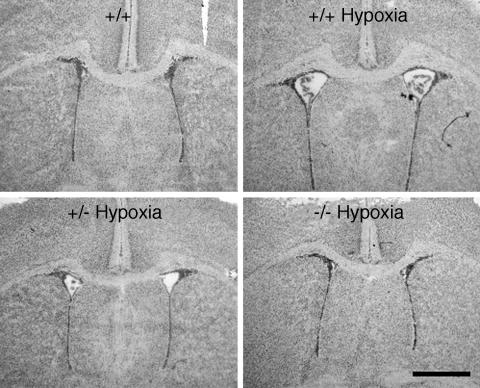
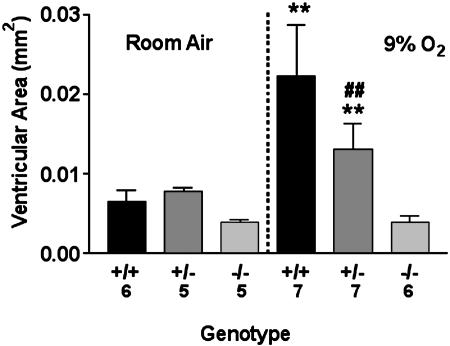
To assess ventricular size, serial coronal sections were taken at the midstriatum level. We have previously shown that cross-sectional ventricular area is consistent with total ventricular volumes (11). In A1AR+/+ animals raised in normoxia, the mean ventricular area was 0.007 ± 0.001 mm2. In contrast, marked ventriculomegaly was observed in the A1AR+/+ animals exposed to 9.5% oxygen, which displayed a mean ventricular area of 0.022 ± 0.01 mm2 (P < 0.01; Figs. 1 and 2). Indicating that hypoxia exposure leads to increased levels of brain adenosine, whole brain adenosine levels were 2.4 ± 0.9 nmol/mg of protein at P14 after the end of exposure to 9.5%, as compared with levels of 0.6 ± 0.3 nmol/mg of protein for P14 mice reared in room air (P < 0.01).
Fig. 1.
Hematoxylin-stained coronal sections from +/+, +/–, or –/– A1AR animals taken from the midstriatum of P14 mice exposed from P3 through P14 to either chronic sublethal hypoxia (9.5% O2) or room air. Ventricular enlargement was observed in +/+ and +/– mice exposed to hypoxia but not in –/– mice exposed to hypoxia and +/+ mice reared in normoxia. (Scale bar: 1 mm.)
Fig. 2.
Ventricular area as related to genotype and oxygen exposure. Numbers representing animals in each group are indicated along the x axis. Means ± SEM are presented. **, P < 0.01 vs. +/+ or +/– in room air and –/– in 9.5% O2. ##, P < 0.01 vs. +/– in 9.5% O2.
After observing that 9.5% oxygen exposure resulted in ventriculomegaly in A1AR+/+ mice, we next evaluated A1AR+/– and A1AR–/– mice. Offspring of A1AR–/– males and A1AR+/– female pairings were studied (three litters, six to eight pups per litter). Animals were maintained either in normoxia or 9.5% oxygen from P3 to P14. After the pups were killed, genotype was determined by PCR.
In A1AR–/– mice exposed to 9.5% oxygen, the mean ventricular area appeared to be similar to A1AR+/+ mice in normoxia (mean area for –/– mice was 0.004 ± 0.02 mm2; Figs. 1 and 2). The A1AR+/– mice showed some ventriculomegaly but less than that seen in the A1AR+/+ mice (mean ventricular area was 0.013 ± 0.02 mm2 for +/– mice; Figs. 1 and 2). Mean ventricular areas were similar for neonates in all treatment groups exposed to normoxic conditions (Figs. 1 and 2).
In situ autoradiography studies confirmed PCR results. In the –/– mice, we did not observe any A1AR expression in the brain. In the +/– mice, A1AR labeling was present but was approximately half that seen in the +/+ mice (26).
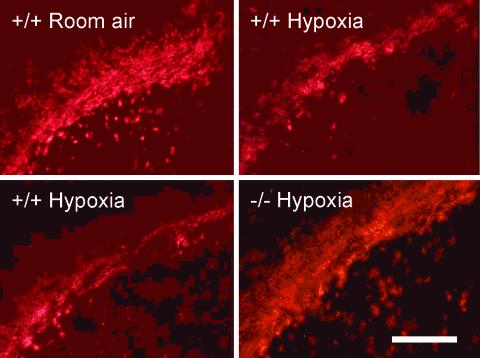
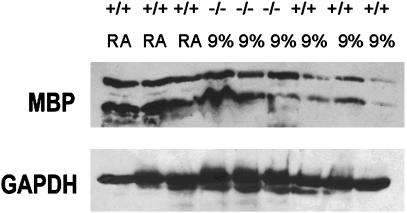
Next, to examine myelination of white matter tracks, patterns of MBP expression were studied immunohistochemically. MBP labeling of the corpus callosum was assessed at the level of the midstriatum. MBP labeling was observed in normoxic controls and in the A1AR +/+, +/–, and –/– animals exposed to hypoxia, suggesting that myelination occurred during hypoxic rearing. However, the area of MBP labeling was reduced in +/+ and +/– animals exposed to hypoxia (Fig. 3). When Western immunoblot analysis was performed on animals from the same litter reared in 9%, we observed reduced MBP expression in the +/+ mice reared in hypoxia (n = 3; 55 ± 7% protein abundance of +/+ room air controls; P < 0.05; Fig. 4). Yet, comparable levels of MBP expression were observed in +/+ mice in room air and –/– mice in hypoxia (n = 3; 85 ± 7% protein abundance of +/+ room air controls; P > 0.05; Fig. 4).
Fig. 3.
MBP immunoreactivity in coronal sections of the corpus callosum from +/+, +/–, or –/– A1AR at midstriatum level of P14 mice exposed from P3 through P14 to either chronic sublethal hypoxia (9% O2) or room air. (Scale bar: 0.2 mm.)
Fig. 4.
Western blot analysis of MBP immunoreactivity in whole brain from +/+ or –/– A1AR littermates exposed from P3 through P14 to either room air (RA) or chronic sublethal hypoxia (9% O2). After detection with anti-MBP antibody, the blot was stripped and reprobed with antibodies to GAPDH.
Next, to examine whether elevated brain adenosine levels play a role in promoting the PVL phenotype we examined the brains of mice deficient in the ADA gene. These mice are unable to degrade adenosine, which then accumulates to high levels in tissues (27).
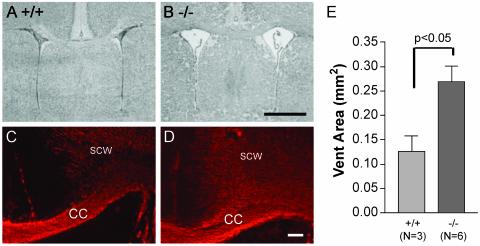
When ventricular area at the midstriatum of Ada+/+ mice was quantitated, we found that the mice had a ventricular area of 0.13 ± 0.03 mm2 (n = 3). However, when we examined Ada–/– mice we found the ventricular area to be markedly enlarged (0.27 ± 0.03 mm2; n = 6; P < 0.05, unpaired t test; Fig. 5). MBP labeling was apparent in both Ada+/+ and Ada–/– mice (Fig. 5), showing that myelination occurred in the Ada–/– mice. When brain adenosine levels were measured, they were markedly elevated in the Ada–/– brains (4.6 ± 0.5 nmol/mg of protein) compared with Ada+/+ (0.6 ± 0.3 nmol/mg of protein).
Fig. 5.
(A and B) Hematoxylin-stained coronal sections from Ada+/+ or Ada–/– animals taken from the midstriatum of P17 neonates and stained with hematoxylin. Ventricular enlargement was seen in Ada–/– but not in Ada+/+ mice. (C and D) Adjacent sections to those shown in A and B were stained with a primary antibody to MBP. CC, corpus callosum; SCW, subcortical white matter. (E) Quantitative assessment of ventricular areas at the same level shown in A and B. (Scale bars: B, 1 mm; D, 0.2 mm.)
Discussion
The causes of PVL in human infants are not currently known. Incomplete vascular supply to the cerebral white matter and impaired regulation of cerebral blood flow are believed to predispose the developing brain to inadequate white matter perfusion during stress, resulting in brain hypoxia (1). In support of this notion, features of PVL are seen in neonatal animals after carotid artery ligation or rearing in hypoxic conditions (8, 9).
Although adenosine is a potential mediator of PVL in hypoxia (11), little attention has focused on this possibility. A breakdown product of ATP, adenosine levels can increase >100-fold with tissue injury or hypoxia (12, 25, 31). This, in turn, will lead to activation of A1ARs (12), which are heavily expressed in white and gray matter (32).
We confirmed that ventriculomegaly occurs in mice exposed to hypoxic conditions (8). However, in A1AR–/– mice, brains of hypoxia-reared mice appear similar to those of A1AR+/+ mice reared in room air. We also observe comparable levels of MBP expression in the brains of A1AR–/– mice that were hypoxia-reared and those of A1AR+/+ mice reared in room air. These data show that A1ARs play a prominent role in hypoxia-induced ventriculomegaly. Interestingly, A1AR+/– mice, which have half the normal number of A1ARs, exhibited less hypoxia-induced ventriculomegaly than A1AR+/+ mice reared in hypoxia, suggesting that partial reduction in A1AR action confers some protection against hypoxia-induced injury.
As an independent test of the hypothesis that the adenosinergic system plays a role in hypoxia-induced brain damage, we measured ventricular areas in mice that were deficient in ADA. ADA-deficient mice exhibit elevations in adenosine concentrations in many tissues (27), including the brain, as demonstrated here. In the ADA-deficient mice, we found markedly increased ventricular area.
Because a reduction in A1AR expression appears to prevent hypoxia-induced ventriculomegaly and loss of white matter, our observations raise the possibility that pharmacological blockade of A1AR may have clinical utility. Indeed, adenosine antagonists are widely used in neonatal medicine (33). Theophylline and caffeine are nonselective adenosine antagonists that are used to stimulate respiration in premature infants (33). However, we are unaware of clinical studies that have examined the incidence of PVL as related to neonatal caffeine use. Some studies have suggested that caffeine may reduce cerebral blood flow in premature infants (34), possibly by blocking vascular A2ARs. Thus, it may prove more advantageous to use selective A1AR antagonists to help reduce adenosine-induced brain injury.
Acknowledgments
This work was supported by National Institutes of Health Grants R01 NS33539 (to S.A.R.), NS35476 (to L.M.), and R01 AI43572 (to M.B.), the European Commission (B.B.F.), and Swedish Medical Research Council Grants 2553 and 12587 (to B.B.F. and B.J.). S.A.R. is a Donaghue Foundation Awardee.
This paper was submitted directly (Track II) to the PNAS office.
Abbreviations: PVL, periventricular leukomalacia; AR, adenosine receptor; ADA, adenosine deaminase; Pn, postnatal day n; MBP, myelin basic protein.
References
- 1.Volpe, J. J. (2001) Pediatr. Res. 50, 553–562. [DOI] [PubMed] [Google Scholar]
- 2.Kuban, K., Sanocka, U., Leviton, A., Allred, E. N., Pagano, M., Dammann, O., Share, J., Rosenfeld, D., Abiri, M., DiSalvo, D., et al. (1999) J. Pediatr. 134, 539–546. [DOI] [PubMed] [Google Scholar]
- 3.Johnston, M. V., Trescher, W. H., Ishida, A. & Nakajima, W. (2001) Pediatr. Res. 49, 735–741. [DOI] [PubMed] [Google Scholar]
- 4.Melhem, E. R., Hoon, A. H., Jr., Ferrucci, J. T., Jr., Quinn, C. B., Reinhardt, E. M., Demetrides, S. W., Freeman, B. M. & Johnston, M. V. (2000) Radiology 214, 199–204. [DOI] [PubMed] [Google Scholar]
- 5.Greisen, G. & Vannucci, R. C. (2001) Biol. Neonate 79, 194–200. [DOI] [PubMed] [Google Scholar]
- 6.Perlman, J. M. (1998) Early Hum. Dev. 53, 99–120. [DOI] [PubMed] [Google Scholar]
- 7.Fazzi, E., Orcesi, S., Caffi, L., Ometto, A., Rondini, G., Telesca, C. & Lanzi, G. (1994) Neuropediatrics 25, 134–139. [DOI] [PubMed] [Google Scholar]
- 8.Ment, L. R., Schwartz, M., Makuch, R. W. & Stewart, W. B. (1998) Brain Res. Dev. Brain Res. 111, 197–203. [DOI] [PubMed] [Google Scholar]
- 9.Uehara, H., Yoshioka, H., Kawase, S., Nagai, H., Ohmae, T., Hasegawa, K. & Sawada, T. (1999) Brain Res. 837, 213–220. [DOI] [PubMed] [Google Scholar]
- 10.Vannicci, R. C., Connor, J. R., Mauger, D. T., Palmer, C., Smith, M. B., Towfighi, J. & Vannucci, S. J. (1999) J. Neurosci. Res. 55, 158–163. [DOI] [PubMed] [Google Scholar]
- 11.Turner, C. P., Yan, H., Schwartz, M., Othman, T. & Rivkees, S. A. (2002) NeuroReport 13, 1199–1204. [DOI] [PubMed] [Google Scholar]
- 12.Ijzerman, A. & van Rhee, A. M. (1997) in Purinergic Approaches in Experimental Therapeutics, eds. Jacobson, K. A. & Jarvis, M. F. (Wiley–Liss, New York), pp. 129–148.
- 13.Hagberg, H., Andersson, P., Lacarewicz, J., Jacobson, I., Butcher, S. & Sandberg, M. (1987) J. Neurochem. 49, 227–231. [DOI] [PubMed] [Google Scholar]
- 14.Kobayashi, T., Yamada, T. & Okada, Y. (1998) Brain Res. 787, 211–219. [DOI] [PubMed] [Google Scholar]
- 15.Haas, H. L. & Selbach, O. (2000) Naunyn Schmiedebergs Arch. Pharmacol. 362, 375–381. [DOI] [PubMed] [Google Scholar]
- 16.Klotz, K. N. (2000) Naunyn Schmiedebergs Arch. Pharmacol. 362, 382–391. [DOI] [PubMed] [Google Scholar]
- 17.Fredholm, B. B., Ap, I. J., Jacobson, K. A., Klotz, K. N. & Linden, J. (2001) Pharmacol. Rev. 53, 527–552. [PMC free article] [PubMed] [Google Scholar]
- 18.Kull, B., Svenningsson, P. & Fredholm, B. B. (2000) Mol. Pharmacol. 58, 771–777. [DOI] [PubMed] [Google Scholar]
- 19.Fredholm, B. B., Battig, K., Holmen, J., Nehlig, A. & Zvartau, E. E. (1999) Pharmacol. Rev. 51, 83–133. [PubMed] [Google Scholar]
- 20.Reppert, S. M., Weaver, D. R., Stehle, J. H. & Rivkees, S. A. (1991) Mol. Endocrinol. 5, 1037–1048. [DOI] [PubMed] [Google Scholar]
- 21.Rivkees, S. A., Zhao, Z., Porter, G. & Turner, C. (2001) Mol. Genet. Metab. 74, 160–171. [DOI] [PubMed] [Google Scholar]
- 22.Stehle, J. H., Rivkees, S. A., Lee, J. J., Weaver, D. R., Deeds, J. D. & Reppert, S. M. (1992) Mol. Endocrinol. 6, 384–393. [DOI] [PubMed] [Google Scholar]
- 23.Rivkees, S. A., Thevananther, S. & Hao, H. (2000) NeuroReport 11, 1025–1030. [DOI] [PubMed] [Google Scholar]
- 24.Rivkees, S. A. (1995) Brain Res. Dev. Brain Res. 89, 202–213. [DOI] [PubMed] [Google Scholar]
- 25.Latini, S. & Pedata, F. (2001) J. Neurochem. 79, 463–484. [DOI] [PubMed] [Google Scholar]
- 26.Johansson, B., Halldner, L., Dunwiddie, T. V., Masino, S. A., Poelchen, W., Gimenez-Llort, L., Escorihuela, R. M., Fernandez-Teruel, A., Wiesenfeld-Hallin, Z., Xu, X. J., et al. (2001) Proc. Natl. Acad. Sci. USA 98, 9407–9412. [DOI] [PMC free article] [PubMed] [Google Scholar]
- 27.Blackburn, M. R., Datta, S. K. & Kellems, R. E. (1998) J. Biol. Chem. 273, 5093–5100. [DOI] [PubMed] [Google Scholar]
- 28.Ye, P., Li, L., Richards, R. G., DiAugustine, R. P. & D'Ercole, A. J. (2002) J. Neurosci. 22, 6041–6051. [DOI] [PMC free article] [PubMed] [Google Scholar]
- 29.Aden, U., Herlenius, E., Tang, L. Q. & Fredholm, B. B. (2000) Pediatr. Res. 48, 177–183. [DOI] [PubMed] [Google Scholar]
- 30.Knudsen, T. B., Winters, R. S., Otey, S. K., Blackburn, M. R., Airhart, M. J., Church, J. K. & Skalko, R. G. (1992) Teratology 45, 91–103. [DOI] [PubMed] [Google Scholar]
- 31.Latini, S., Bordoni, F., Pedata, F. & Corradetti, R. (1999) Br. J. Pharmacol. 127, 729–739. [DOI] [PMC free article] [PubMed] [Google Scholar]
- 32.Swanson, T. H., Drazba, J. A. & Rivkees, S. A. (1995) J. Comp. Neurol. 363, 517–531. [DOI] [PubMed] [Google Scholar]
- 33.Bhatt-Mehta, V. & Schumacher, R. E. (2003) Paediatr. Drugs 5, 195–210. [DOI] [PubMed] [Google Scholar]
- 34.Hoecker, C., Nelle, M., Poeschl, J., Beedgen, B. & Linderkamp, O. (2002) Pediatrics 109, 784–786. [DOI] [PubMed] [Google Scholar]


