

Abstract
The objective of this study has been to determine which Na,K-ATPase isoforms are expressed in red blood cells and whether kinetic differences in the uncoupled sodium efflux mode between the human red blood cell Na,K-ATPase and other preparations can be explained by differences in the underlying subunit composition. To this end, human reticulocyte RNA was isolated, reverse transcribed, amplified by PCR and appropriate primers, and sequenced. Primers from highly conserved areas as well as isoform-specific primers were used. The α1 and α3 isoforms of the α subunit, and the β2 and β3 isoforms of the β subunit were found. The complete coding regions of the cDNAs for the reticulocyte subunits were sequenced from overlapping PCR fragments. No difference was found between the reticulocyte isoforms and the ones already known. The fact that we found β2 but not β1 in reticulocyte single-stranded cDNA, and β1 but not β2 in a leukocyte library indicates that leukocyte contamination of our reticulocyte preparation was negligible. Analysis of a human bone marrow library showed that α1, α2, and α3 as well as all three β isoforms were present. The extent to which the kinetic properties of uncoupled sodium efflux might depend on different isoform combinations is not yet known.
The Na,K-ATPase (or sodium pump) is ubiquitously expressed in the plasma membrane of vertebrates. The Na,K-ATPase functions to maintain sodium and potassium gradients across membranes that subserve cellular activities such as volume regulation, action potentials, and secondary active transport. Although red blood cells have been used with considerable advantage in defining the transport activities of the Na,K-ATPase, most of the enzyme’s biochemical properties have been determined in tissues in which it is expressed in large abundance, such as the red outer medulla of the kidney. In contrast, no purified red cell Na,K-ATPase preparation is available, presumably because of its low abundance, and little is known about its subunit composition. The determination of the molecular structure of the red blood cell Na,K-ATPase is even more important in light of the various kinetic differences, especially in the so-called uncoupled sodium efflux mode (1, 2), between red blood cells and kidney vesicle preparations. The most important differences are the coupling of anion to sodium transport in red blood cells (3) and the lack of inhibition by external sodium (1) in kidney vesicles.
Na,K-ATPase is known to be composed of α, β, and probably γ subunits (4). Four isoforms for the α subunits and three for the β subunits have been found so far. The α1 isoform is expressed ubiquitously; α2 is expressed primarily in skeletal muscle as well as in brain and heart; α3 is expressed in brain and heart; and α4 is expressed in testis and skeletal muscle (5). β1 occurs in most tissues, whereas β2 occurs mostly in neural tissue. β3 was recently found in human placenta and various rat tissues (6). Although α is the catalytically important subunit (7, 8), kinetic studies of combinations of α1, α2, and α3 with β1 and β2 (9–12) indicated that the kinetic parameters of the Na,K-ATPase can be influenced by different combinations of isoforms of the α and β subunits. However, uncoupled sodium efflux was not investigated in any of these studies.
By using Western blots, it was suggested (13) that human red blood cells express the α1 and β1 isoforms. However, the isoforms’ signals were very weak, and it is possible that the isoforms’ antibody had bound to other isoforms of the Na,K-ATPase. A principal shortcoming of all immunological studies is that the antibody may not discriminate between alternatively spliced forms, RNA editing, posttranslational modifications, or even the presence of a new isoform. Therefore, we considered it necessary to determine the complete primary structure of the red cell Na,K-ATPase. Our strategy was to use the most sensitive method, PCR, with isoform-specific primers to detect which isoform(s) are expressed, and with primers from conserved areas that may be able to bind to a new isoform.
MATERIALS AND METHODS
RNA Extraction and Single-Stranded cDNA Synthesis.
Either 100 or 500 ml of heparinized (5 mg/100 ml) fresh blood from healthy human donors was filtered with a high performance filter (RCZL or RCXL1, Pall) to remove leukocytes. Packed red blood cells were washed six times at 4°C by suspension in approximately three volumes of a solution containing 150 mM NaCl and 10 mM Tris⋅HCl (pH 7.4) and centrifugation (12,000 × g for 1 min). RNA was extracted according to ref. 14. Briefly, red cells were lysed, ribonucleoproteins were precipitated, and total RNA was extracted. Centrifugation tubes, glassware, and solutions were treated with diethyl pyrocarbonate. mRNA was isolated with an Oligotex kit (Qiagen, Chatsworth, CA). A typical yield was 250 μg of total RNA per 500 ml of blood. Messenger RNA was reverse transcribed with Superscript II (Life Technologies, Gaithersburg, MD) with use of either oligo(dT) or random hexanucleotide primers, or a mixture of both. In some preparations, the RNA–DNA hybrid was treated with RNase H (Life Technologies), and primers were removed (QIAquick, Qiagen). This paper reports the results of seven successful preparations from six different donors.
A human bone marrow library was purchased from CLONTECH, and the human leukocyte library was a generous gift from Nancy Berliner (Yale University; ref. 15). DNA from the bone marrow library was extracted according to ref. 16. The leukocyte library was diluted in 5–10 volumes of water and heated to 95°C for 5 min immediately before it was used as a template for the PCR.
PCR.
Approximately 10–100 ng of reticulocyte single-stranded cDNA or 100–300 ng of vector DNA, 1–3 units of TaKaRa Ex Taq DNA polymerase (Panvera, Madison, WI), 1× buffer (supplied by the distributor), 200 μM dNTP mix, and 2.5 μM primer were used in a volume of 25 or 50 μl per PCR. Primers were synthesized by the Oligonucleotide Synthesis Laboratory (Department of Pathology, Yale University). Two types of PCR protocols were carried out. For protocol I, denaturation was for 20 s at 98°C, annealing for 1 min at 55–64°C, and extension for 1 min at 72°C. For protocol II, denaturation was for 20 s at 98°C, and annealing and extension were combined for 90 s at 65–70°C. Usually 40 amplification cycles were run. In each PCR, a negative control in which the template was omitted was run. PCR products were analyzed on agarose gels stained with ethidium bromide, the appropriate bands were excised, and DNA was extracted (QIAquick, Qiagen). If necessary, weak bands were reamplified by another 25 PCR cycles.
DNA Analysis.
PCR products of the appropriate size were typically analyzed by restriction digestion. Sequencing was done either directly on PCR products or after the products were subcloned into the vector pGEM (Promega). Sequencing was performed with the chain termination reaction method (Sequenase II, Amersham) or with use of the A3I 373 automated DNA sequencer at the Keck Biotechnology Resources Laboratory (Yale University).
RESULTS
The primary purpose of this study was to identify which isoforms of the Na,K-ATPase are expressed in reticulocytes. We first designed primers specific for the various isoforms of the α and β subunits; these primers are given in Table 1. These were then used in PCRs with reticulocyte single-stranded cDNA as template. The results for the α subunit, summarized in Fig. 1 (Left), indicate that we found α1 and α3 but not α2 or α4. Thus, as shown (Table 1) for the specific primer pairs used, a product of 530 bp was expected for α1, and as shown in Fig. 1 (lane 1), a product of approximately the correct size was found. For α3, a product of 540 bp was expected, and again a product of approximately the expected size was found. For α2 and α4, products of 612 and 494 bp, respectively, were expected, but no products of this size range were found (Fig. 1, lanes 2 and 4, respectively). The identity of the positive PCR products was confirmed by sequencing. Each positive result was repeated at least once with a preparation from a different blood donor. Each of the negative reactions was repeated at various annealing temperatures from 55°C to 65°C and with templates from at least three different preparations (all of which gave positive results for the α1 subunit). In addition to the examples shown, the α2-specific primers A2-3 and A2-4 were used (see Table 1). But even when, by lowering the annealing temperature, some PCR products were obtained, these were confined to unrelated species. Whereas the α1 isoform was found relatively easily, we had to optimize primers and PCR conditions to detect the other isoforms. In particular, α3 seems to be present in very low abundance, as will be discussed later.
Table 1.
PCR primers
| Primer specifity | Primer symbol | Position of bp in cDNA | Sequence |
|---|---|---|---|
| α subunit primers common to all isoforms | CA-1 | 2,086–2,108 | CAGCAGAAGCTCATCATTGTGGA |
| CA-2 | 2,853–2,831 | GTTCTTCATGCCCTGCTGGAAGA | |
| CA-3 | 1,171–1,193 | ATGTGGTTCGACAACCAAATCCA | |
| CA-4 | 1,817–1,795 | CATTTGCCCACAGCATCTGGAAC | |
| α1 subunit isoform-specific primers | A1-1 | 1–26 | ATGGGGAAGGGGGTTGGACGTGATAA |
| A1-2 | 530–503 | TTCTCACCATTTCGAATCACAAGGGCTT | |
| A1-3 | 283–315 | CAGCTCTTTGGGGGGTTCTCAATGTTACTGTGG | |
| A1-4 | 980–948 | ATACCGATGAGGAAGATGACAGCCACAAGCCAG | |
| A1-5 | 628–650 | GGCTGCAAGGTGGATAACTCATC | |
| A1-6 | 1,467–1,444 | CTGGTACTTGTTGGTGGAGTTGAA | |
| A1-7 | 1,751–1,784 | GCTTTGTTGGGCTCATCTCCATGATTGACCCTCC | |
| A1-8 | 2,726–2,693 | TCATAGGTCCACTGCTGCCCGTAGCTGTCTTCCA | |
| A1-9 | 2,548–2,581 | ATCAGCATGGCCTATGGGCAGATTGGAATGATCC | |
| A1-10 | 3,072–3,046 | CTAATAGTAGGTTTCCTTCTCCACCCA | |
| α2 subunit isoform-specific primers | A2-1 | 58–81 | GGCGGCAAGAAGAAACAGAAGGAG |
| A2-2 | 668–645 | TGGGGCTCCGACTCTCCTGTTAAG | |
| A2-3 | 828–852 | GGTTCGGCGGACACCCATAGCAATG | |
| A2-4 | 1,502–1,478 | ACGTGGCTCTGGGGGCTGTCTTCTC | |
| α3 subunit isoform-specific primers | A3-1 | 1–33 | ATGGAGATACACGACAAGAAAGATGACAAGGAC |
| A3-2 | 540–508 | CCCGACCACCACCTCCTCAGCGTTCACCTGCAT | |
| A3-3 | 6–31 | GATACACGACAAGAAAGATGACAAGG | |
| A3-4 | 650–627 | TGGGGCTCGGATTCTCCAGTCAGG | |
| A3-7 | 828–856 | CGCCATCGAGATTGAGCACTTCATCCAGC | |
| A3-8 | 1,224–1,195 | GTGCGAACTCTTGTCAAATGAGGTCCCTGA | |
| A3-11 | 1,459–1,488 | ACCGAGGACCCCAACGACAACCGATACCTG | |
| A3-12 | 2,034–2007 | GGTGTGATTCTCCAGGATCTCGTCGATT | |
| A3-13 | 1,659–1,689 | CGAGGAGCAGTATCCCCAAGGCTTTGCCTTC | |
| A3-14 | 2,067–2,040 | CTGCTGGGGGGATGTGCGGGCGAAGACG | |
| A3-15 | 2,061–2,084 | CAGCAGAAGCTCATCATTGTGGA | |
| A3-16 | 3,048–3,015 | TCAGTAGTAAGTTTCCTTCTCCACCCAACCCCCT | |
| α4 subunit isoform-specific primers | A4-1 | 137–158 | TAACCTTGGAAGAGCTGAGCA |
| A4-2 | 630–611 | TCCTTGTGCAGAGATAAGCC | |
| β1 subunit isoform-specific primers | B1-1 | 1–33 | ATGGCCCGCGGGAAAGCCAAGGAGGAGGGCAGC |
| B1-2 | 441–409 | CTTTCGCTCTCCTCGTTCATGATTAAAGTCTCC | |
| B1-3 | 105–132 | CCTTCTATTCTACGTAATATTTTATGGC | |
| B1-4 | 756–730 | GGGCTGCAGGAGTTTGCCATAGTACGG | |
| B1-5 | 912–882 | TCAGCTCTTAACTTCAATTTTTACATCAAAA | |
| C-B1 | 198–218 | CACATATCAGGACCGAGTGGC | |
| C-B2 | 659–639 | TCTTCATCTCGCTTGCCAGTG | |
| β2 subunit isoform-specific primers | B2-1 | 419–448 | ATGGAGTCCTCAACTACCCCAAACTGGCCT |
| B2-2 | 873–841 | TCAGGTTTTGTTGATGCGGAGTTTGAAGGCCAC | |
| β3 subunit isoform-specific primers | B3-1 | 16–42 | AAGAAGTCCCTCAACCAGAGCCTGGC |
| B3-2 | 429–405 | TGCAACATAAACTGGACCCTTCTGT | |
| γ subunit isoform-specific primers | γF | 1–33 | ATGGACGGTGGCGGCAGCCCCAAGGGGGACGTG |
| γE | 186–154 | TTACGGCTCATCTTCATTGATTTGCCTGCGCTT |
The sequences of isoforms of the Na,K-ATPase α subunit were aligned, and areas of very high or very low homology were selected. Primers were designed to anneal either to highly conserved areas (subunit primers common to all isoforms) or to areas that show minimal homology (isoform-specific primers). The second column of this table shows the name of the primer, the numbering in the third column refers to the coding region of the cDNA of the respective subunit, and the fourth column shows the oligonucleotide sequence (in the 5′ to 3′ orientation). In cases of the α common primers and the primers for α4, for which only part of the human sequence is known (5), the numbering refers to the α1 subunit. Some of the primers were constructed with one base mismatch to the respective sequence to avoid the formation of an internal hairpin loop.
Figure 1.
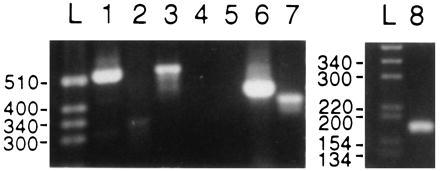
PCR products with isoform-specific primers and reticulocyte single-stranded cDNA as template. Photograph of PCR products that were separated in a 2% agarose gel. The following conditions were used: 40 cycles; denaturation for 20 s at 98°C; annealing and extension for 90 s at 65°C or annealing at 60°C for 1 min and extension at 72°C for 1 min; ≈30 ng of reticulocyte single-stranded cDNA as template. The specific primer pairs used below are defined in Table 1. Lanes L show a 1-kb mass ladder (Life Technologies). (Left) Lanes: 1, α1-specific primer pair A1-1 and A1-2, expected product of 530 bp; 2, α2-specific primer pair A2-1 and A2-2, expected product of 612 bp; 3, α3-specific primer pair A3-1 and A3-2, expected product of 540 bp; 4: α4-specific primer pair A4-1 and A4-2, expected product of 494 bp; 5, β1-specific primer pair B1-1 and B1-2, expected product of 441 bp; 6, β2-specific primer pair B2-1 and B2-2, expected product of 455 bp; 7, β3-specific primer pair B3-1 and B3-2, expected product of 414 bp. (Right) Lanes L and 8 are from a 3% gel. Lanes: L, 1-kb mass ladder; 8, γ-specific primer pair γ1 and γ2, expected size 186 bp. See text for discussion.
We also used another approach to the question of which isoforms are expressed in reticulocytes; PCR was performed with pairs of primers, as defined in Table 2, that bind to highly conserved areas of all the known α subunits. In this instance, the PCR product was subcloned to amplify all α subunit sequences, and individual clones were tested by restriction analysis or sequencing. This strategy was used both to look for any new isoform and to estimate the abundance of the isoforms present. The primer pair CA-1 and CA-2 (see Table 2) has a one base difference to α1 and no difference to α2 or α3. Approximately 30 clones from four PCRs were analyzed, and only α1 was found. This result indicates that there is much more message present for α1 than for α3. The primer pair CA-3 and CA-4 (Table 2) has a four-base difference to α1, a two-base difference to α2, and a seven-base difference to α3. Again, approximately 50 clones from PCRs with various annealing temperatures were screened, and only α1 or sequences with no homology to the Na,K-ATPase were found. The primer pair CA-3 and CA-5 has a two-base difference to α3 and a six-base difference to α1. Nevertheless, the PCR product was either α1 or unrelated sequences. On the basis of these experiments, we estimate that more than 90% of the message for the α subunit in reticulocytes is for the α1 isoform, and the rest are for α3. In addition, it should be emphasized that no new isoforms of the α subunit were found with use of the foregoing techniques.
Table 2.
Sequences of primers common to all isoforms
| Primer | Sequence |
|---|---|
| CA-1 | CAG CAG AAG CTC ATC ATT GTG GA |
| α1 | CAG CAG AAG CTC ATC ATT GTG GA |
| α2 | CAG CAG AAG CTC ATC ATT GTG GA |
| α3 | CAG CAG AAG CTC ATC ATT GTG GA |
| CA-2 | GTT CTT CAT GCC CTG CTG GAA GA |
| α1 | GTT CTT CAT CCC CTG CTG GAA GA |
| α2 | GTT CTT CAT GCC CTG CTG GAA GA |
| α3 | GTT CTT CAT GCC CTG CTG GAA GA |
| CA-3 | ATG TGG TTC GAC AAC CAA ATC CA |
| α1 | ATG TGG TTT GAC AAT CAA ATC CA |
| α2 | ATG TGG TTC GAC AAC CAA ATC CA |
| α3 | ATG TGG TTT GAC AAC CAG ATC CA |
| CA-4 | CAT TTG CCC ACA GCA TCT GGA AC |
| α1 | CAT TTG CCC ACG GCA TCA GGA AC |
| α2 | CAC TTG CCC ACA GCA TCT GGC AC |
| α3 | CAC TTG CCC ACC GCG TCA GGG AC |
| CA-5 | CAC TTG CCC ACC GCG TCA GGG AC |
| α1 | CAT TTG CCC ACG GCA TCA GGA AC |
| α2 | CAC TTG CCC ACA GCA TCT GGC AC |
| α3 | CAC TTG CCC ACC GCG TCA GGG AC |
| C-B1 | CAC ATA TCA GGA CCG AGT GGC |
| β1 | CAC ATA TCA GGA CCG AGT GGC |
| β2 | CAA GTA CCA GGA CCG ACT GGC |
| C-B2 | TCT TCA TCT CGC TTG CCA GTG |
| β1 | TCT TCA TCT CGC TTG CCA GTG |
| β2 | TCT TCA TCT CGC TTC CCA GCA |
The first row of each group shows the sequences of primers used in the PCR as specified in the text. The specific sequence of isoforms α1, α2, α3, β1, and β2 are shown below each primer used, e.g., CA-1, CA-2, CA-3, and C-B1 and C-B2. Note that sequences that differ are italicized. See text for discussion.
With respect to which β isoforms are present, and whether or not the γ subunit is present, in reticulocytes, we carried out studies completely analogous to those just described for the α isoforms. Thus, as shown in Fig. 1, we found the isoforms β2 and β3 but not β1. This is evident in Fig. 1, which shows that, for the specific primer pairs used, as defined in the legend, although a product of 441 bp was expected for β1, no product in this size range was found. In contrast, PCR products of 455 and 414 bp were expected for β2 and β3, respectively, and products of this size range were found (Fig. 1, lanes 6 and 7, respectively). In addition, we found the γ subunit that is presumed to be a subunit of the Na,K-ATPase (17). This is seen in Fig. 1, lane 8, where a product of approximately 186 bp, the expected size, was found. The identity of all positive products was confirmed by sequencing. In addition, each positive result was repeated at least once with a preparation made from a different blood donor. As before, each of the negative results was repeated at various annealing temperatures (55–65°C) with templates from three separate blood preparations. Also, the products of other combinations of specific primer pairs for β were studied, namely B1-3, B1-4, and B1-5, as defined in Table 1. Decreasing the annealing temperature eventually led, as anticipated, to some PCR products. We confirmed by sequencing that this was due to unspecific binding of the primers to unrelated sequences. In a single experiment, we found a product and initially classified it as β1, but further sequencing identified it as the pseudogene βpsi (18). We could never repeat this result, and we ascribe it to contamination by genomic DNA in this single experiment.
As an additional test for our finding that β2, but not β1, is present, a pair of primers, C-B1 and C-B2 (see Table 2), was constructed; this primer pair was 100% identical to the β1 subunit but had six mismatches compared with the β2 subunit. The PCR product obtained with this primer pair was, however, identified by sequencing as the β2 isoform.
Because we found no new subunit isoforms, we considered other possibilities in the effort to explain the functional differences in the transport characteristics of the Na,K-ATPase between red cells and other tissues. To explore whether alternative splicing or RNA editing was involved, we sequenced the whole coding region of the reticulocyte α1 subunit. We found no difference between the DNA sequence of reticulocyte Na,K-ATPase and the published sequence for the human α1 isoform (19). Although we were unable to obtain the α1 subunit in one piece, we did obtain overlapping PCR products that covered the entire coding region (Fig. 2). We found no alternatively spliced forms. We also sequenced the entire coding region of β2, β3, and γ, as well as approximately 95% of α3 (see Note Added in Proof). We found no differences between the published sequences of these isoforms and those of the reticulocyte cDNA.
Figure 2.
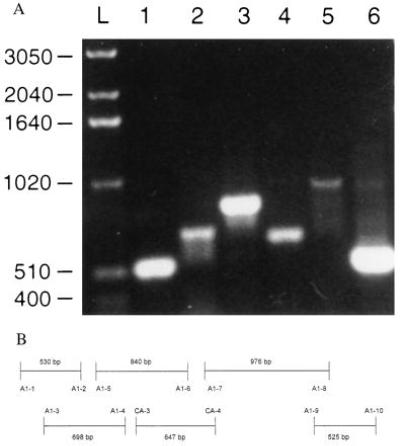
Agarose gel with PCR products that cover the entire coding region of the Na,K-ATPase α1 isoform. PCR reaction products were loaded onto a 1.2% Agarose gel. The primer pairs noted below are defined in Table 1. (A) Lanes: L, a 1-kb mass ladder (Life Technologies); 1, primer pair A1-1 and A1-2; 2, primer pair A1-3 and A1-4; 3, primer pair A1-5 and A1-6; 4, primer pair CA-3 and CA-4; 5, primer pair A1-7 and A1-8; 6, primer pair A1-9 and A1-10. (B) A scheme of the overlapping PCR products representing the entire coding region of the α1 isoform. Each primer pair is identified together with its respecting coding region of the α1 subunit.
To evaluate whether leukocyte contamination might be a problem in the conclusions drawn from analyses of our reticulocyte preparation, we used a leukocyte library as template for PCR with isoform-specific primers. Fig. 3A shows that leukocytes express α1, α3, β1, β3, and γ but not α2, α4, or β2. Thus, for the specific primer pairs used (as defined in Table 1), the results show that for α1, α3, β1, β3, and γ, when products of sizes 530, 540, 441, 414, and 186 bp, respectively, were expected, products of approximately the correct sizes were found (Fig. 3, lanes 1, 3, 5, 7, and 8, respectively). In contrast, where products for α2, α4, and β2 were expected to be of sizes 612, 494, and 455 bp, respectively, no such sizes were seen (Fig. 3, lanes 2, 4, and 6, respectively). The fact that leukocytes express the β1 isoform, but not the β2, with just the opposite expression pattern observed for reticulocytes minimizes the role leukocyte contamination might have played in our analysis of reticulocyte cDNA. This conclusion also applies to our analysis of DNA extracted from a bone marrow library; in this analysis, we found that α1, α2, α3, β1, β2, β3, and γ were all expressed (Fig. 3B). In this instance, as is evident from Fig. 3B, all of the products of the expected size (as specified in the legend) were found for these isoforms. The only exception was α4 (Fig. 3, lane 4), for which no product of the expected size was detected. Table 3 summarizes the tissue-specific isoform expression in each of the three types of libraries studied.
Figure 3.
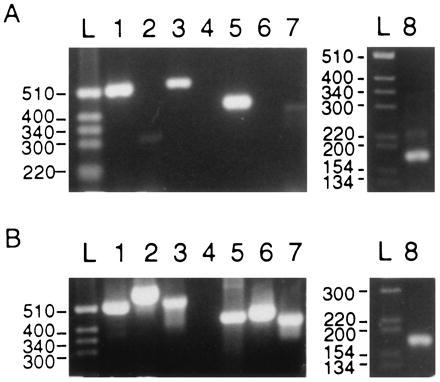
PCR products with isoform-specific primers and leukocyte (A) or bone marrow (B) cDNA as template. (A Left) Lanes: L, a 1-kb mass ladder (Life Technologies); 1, α1-specific primer pair A1-1 and A1-2, expected product of 530 bp; 2, α2-specific primer pair A2-1 and A2-2, expected product of 612 bp; 3, α3-specific primer pair A3-1 and A3-2, expected product of 540 bp; 4, α4-specific primer pair A4-1 and A4-2, expected product of 494 bp; 5, β1-specific primer pair B1-1 and B1-2, expected product of 441 bp; 6, β2-specific primer pair B2-1 and B2-2, expected product of 455 bp; 7, β3-specific primer pair B3-1 and B3-2, expected product of 414 bp. (Right) Lanes L and 8 are from a 3% gel. Lanes: L, 1-kb mass ladder; 8, γ-specific primer pair γ1 and γ2, expected size 186 bp. (B Left) Lanes: L, a BRL 1-kb mass ladder; 1, α1-specific primer pair A1-1 and A1-2, expected product of 530 bp; 2, α2-specific primer pair A2-1 and A2-2, expected product of 612 bp; 3, α3-specific primer pair A3-1 and A3-2, expected product of 540 bp; 4, α4-specific primer pair A4-1 and A4-2, expected product of 494 bp; 5, β1-specific primer pair B1-1 and B1-2, expected product of 441 bp; 6, β2-specific primer pair B2-1 and B2-2, expected product of 455 bp; 7, β3-specific primer pair B3-1 and B3-2, expected product of 414 bp. (Right) Lanes L and 8 are from a 3% gel. Lanes: L, a 1-kb mass ladder; 8, γ-specific primer pair γ1 and γ2, expected size 186 bp.
Table 3.
Na,K-ATPase isoforms detected in cDNA from reticulocytes, leukocytes, and bone marrow
| Cells | α1 | α2 | α3 | α4 | β1 | β2 | ψ3 |
|---|---|---|---|---|---|---|---|
| Reticulocytes | + | − | + | − | − | + | + |
| Leukocytes | + | − | + | − | + | − | + |
| Bone marrow | + | + | + | − | + | + | + |
This table summarizes the subunit isoforms of Na,K-ATPase that were found in the analyzed cDNAs. A ‘+’ means that the isoform was found, a ‘−’ that it was not found.
DISCUSSION
The objective of this study was to determine which isoforms of the Na,K-ATPase are expressed in red blood cells. This is an important question because (i) the available information about the subunit composition of the Na,K-ATPase from this tissue is very limited, despite the frequent use of red blood cells for kinetic studies, and (ii) kinetic differences between red blood cells and vesicles containing kidney Na,K-ATPase imply that the molecular structure of the red cell enzyme might be different (1).
We did, indeed, find differences between the isoforms expressed in red blood cells compared with most other tissues; the most important difference was that we found β2 and β3 but no β1 isoforms for the β subunit in the reticulocyte cDNA. It is generally assumed that α1 and β1 are the most common isoforms, and the kidney is considered to be a model tissue for α1 and β1. Northern blot analysis of sheep bone marrow also showed that only α1 and β1 isoforms could be detected (20). On the other hand, there are indications for the presence in kidney of small amounts of α2 and α3 (8), β2 and α3 (21, 22), and β3 (6). Examples of tissues that express β2, but not β1, are spleen, thymus, and some neuronal cell lines (21). So far, the mammalian β3 isoform has recently been detected in human placenta and several rat tissues, including kidney (6), aside from the present study, where it was found in human reticulocytes, bone marrow, and leukocytes.
Although we found differences in the isoform composition of the Na,K-ATPase from red blood cells compared with other tissues, it is not clear to what extent these differences may play a role in the apparent kinetic differences in uncoupled sodium efflux, as reviewed in ref. 1. If the abundance of reticulocyte mRNA is a measure of the abundance of protein in the mature red cell (most of the copies of Na,K-ATPase contain the α1 isoform of the α subunit, and few contain the α3 isoform), then the complexation of α1 with either β2 or β3 should govern most of the kinetics, implying that complexes containing α3 should have a minor influence. Most studies link the catalytic activity overwhelmingly to the α subunit, and studies of different combinations of α and β subunits (9–12) have not yet shown any dramatic differences in their kinetic characteristics. However, in none of the aforementioned studies was uncoupled sodium efflux investigated. Obviously, the properties of uncoupled sodium efflux need to be compared in cell systems that express combinations of α1 and α3 with β1, β2, and β3. It may also be that other possibilities such as posttranslational modifications, influence of the membrane environment, or effects of the purification and reconstitution procedure will also have to be considered. It should also be mentioned that because we do not analyze protein in the mature red cell, but only mRNA at the reticulocyte stage, we cannot exclude the presence of an isoform whose mRNA was present at the reticulocyte stage but was degraded during erythrocyte maturation and is, therefore, no longer present in mature red cells. We can also not exclude in the mature erythrocyte the presence of an isoform whose mRNA was no longer detectable in the reticulocyte. In this regard, we should mention unpublished preliminary results obtained in a collaboration with D. R. Yingst, S.-Y. Yang, and R. Schiebinger, who have developed an affinity column to purify red cell Na,K-ATPase. We found, by Western blotting of eluted Na,K-ATPase, that the β1 isoform was present in this preparation. If confirmed, this finding raises new questions about the basis for the kinetic differences, referred to before, in uncoupled sodium efflux with regard to Na,K-ATPase isoform composition.
Because it had been concluded (20, 23) on the basis of Northern blotting that the concentration of Na,K-ATPase mRNA in reticulocytes must be very low, we decided to use the PCR method. This method makes it possible to deal with the problem of the extremely low abundance of Na,K-ATPase, and to provide a way to obtain complete sequence information. PCR makes it possible to amplify a sequence even if there are only a few copies present. The downside of this sensitivity, however, is that even trace contamination in the cDNA preparation may lead to false positives. The most likely source of contamination in our reticulocyte cDNA preparation is leukocyte genomic DNA or leukocyte single-stranded cDNA. The standard reticulocyte RNA preparation (14) avoids leukocyte contamination first by removing the buffy coat, which contains mainly leukocytes, and second by selectively lysing only red cells and removing unlysed cells by centrifugation. The second step reduces the leukocyte contamination by two orders of magnitude. In contrast to the standard method, we chose to minimize the extent of leukocyte contamination by filtration of freshly drawn whole blood through high performance filters type RCZL and RCXL (Pall). These filters are known to reduce the leukocyte count per unit of blood (500 ml) from approximately 1–3 × 10⁹ to less than 2 × 10⁵ with filter type RCXL or even to less than 1,000 with filter type RCZL (personal communication, Pall). Most of the preparations were carried out using filter type RCZL. To evaluate whether such reduction in potentially contaminating cells was sufficient, we also probed (Fig. 3) a human leukocyte library with PCR. It is evident that the expression of isoforms was clearly different in leukocytes and our reticulocyte preparations (Table 3), indicating that leukocyte contamination in our reticulocyte preparations was negligible.
The important point is now to evaluate the functional consequences of the subunit isoforms that are present in red cells and to determine the extent to which the transport characteristics of different tissue types depend upon any particular subunit composition. It would be premature to speculate about mechanisms that control Na,K-ATPase expression and degradation from stem cell to erythrocyte. The stem cell presumably contains many more copies of the Na,K-ATPase than the mature red cell, but whether or not subunit isoform composition is altered during these transitions has yet to be determined.
Acknowledgments
We thank Drs. Robert Mercer and Cecilia Canessa for helpful discussions, Dr. Nancy Berliner for the leukocyte library, and Paul DiPasquale and Olga Potapova for excellent technical assistance. This work was supported by National Institutes of Health Grant HL52720.
Note Added in Proof
The sequencing of the α3 isoform has now been completed, and the sequence has been found to be the same as previously published sequences of this isoform. Three additional isoform-specific primers (as in Table1) were used to complete the sequencing of α3. The cDNA bp positions and 5′ → 3′ sequences were as follows: 645–671, GCCCCAGACTCGCTCTCCCGACTGCAC; 918–888, TCCGAGAATGAGGGAGAGGATGAAGAAGGAG; 1,221–1,248, GCACACCTGGGTGGCCCTGTCTCACATC.
References
- 1.Martin W H, Richards D E, Marin R, Jack-Hays M, Hoffman J F. Proc Natl Acad Sci USA. 1994;91:9881–9885. doi: 10.1073/pnas.91.21.9881. [DOI] [PMC free article] [PubMed] [Google Scholar]
- 2.Garrahan P J, Glynn I M. J Physiol. 1967;192:159–174. doi: 10.1113/jphysiol.1967.sp008294. [DOI] [PMC free article] [PubMed] [Google Scholar]
- 3.Dissing S, Hoffman J F. J Gen Physiol. 1990;96:167–193. doi: 10.1085/jgp.96.1.167. [DOI] [PMC free article] [PubMed] [Google Scholar]
- 4.Mercer R W, Schneider J W, Benz E J., Jr . The Red Cell Membranes: Structure, Function, and Clinical Implications. New York: Dekker; 1989. pp. 135–165. [Google Scholar]
- 5.Shamraj O I, Lingrel J B. Proc Natl Acad Sci USA. 1994;91:12952–12956. doi: 10.1073/pnas.91.26.12952. [DOI] [PMC free article] [PubMed] [Google Scholar]
- 6.Malik N, Canfield V A, Beckers M-C, Gros P, Levenson R. J Biol Chem. 1996;271:22754–22758. doi: 10.1074/jbc.271.37.22754. [DOI] [PubMed] [Google Scholar]
- 7.Blanco G, DeTomaso A W, Koster J, Xie Z J, Mercer R W. J Biol Chem. 1994;269:23420–23425. [PubMed] [Google Scholar]
- 8.Lücking K, Nielsen J M, Pedersen P A, Jorgensen P L. Am J Physiol. 1996;271:7253–7260. doi: 10.1152/ajprenal.1996.271.2.F253. [DOI] [PubMed] [Google Scholar]
- 9.Blanco G, Sanchez G, Mercer R W. Biochemistry. 1995;34:9897–9903. doi: 10.1021/bi00031a011. [DOI] [PubMed] [Google Scholar]
- 10.Blanco G, Koster J, Sanchez G, Mercer R W. Biochemistry. 1995;34:319–325. doi: 10.1021/bi00001a039. [DOI] [PubMed] [Google Scholar]
- 11.Munzer J S, Daly S I, Jewell-Motz E A, Lingrel J B, Blostein R. J Biol Chem. 1994;269:16668–16676. [PubMed] [Google Scholar]
- 12.Therien A G, Nestor N B, Ball W J, Blostein R. J Biol Chem. 1996;271:7104–7112. doi: 10.1074/jbc.271.12.7104. [DOI] [PubMed] [Google Scholar]
- 13.Imada M, Maede Y. J Biol Chem. 1986;261:16099–16105. [PubMed] [Google Scholar]
- 14.Goossens M, Kan Y W. Methods Enzymol. 1981;76:805–817. doi: 10.1016/0076-6879(81)76159-7. [DOI] [PubMed] [Google Scholar]
- 15.Johnston J, Bollekens J, Allen R H, Berliner N. J Biol Chem. 1989;264:15754–15757. [PubMed] [Google Scholar]
- 16.Sambrook J, Fritsch E F, Maniatis T. Molecular Cloning: A Laboratory Manual. 2nd Ed. Plainview, NY: Cold Spring Harbor Lab. Press; 1989. [Google Scholar]
- 17.Mercer R W, Biemesderfer D, Bliss D P, Collins J H, Forbush B., III J Cell Biol. 1993;121:579–586. doi: 10.1083/jcb.121.3.579. [DOI] [PMC free article] [PubMed] [Google Scholar]
- 18.Ushkaryov Y A, Monastyrskaya G E, Broude N E, Nikiforova N N, Bessarab D A, Orlova M Y, Petrukhin K E, Modyanov N N, Sverdlov E D. FEBS Lett. 1989;257:439–442. doi: 10.1016/0014-5793(89)81591-1. [DOI] [PubMed] [Google Scholar]
- 19.Kawakami K, Ohta T, Nojima H, Nagano K. J Biochem (Tokyo) 1986;100:389–397. doi: 10.1093/oxfordjournals.jbchem.a121726. [DOI] [PubMed] [Google Scholar]
- 20.Dhir R, Nishioka Y, Blostein R. Biochim Biophys Acta. 1990;1026:141–146. doi: 10.1016/0005-2736(90)90056-t. [DOI] [PubMed] [Google Scholar]
- 21.Martin-Vasallo P, Dackowski W, Emanuel J R, Levenson R. J Biol Chem. 1989;264:4613–4618. [PubMed] [Google Scholar]
- 22.Barlet-Bas C, Arystarkhova E, Cheval L, Marsy L, Sweadner K, Modyanov N, Doucet A. J Biol Chem. 1993;268:11512–11515. [PubMed] [Google Scholar]
- 23.Chebab F F, Kan Y W, Law M L, Hartz J, Kao F, Blostein R. Proc Natl Acad Sci USA. 1987;34:7901–7905. doi: 10.1073/pnas.84.22.7901. [DOI] [PMC free article] [PubMed] [Google Scholar]