Abstract
We have previously identified three homologous subunits α, β, and γ of the highly selective amiloride-sensitive Na channel from the Xenopus laevis kidney A6 cell line, which forms a tight epithelium in culture. We report here two novel genes, termed β2 and γ2, which share 90 and 92% sequence identity with the previously characterized β and γ XENaC, respectively. β2 and γ2 transcripts were detected in lung, kidney, and A6 cells grown on porous substrate. The physiological and pharmacological profile of the Na channel expressed after αβ2γ XENaC cRNA injection in Xenopus oocyte did not differ from αβγ XENaC. By contrast, the channel expressed after αβγ2 injection showed: (i) a lower maximal amiloride-sensitive sodium current, (ii) a higher apparent affinity for external sodium and inactivation of the sodium current by high sodium concentrations, and (iii) a lower apparent affinity for amiloride (KI αβγ2; 1.34 μM versus αβγ 0.35 μM). These data indicate that the γ (and/or γ2) subunit participates in amiloride binding and the sensing of the extracellular sodium concentration. The close homology between γ and γ2 will help to define the domains involved in sensing external sodium and in the structure of this important drug receptor.
Keywords: aldosterone, sodium transport, sodium self-inhibition
In tight epithelia, electrogenic sodium reabsorption is mediated by a sodium-selective amiloride-sensitive channel, located in the apical membrane facing the external compartment (1–3). This channel is the rate limiting step in sodium reabsorption and control of its activity is essential to the maintenance of the global sodium balance and blood pressure (4). The biophysical properties of the highly selective epithelial Na channel have been well defined in the apical membrane of the rat cortical collecting duct (5) and that of the A6 cell line (6), a cell line derived from the Xenopus laevis kidney. In both A6 cells and rat cortical collecting duct the highly selective Na channel is characterized by: (i) its high sodium selectivity with a PNa/PK as high as 30, (ii) a low single-channel conductance (4–5 pS), (iii) a gating kinetics characterized by long times of closures and openings (in the range of a few seconds), and (iv) a high sensitivity to amiloride (Ki in the submicromolar range) (3). There are other types of sodium-permeable channels in epithelial cells and they can be classified according to their amiloride sensitivity or to their ion selectivity (3, 7). According to Palmer’s classification (3), in addition to the highly selective 5 pS (Type 1) Na channel, there is a 9 pS (Type 2) channel with a lower ionic selectivity (PNa/PK around 4) and a nonselective cation channel (Type 3). We have recently identified the primary structure of a Type 1 ENaC of the rat distal colon epithelium (8, 9). We proposed that the rat epithelial Na channel is a heterooligomeric protein, made of three homologous subunits, the α, the β, and the γ rENaC. The cloning of the α, β, and γ subunits from human tissues has also been recently reported (10–13).
We have also identified three homologous subunits (α, β, and γ XENaC) from the cell line A6 (14). Besides the 2.4-kb β transcript, Northern blot analysis of lung and kidney revealed additional bands of higher molecular weight, suggesting the presence of other gene products. We report here two novel genes, termed β2 and γ2, which share 90 and 92% sequence identity with the previously characterized β and γ XENaC, respectively, and the initial physiological characterization of the channel formed using these subunits.
MATERIALS AND METHODS
Cells and Cell Culture Procedures.
A6 cells (passage 80–90), from the American Type Culture Collection, were recloned by limiting dilution and grown on plastic dishes at a density of 1.2 × 10⁶/cm2. The subclone used in this study (A6–2F3) has been previously described (15). For experiments with cells grown on plastic substrate, A6 cells were cultured until they formed a confluent monolayer and stimulated with aldosterone or control-incubated. Unstimulated cells were used to seed semipermeable filters (Costar 3419) on which cells were allowed to grow for 10 more days, before aldosterone stimulation and extraction.
Isolation of Poly(A)+ RNA.
Total RNA was isolated from A6 cells grown on a plastic substrate or permeable filters. In some instances cells were previously stimulated for 24 hr with 300 nM of aldosterone (Sigma). Cells were lysed in 0.5% SDS, 100 mM NaCl, 1 mM EDTA, 20 mM Tris⋅HCl (pH 7.5) and digested with proteinase K (200 μg/ml, Sigma) for 1 hr at 37°C. poly(A)+ RNA was purified by oligo(dT) cellulose-affinity chromatography (16). Typical yields were 110 μg of poly(A)+ from 24 filters or 30 Petri dishes. poly(A)+ RNA from A6 cells destined to cDNA libraries was further enriched in channel activity by size fractionation on a 5–20% sucrose gradient and functional activity test in oocytes (14, 17). poly(A)+ RNA from fresh tissues of Xenopus was extracted as mentioned above except that the RNAs were not enriched on sucrose gradients. poly(A)+ RNA from Xenopus oocytes was extracted as follows: 200 oocytes, selected for stage, were lysed by Polytron in 10 mM Tris⋅HCl (pH 7), 1.5 mM MgCl2, 10 mM NaCl, 2% SDS, 0.3 M sodium acetate (pH 5.2), 2 μg/ml proteinase K and incubated at 37°C for 1 hr. The lysate was extracted several times with phenol chloroform and nucleic acids were precipitated overnight with 2.5 vol of absolute ethanol at −20°C. poly(A)+ was purified using oligo(dT) resin.
Identification of β2 and γ2 XENaC.
First-strand cDNA synthesis was performed on 2–3 μg of poly(A)+ RNA using superscript reverse transcriptase (RT) (Superscript II, BRL), 500 μM of dNTPs and oligo(dT) (Pharmacia, 0.1 μg/μl). Fragments of β2 or γ2 XENaC were amplified using Taq DNA polymerase (Boehringer Mannheim) and degenerated oligonucleotides designed to recognize nonselectively all potential α, β, and γ subunits of XENaC (14). The sense 5′ primer was: 5′-GGIAA(C/T)TG(C/T)TA(C/T)ACITT(C/T)AA-3′, corresponding to the amino acids GNCYTFN (positions [AA] 262–268 in α XENaC). The antisense 3′ primer was:
5′-CGCGGATCCCAT(A/G)TT(C/T)TC(C/T)TG(A/G)AA(A/G)CA-3′. It corresponds to the sequence CFQENM (positions [AA] 381–386 in α XENaC) and contains a BamHI site on its 5′ end.
PCR reactions were performed in Taq DNA polymerase buffer (Boehringer Mannheim) supplemented with 80 μM of dNTP, 250 ng of the 5′ and the 3′ degenerate sense and antisense oligonucleotides, 10–30 ng of single-stranded cDNA, and 1 unit of Taq DNA polymerase. Cycles were as follows: addition of the enzyme at 94°C, followed by 30 cycles of 1 min at 94°C, 2 min at 42°C, and 1.5 min at 72°C. PCR products of expected size (390 nt) were purified and blunted using T4 DNA polymerase (5 min at 16°C) and phosphorylated with polynucleotide kinase (New England Biolabs). The fragments were digested with BamHI, purified on an agarose gel, and subcloned into pBluescript KS(II) (Stratagene) and sequenced.
Once one subunit was identified it was removed from the reaction mixture by digestion with restriction endonucleases, which were specific for a given subunit (for instance StyI for α XENaC, XbaI for β XENaC, NcoI for γ XENaC, PvuII for β2 XENaC, and BclI for γ2 XENaC). Undigested material was purified on an agarose gel and an aliquot was used to reinitiate a second PCR reaction under the same experimental conditions. Amplified products were subjected to a second/third round of digestion with the same restriction endonuclease and only the resistant material was subcloned and sequenced.
Isolation of Full-Length Clones.
Two plasmid cDNA libraries were constructed; one from A6 cells grown on filters and one from Xenopus kidney, using standard procedures (SuperScript Plasmid System, BRL). The 5′ SalI-adapted cDNA was digested with NotI and cloned into the pSPORT vector (BRL). For the γ2 XENaC screen, a cDNA library of 300,000 independent clones from aldosterone-stimulated A6 cells cultured on filters was divided into 26 pools and first screened by PCR using specific oligonucleotides for γ2 XENaC. For β2 XENaC, a cDNA library from Xenopus kidney (150,000 independent clones) also divided into pools was screened with specific oligonucleotides. Positive pools (≈12,000 clones) were then screened with the corresponding PCR-generated DNA fragments. A specific probe for β2 XENaC was available, whereas the γ2 XENaC probe also recognized γ XENaC. γ2 XENaC clones were distinguished from γ XENaC by PCR. All polynucleotide probes were labeled with [α-32P]dCTP using standard procedures (Random-Primed Labeling kit, Boehringer Mannheim). The hybridization conditions were 20% of formamide, 5× SSC, 2× Denhardt’s solution, 0.1% SDS, and 150 μg/ml of denatured salmon sperm DNA at 42°C. Nylon membranes (Hybond-N, Amersham) were washed in 1× SSC at 42–50°C and exposed at −70°C. Full-length clones were analyzed by sequencing using the chain-termination reaction and T7 DNA polymerase (United States Biochemicals).
Northern Blot Analysis and RT-PCR.
poly(A)+ RNA isolated from fresh organs of X. laevis or cultured A6 kidney cells was electrophoresed on a 1% denaturing glyoxal agarose gel and blotted to Hybond-N membranes and cross-linked. The membranes were hybridized with 390-nt long PCR-generated probes specific to either α, β, or γ XENaC (14). The probes for β XENaC and γ XENaC recognized both β and β2 XENaC and γ and γ2 XENaC, respectively. A 350-nt probe specific to β2 XENaC was obtained by PCR from the 3′ untranslated region of β2 XENaC. Hybridization conditions were for 16 hr at 42°C in 25% formamide, 5× SSC, 5× Denhardt’s solution, 0.1% SDS, and 150 μg/ml of denatured salmon sperm DNA. Blots were washed at 42–50°C in 1× SSC and exposed for 1–5 days at −70°C.
The presence of β2 and γ2 XENaC transcripts was also checked by PCR in kidney, lung, and A6 cells grown under different conditions. Oligonucleotides specific to each of the identified subunits were used, and negative controls were included in all PCR runs.
γ/γ2 Chimeric Constructs.
Two pairs of symmetric chimeric peptide composed of part of the γ and part of the γ2 were constructed. A first chimera (N1-c2) was composed of a large γ N-terminal segment comprising the N-terminal cytoplasmic domain, the first hydrophobic segment and most of the extracellular loop, and of the second hydrophobic segment and the C terminus of γ2 (cutting point at amino acid position 460, PstI site). The second chimera (N2-c1) was the symmetric construct. In the third and fourth constructs (n1-C2 and n2-C1), the cutting point was located at amino acid position 171 (PvuII site) in the initial part of the extracellular loop (see scheme in Fig. 7). These chimeric constructs were subcloned into the SalI–NotI sites of the pSPORT1 expression vector.
Figure 7.
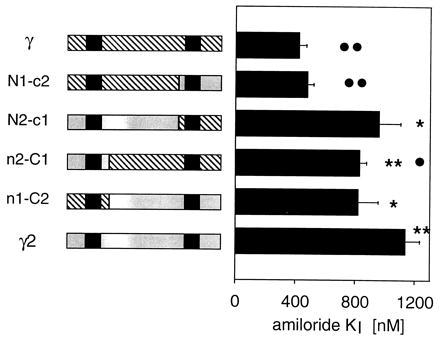
Amiloride affinity in γ/γ2 chimeric constructs. The inhibition constant (KI) for amiloride was measured in oocytes injected with α and β subunit cRNA and either γ, γ2, or one of the four chimeric constructs cRNA. The scheme shows the structure of the chimera with the γ part hatched and the γ2 part shaded. The position of the two hydrophobic segments is indicated by solid boxes. The statistical significance of the differences is indicated as follows: ∗ and ∗∗ indicate P < 0.01 and P < 0.001, respectively, when compared with the γ group. • and •• indicate P < 0.01 and P < 0.001, respectively, when compared ith the γ2 group.
Functional Expression in Xenopus Oocytes.
To improve and to standardize cRNA synthesis rate, all ENaC subunits were recloned as SalI–NotI fragments into a modified pSD5 vector, containing a part of the polylinker of the Bluescript vector and 100 adenosine residues downstream to the insert. SP6 RNA polymerase (Promega) was used for cRNA synthesis. Typically, 1 ng of cRNA subunit per oocyte was injected in a total volume of 50 nl. The amiloride-sensitive sodium current was measured after 2–3 days of incubation.
Measurement of amiloride-sensitive current in oocytes.
Using the two-electrode voltage-clamp technique, amiloride-sensitive currents were measured as described (9) at room temperature (22–25°C) and at −100 mV in a solution containing 100 mM sodium gluconate, 2 mM KCl, 1.8 mM CaCl, 10 mM Hepes (pH 7.2), 5 mM BaCl2, and 10 mM tetraethylammonium chloride.
Apparent affinity for amiloride.
The inhibition constant (KI) for amiloride was obtained by measuring the whole cell current after successive addition of five concentrations of amiloride ranging from 50 nM to 50 μM. Affinity values were obtained by fitting the parameters of a single-site binding equation to the current inhibited by amiloride (Iam)
 |
where Iammax is the maximal current inhibition and [am] the concentration of amiloride.
Apparent affinity for Na+.
The apparent affinity of ENaC for Na+ was measured as the half activation constant (K1/2Na) of the amiloride-sensitive current. Amiloride-sensitive currents were measured in solutions containing 0, 1, 3, 10, 30, or 100 mM Na+, obtained by equimolar replacement of Na+ gluconate by N-methyl-d-glucamine (NMDG) gluconate. A high concentration of amiloride (50 μM) was used for these experiments to ensure an equally complete inhibition of the current through the ENaC isoforms. In the absence of external Na+, outward amiloride-sensitive currents were observed even at −100 mV. These currents were of small but variable amplitude, probably depending on the state of sodium loading of the oocytes. To obtain a correct relationship between external sodium concentration and inward sodium current, the outward amiloride-sensitive currents measured in the absence of external Na+ were subtracted from the currents measured at each sodium concentration.
RESULTS
Primary Structure of the β2 and γ2 Subunits of XENaC.
We identified two new genes products of X. laevis coding for proteins that belong to the epithelial Na channel family. The two clones have been termed β2 and γ2 because of the high degree of homology with the formerly known XENaC β and γ subunit, respectively. The β2 clone is 2686 nt long and contains a single open reading frame encoding a 646 amino acid peptide. The γ2 clone is 3665 nt long with a single open reading frame encoding a 662 residue peptide. The degree of similarity is generally high, but significantly lower in the noncoding region than in the coding region. The nucleotide sequence identity amounts to 92.3% between β and β2 isoforms and 90.6% between γ and γ2 in the coding region. It averages about 58% between β and β2 isoforms and about 56% between γ and γ2 in the available parts of the 3′ and 5′ noncoding regions.
The amino acid sequences deducted from the β2 and γ2 clones are shown in Fig. 1, aligned with the known β and γ subunit peptides. The similarity between β and β2 isoforms at the protein level is very high, with only 45 different residues and 1 single amino acid deletion (= 93.0% identity, β2 versus β). The similarity is slightly lower between the γ and γ2 peptides with 58 different residues and an addition of 3 residues (= 91.2% identity, γ2 versus γ).
Figure 1.
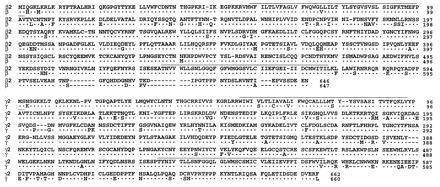
Sequence of the novel β2 and γ2 subunit of XENaC. The deducted amino acid sequences of the β2 and γ2 isoforms are aligned with the corresponding β and γ XENaC subunits [output of the pileup program of the Genetics Computer Group sequence analysis software package (18)]. Dots indicate that the residue in the β isoform is identical to the same position in the β2 isoform, and similarly for the γ and γ2 subunits. A dash indicates that a gap was introduced for obtaining a best-fit alignment. Lines above sequences indicate the positions of the putative transmembrane segments.
Tissue Distribution.
Northern blot analysis (Fig. 2) showed that the β2 isoform could be observed as a 2.9-kb transcript in kidney at a relatively high level, similar to the level of the β isoform in this organ. It was present with a lower abundance in lung, where a clear dominance of the β isoform was present. A weak β2 signal was also detected in A6 cells grown on permeable support, but not in A6 cells grown on plastic. The 3.8-kb γ2 transcript was relatively abundant in A6 cells grown on permeable support, although at a much lower level than the γ isoform. It could never be detected in A6 cells grown on plastic and was not detected by Northern blot analysis in kidney or lung (Fig. 2D). When probed with αXENaC, one single 3.0-kb transcript was detected in all tested tissues.
Figure 2.
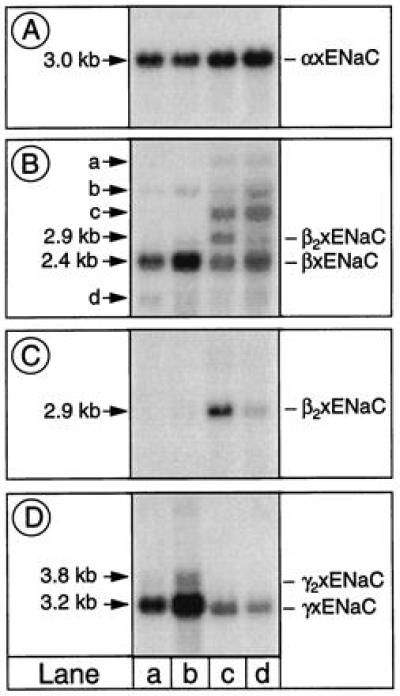
Tissue distribution by Northern blot analysis. Northern blot analysis of α, β, β2, γ, and γ2 transcript in lung, kidney, and A6 cells grown either on plastic or on permeable support. poly(A)+ RNA (3 μg) were loaded in lanes a (A6 cells grown on plastic) and b (A6 cells grown on filters), whereas 5 μg of poly(A)+ RNA was loaded in lanes c (kidney) and d (lung). The probes used to recognize α (A), β (B), β2 (C), and γ (D) have been described. The probe for β XENaC (B) also recognizes β2 XENaC and four other transcripts, but their presence was not consistent from one RNA extraction to another. (C) The same blot was probed with a fragment, which specifically recognized β2XENaC.
These results were generally confirmed by RT-PCR of the same transcript (Fig. 3). Fragments with the expected size for the β2 transcript were detected in kidney, lung, and A6 cells grown on filters, but not in A6 cells grown on plastic. The β2 and γ2 signals were most evident in A6 cells grown on filter, detectable in lung and kidney, but always absent in A6 cells grown on plastic.
Figure 3.
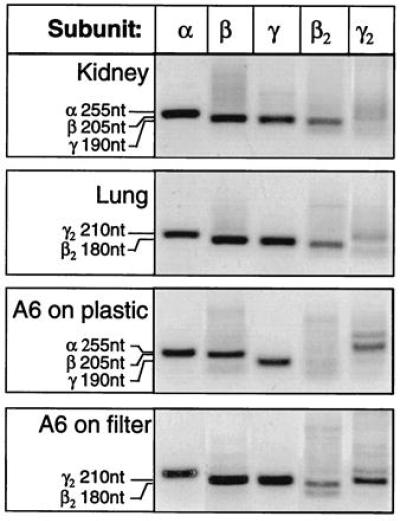
Tissue distribution by RT-PCR. RT-PCR analysis in the same tissues. The transcripts of all five subunits were present in kidney, lung, and A6 cells grown on a porous substrate. Transcripts of the expected size for β2 and γ2 XENaC could never be detected when single-stranded cDNA derived from RNA from A6 cells grown on plastic was used as a template. Considering the high sensitivity of the RT-PCR methods, this makes unlikely the presence of a significant number of these transcripts in cells grown on plastic.
Functional Expression of β2 and γ2 Subunits of XENaC in Xenopus Oocytes.
Expression and affinity for amiloride.
To compare the functional characteristics of the new isoforms of the β and γ subunits we studied the amiloride-sensitive current in oocytes injected with the following combinations of subunit cRNA: αβγ, αβ2γ, αβγ2, and αβ2γ2. Fig. 4 shows the results of the current sensitive to 20 μM of amiloride (a) and the apparent affinity for amiloride of these ENaC isoforms (b). The amplitude of the amiloride-sensitive current was reduced in the heteromer including the γ2 isoform compared with those including the γ isoform. The oocytes expressing αβγ2 had, however, a much larger amiloride-sensitive current than the oocyte expressing αβ without any γ subunit, in which the amiloride-sensitive current was often not detectable (4.8 ± 1.2 nA, n = 20). The γ2 isoform also conferred a significantly lower affinity for amiloride by a factor of about 3. In contrast, no significant difference of level of expression or of affinity for amiloride could be observed between heteromers expressing the β and β2 isoform.
Figure 4.
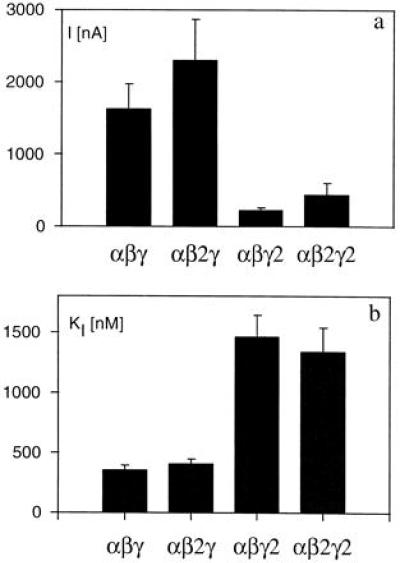
Amiloride-sensitive current in isoforms of XENaC. Oocytes injected with the indicated combination of cRNA α, β, and γ subunits were studied under voltage-clamp conditions at −100 mV in a 100 mM sodium amphibian Ringer. (a) The current inhibited by a high concentration of amiloride (20 or 50 μM). The number of observations were 41, 25, 23, and 18 for the αβγ, αβ2γ, αβγ2, and αβ2γ2 groups, respectively. (b) The inhibitory constant of amiloride in each group. The number of measurements were 10, 4, 7, and 8 in αβγ, αβ2γ, αβγ2, and αβ2γ2, respectively.
Relationship between the amiloride-sensitive sodium current and the sodium concentration.
Because of the functional difference between ENaC isoforms including the γ and γ2 subunits with regards to amiloride binding, we also examined the effect of the type of γ subunit on the affinity for Na+. The relationship between external Na+ concentration and amiloride-sensitive inward current at −100 mV is shown in Fig. 5. It should be noted that Fig. 5 shows current as values relative to those measured with 100 mM Na+; the absolute values were in fact about 10 larger in the αβγ group than in the αβγ2 group (for exact values see the legend of Fig. 5). In the oocytes expressing the αβγ isoform the relationship was reasonably well described by a simple one-site activation kinetic with a K1/2 of about 10 mM. In the αβγ2 group the relationship was clearly different. First, Iam was consistently smaller in the presence of 100 mM Na+ than in 30 mM Na+. Second, the concentration needed to activate a current with an amplitude of one-half of the maximal amplitude was about 2.8 mM (although no meaningful K1/2 value could be obtained because of the poor quality of the fit with a one-site activation kinetic equation). In Fig. 5, the current/concentration relationship of the αβγ2 group is shown with a fit to a two-site equation (see Fig. 5 legend) with one high-affinity activating site (K1/2 4.9 ± 0.14) and one low-affinity inhibitory site (K1/2l 154 ± 6 mM). The reasons for using this equation were first, the need for a biphasic effect of sodium concentration and second, the experimental evidence for a Na ≪ self-inhibition ≫ site (1).
Figure 5.
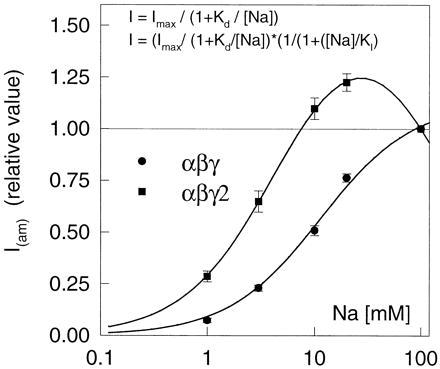
Kinetics of the activation by sodium of the amiloride-sensitive current. The current sensitive to 50 μM amiloride at −100 mV, I(am), was measured in solutions containing 0, 1, 3, 10, 20, and 100 mM Na+. All current values were normalized to the value of the amiloride-sensitive current in 100 mM Na, which was 3,630 ± 1,070 nA (n = 12) in the αβγ group and 167 ± 73 nA (n = 8) in the αβγ2 group. In the αβγ group the sodium concentration/I(am) relationship was well described by simple Michaelis–Menten kinetics (upper equation) with a Kd of 11.3 mM. In the αβγ2 group the sodium concentration/I(am) relationship was obviously different, with a significantly lower value in 100 mM Na+ than in 20 mM Na+. The curve fitted to the αβγ2 data points (lower equation) represents a double effect of Na+ concentration on the amiloride-sensitive current; first, an activation effect with a Kd of 4.8 mM and second, an inhibitory effect with a KI of 154 mM.
Na+/amiloride interaction.
The binding of amiloride to the Na channel of tight epithelia is know to be inhibited by external Na+ in a competitive manner (1). To investigate the relationship between the effect of the γ and γ2 isoforms on the affinity for amiloride and sodium, we measured the amiloride half-inhibition constant (KI) in solution containing 2.5, 10, 25, or 100 mM Na+ (solutions prepared by NMDG replacement as described). The results of these measurements are summarized in Fig. 6. Assuming competitive binding to a single site, the apparent affinity for amiloride should decrease with increasing concentration of external Na+, according to
 |
1 |
where KIapp is the apparent KI for a given Na+ concentration, [Na] is the external Na+ concentration, and KdNa the affinity of Na+ for the amiloride bindingsite. Eq.1 can also be written as
 |
2 |
where KIapp appears as a linear function of [Na]. Fig. 5 shows that in both group there was a linear relationship between the apparent KI and the Na+ concentration. The intercept of the regression line yielded values very close to 160 nM for both groups, indicating that the intrinsic affinity (i.e., the affinity in the absence of competing Na+ ions) of amiloride for its binding site was similar in both groups. From the slope of the regression lines of the KIapp versus [Na] plot an affinity of Na+ for the amiloride site could be calculated: it was 55 mM for the αβγ isoform and 12 mM for the αβγ2 isoform.
Figure 6.
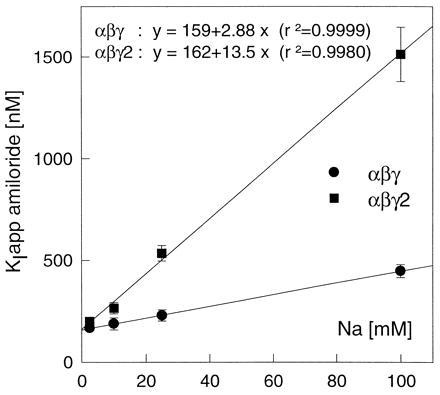
Na-/amiloride interaction. The graph reports the apparent affinity for amiloride as a function of the extracellular Na+ concentration. Each point represent a group of 8–14 oocytes in which the response to 5 concentrations of amiloride was measured in a concentration of extracellular Na+ current. Experiments were performed in parallel on a similar number of oocytes expressing the αβγ and αβγ2 isoforms of XENaC. The parameters of the regression lines for the two isoforms are indicated above the graph.
We then measured the amiloride affinity in oocyte injected with α and β subunits cRNA and with either γ or γ2 or one of four γ/γ2 chimeric constructs as described in Fig. 7. The chimera in which the transition point was located shortly after the first hydrophobic region (n1-C2: N-terminal γ/C-terminal γ2, or n2-C1: N-terminal γ2/C-terminal γ) yielded amiloride KI values intermediate between those obtained with wild-type γ and γ2, but with the chimeras in which the transition point was located close to the end of the extracellular loop region (N1-c2: N-terminal γ/C-terminal γ2, or N2-c1: N-terminal γ2/C-terminal γ), a low affinity was clearly associated with the γ2 N-terminal two-thirds of the peptide (Fig. 7), whereas amiloride KI obtained with the chimera with the γ N terminal was not different from those obtained with wild-type γ.
DISCUSSION
Amiloride-sensitive electrogenic Na+ transport is carried out by several amphibian epithelia that belong to organs (kidney, lung, skin, colon) with largely different functions. The ionic composition of the external media to which these epithelia are also widely different, suggesting that different forms of the channel might be needed to perform the task of transepithelial Na+ transport. In amphibian as well and in mammals, the epithelial Na channel appears to be made of three homologous subunits α, β, and γ (8, 14). The indication by Northern blot analysis of amphibian tissues of the possible presence of additional gene products reacting with the probes for the α, β, and γ subunits of XENaC prompted us to investigate the existence of isoforms of these subunits. Our search led to the discovery of two new gene products that, because of sequence similarity, we consider as isoforms of the β and γ subunits and therefore termed β2 and γ2.
X. laevis is a tetraploid organism following a genome duplication that occurred some 30 millions years ago (19). It was therefore reasonable to ask whether the β2 and γ2 XENaC genes might have resulted from the genome duplication. In an attempt to answer this question, we compared the degree of identity between β and β2 XENaC and γ and γ2 XENaC, respectively, to that of other duplicated genes of Xenopus. Using Lipman–Pearson protein alignment we obtained the following percentages of identity: actin (99.7% over 377 codons) and integrin β1 subunit (97.6% over 798 codons) are well conserved, whereas insulin (92.5% over 106 codons) and albumin (88.8% over 606 codons) are quite divergent for duplicated genes in the same organism. If we compare the values we calculated for β and β2 (92.7% over 647 codons and γ and γ2 (90.0% over 663 codons), it appears that the degree of similarity between these channel subunits is lower than between the average duplicated X. laevis proteins, but still falls well within the range of values found for certain duplicated genes like albumin (19). Two hints argue against the duplication being related to tetraploidy: we were never able to identify a second α subunit either by library screening or by looking for a second transcript on Northern blots. In addition, the observation of more than two transcripts for β XENaC suggests the existence of more than two β subunits or at least isoforms resulting from alternative splicing. It was however not possible to decide from these observations if the β/β2 and γ/γ2 gene duplications are, or are not, related to the whole genome duplication. This point is of relatively minor importance since, in any case, the γ2 protein has acquired biological and physiological properties that are different from the parent γ protein. Differential tissue distribution and expression during development has indeed already been observed for pairs of duplicated proteins in Xenopus (19). Whatever the precise time of the gene duplication, and considering the high degree of homologies, it is probable that the divergence between β and β2—and, similarly, between γ and γ2—has occurred after the divergence of the mammalian and the amphibian lineage. It is therefore difficult to evaluate how much of this finding might be relevant for mammalian species.
The tissue distribution of the new β2 subunit is qualitatively different from the β isoform; β2 transcript is more abundant in kidney than in lung relative to the β transcript. There was a large difference in expression of the β2 and γ2 transcripts between cells grown on permeable support and cells grown on plastic. It appears therefore that the expression of these genes is regulated according to cell type and the state of differentiation of these cells. The existence of isoforms may have a functional significance, either because of the expression of channel with different physiological characteristics, as those shown for the γ subunit isoforms, or because the expression of isoform can be controlled by different promoters and thus regulated by different signals.
Our initial physiological characterization did not allow us to detect any gross difference in the physiological properties of channels including the β2 subunit when compared with those containing the β subunit. Because this characterization was rather elementary does not mean that there are no functional differences between these two isoforms. Regarding the γ subunit, there was an obvious difference of affinity for amiloride, with a 3-fold lower affinity for the oocytes expressing the γ2 isoform (coexpressed either with αβ or αβ2) compared with those expressing the γ isoform. In addition, the kinetics of the activation of the Na+ current through the channel were clearly different: the αβγ2 isoform had an higher apparent affinity for Na+ with a current/concentration relationship indicating the presence of more than one binding site, and supporting the presence of an inhibitory binding site for external Na+. The physiological relevance of this difference resides in the fact that Na+ entry into cells expressing this type of channel would be strongly limited at Na+ concentration higher than 5 or 10 mM. It may allow a large flow of sodium reabsorption at low Na+ concentrations, while avoiding excessive Na+ load to the epithelial cell in case of an increase of Na+ above the millimolar range.
The mechanism of the block of the epithelial Na+ channel by amiloride and the relationship between the amiloride binding site and Na+ binding site(s) has been extensively studied in amphibian model tight epithelia (1). Although most studies have reported a competitive type of antagonist binding between Na+ and amiloride, there were also data supporting other types of antagonism. The availability of two ENaC isoforms with a difference in Na+ and amiloride apparent affinity prompted us to reevaluate the role of Na+ ions in amiloride binding. As shown in Fig. 6, in isoforms αβγ and αβγ2, our data fit well with the predictions of a competitive binding model. The binding of amiloride seemed to be about 4- to 5-fold more sensitive to the concentration of Na+ in the αβγ2 isoform.
The intrinsic affinity of amiloride, i.e., its affinity in the absence of competing Na+ ions, was very similar, around 160 nM, in both isoforms. This suggests that the amiloride binding site itself is not different in these two subunits. This result is entirely compatible with those of Schild et al. (20), who have recently demonstrated that a short segment preceding the putative second transmembrane domain, the ≪ pre-M2 ≫ segment, contains an essential determinant of amiloride affinity, since there is not a single amino acid difference between the γ and γ2 isoforms in this region. As amiloride-sensitive current can be reconstituted in the oocyte by expression of the α subunit alone, it was tempting to conclude that the amiloride binding site was constituted exclusively by the α subunit. However, the data presented by Schild et al. (20) showed that mutations in the homologous segments of the three subunits α, β, and γ have analogous effects. These data, and our present data, demonstrate that not only the α subunit but also the other subunits are involved, directly or indirectly, in amiloride binding.
Experiments with γ/γ2 chimera indicate that the difference in apparent amiloride affinity is determined by the N-terminal part of the peptide, which includes the first hydrophobic region and most of the extracellular loop. Since there was no difference in the intrinsic affinity for amiloride between γ and γ2, it seems that the difference in the apparent affinity for amiloride between the two isoforms and the chimeric constructs resulted from a modification of a Na+ binding site, responsible for the Na+-amiloride competition. The fact that a difference of similar amplitude was found between γ and γ2 for the current activation constant by Na+ (Fig. 5) and for the Na+-amiloride competition (Fig. 6) suggests that a single site for Na+ is involved in the conduction process and in amiloride binding. The results of the experiments with the chimeras indicate that this sodium ≪ receptor ≫ site, which may be one of the elements responsible for the sodium ≪ self-inhibition ≫ phenomenon, is located in the N-terminal two-third of the molecule, most probably in the extracellular loop. Whether this site is an extracellular site exposed to the bulk solution or a site located in the conduction pathway cannot be determined by our data.
In conclusion, we have identified and cloned two novel isoforms of subunits of the epithelial Na+ channel and shown that the γ2 isoform confers new properties to the trimeric channel protein. In addition, the steady-state level of the β2 and γ2 XENaC mRNA appears to be tissue specific and dependent on culture conditions. Taken together these findings suggest that one or more subunits of the epithelial Na channel might have evolved to modulate the function of this important sodium transport system.
Acknowledgments
This work was supported by Grant 31-43384.95 from the Swiss Fonds National de la Recherche Scientifique to B.C.R. and Grant RG 464/96 from the International Human Frontier Science Program to J.-D.H. A.M. was supported by a student fellowship from Glaxo (London).
ABBREVIATION
- RT
reverse transcriptase
Footnotes
References
- 1.Garty H, Benos D J. Physiol Rev. 1988;68:309–372. doi: 10.1152/physrev.1988.68.2.309. [DOI] [PubMed] [Google Scholar]
- 2.Garty H. FASEB J. 1994;8:522–528. doi: 10.1096/fasebj.8.8.8181670. [DOI] [PubMed] [Google Scholar]
- 3.Palmer L G. Annu Rev Physiol. 1992;54:51–66. doi: 10.1146/annurev.ph.54.030192.000411. [DOI] [PubMed] [Google Scholar]
- 4.Lifton R P. Science. 1996;272:676–680. doi: 10.1126/science.272.5262.676. [DOI] [PubMed] [Google Scholar]
- 5.Palmer L G, Frindt G. Proc Natl Acad Sci USA. 1986;83:2767–2770. doi: 10.1073/pnas.83.8.2767. [DOI] [PMC free article] [PubMed] [Google Scholar]
- 6.Eaton D C, Hamilton K L. In: The Amiloride-Blockable Sodium Channel of Epithelial Tissue. Narahashi T, editor. Vol. 7. New York: Plenum; 1988. pp. 251–282. [DOI] [PubMed] [Google Scholar]
- 7.Benos D J, Awayda M S, Ismailov I I, Johnson J P. J Membr Biol. 1995;143:1–18. doi: 10.1007/BF00232519. [DOI] [PubMed] [Google Scholar]
- 8.Canessa C M, Schild L, Buell G, Thorens B, Gautshi Y, Horisberger J-D, Rossier B C. Nature (London) 1994;367:463–467. doi: 10.1038/367463a0. [DOI] [PubMed] [Google Scholar]
- 9.Canessa C M, Horisberger J-D, Rossier B C. Nature (London) 1993;361:467–470. doi: 10.1038/361467a0. [DOI] [PubMed] [Google Scholar]
- 10.Voilley N, Lingueglia E, Champigny G, Mattéi M-G, Waldmann R, Lazdunski M, Barbry P. Proc Natl Acad Sci USA. 1994;91:247–251. doi: 10.1073/pnas.91.1.247. [DOI] [PMC free article] [PubMed] [Google Scholar]
- 11.McDonald F J, Snyder P M, McCray P B, Jr, Welsh M J. Am J Physiol. 1994;266:L728–L734. doi: 10.1152/ajplung.1994.266.6.L728. [DOI] [PubMed] [Google Scholar]
- 12.McDonald F J, Price M P, Snyder P M, Welsh M J. Am J Physiol. 1995;37:C1157–C1163. doi: 10.1152/ajpcell.1995.268.5.C1157. [DOI] [PubMed] [Google Scholar]
- 13.Voilley N, Bassilana F, Mignon C, Merscher S, Mattei M G, Carle G F, Lazdunski M, Barbry P. Genomics. 1995;28:560–565. doi: 10.1006/geno.1995.1188. [DOI] [PubMed] [Google Scholar]
- 14.Puoti A, May A, Canessa C M, Horisberger J-D, Schild L, Rossier B C. Am J Physiol. 1995;38:C188–C197. doi: 10.1152/ajpcell.1995.269.1.C188. [DOI] [PubMed] [Google Scholar]
- 15.Verrey F, Schaerer E, Zoerkler P, Paccolat M P, Geering K, Kraehenbühl J-P, Rossier B C. J Cell Biol. 1987;104:1231–1237. doi: 10.1083/jcb.104.5.1231. [DOI] [PMC free article] [PubMed] [Google Scholar]
- 16.Palmer L G, Corthésy-Theulaz I, Gaeggeler H-P, Kraehenbühl J-P, Rossier B. J Gen Physiol. 1990;96:23–46. doi: 10.1085/jgp.96.1.23. [DOI] [PMC free article] [PubMed] [Google Scholar]
- 17.Good D W, Wright F S. Am J Physiol. 1980;239:F289–F298. doi: 10.1152/ajprenal.1980.239.3.F289. [DOI] [PubMed] [Google Scholar]
- 18.Devereux J, Haeberli P, Smithies O. Nucleic Acids Res. 1984;12:387–395. doi: 10.1093/nar/12.1part1.387. [DOI] [PMC free article] [PubMed] [Google Scholar]
- 19.Hughes M K, Hughes A L. Mol Biol Evol. 1993;10:1360–1369. doi: 10.1093/oxfordjournals.molbev.a040080. [DOI] [PubMed] [Google Scholar]
- 20.Schild L, Schneeberger E, Gautschi I, Firsov D. J Gen Physiol. 1997;109:15–26. doi: 10.1085/jgp.109.1.15. [DOI] [PMC free article] [PubMed] [Google Scholar]


