

Abstract
Objectives. Suffering from waning demand, poor quality, and reform efforts enabling veterans to “vote with their feet” and leave, the Veterans Health Administration (VA) health care system transformed itself through a series of substantive changes. We examined the evolution of primary care changes underlying VA’s transformation.
Methods. We used 3 national organizational surveys from 1993, 1996, and 1999 that measured primary care organization, staffing, management, and resource sufficiency to evaluate changes in VA primary care delivery.
Results. Only rudimentary primary care was in place in 1993. Primary care enrollment grew from 38% in 1993 to 45% in 1996, and to 95% in 1999 as VA adopted team structures and increased the assignment of patients to individual providers. Specialists initially staffed primary care until generalist physicians and nonphysican providers increased. Primary care-based quality improvement and authority expanded, and resource sufficiency (e.g., computers, space) grew. Provider notification of admissions and emergency department, urgent-care visit, and sub-specialty-consult results increased nearly 5 times.
Conclusions. Although VA’s quality transformation had many underlying causes, investment in primary care development may have served as an essential substrate for many VA quality gains.
At the heart of the Institute of Medicine’s report Crossing the Quality Chasm was the need to address the improvement of quality of care through major changes in how health care is organized.1 The Institute of Medicine’s central tenet was that only through significant, sustained, and innovative efforts to reorganize the health care system were substantive gains in quality of care and health outcomes possible. Launched in the mid-1990s, the Veterans Health Administration’s (VA’s) reorganization of care presaged the Institute of Medicine report by having already initiated significant internal restructuring of the care delivery system, including changes in delivery models (e.g., integrated networks, primary care teams), adoption of new technologies (e.g., electronic medical records), and implementation of new management strategies (e.g., reminders, guideline implementation, performance audit and feedback).2–8 In the aggregate, these organizational changes have been associated with significant gains in VA quality over time and in comparison to Medicare9 and have resulted in substantial media attention surrounding the VA’s potential to serve as a model health care system for the United States.10–13 Despite this organizational transformation, remarkably little is known about the discrete organizational characteristics in VA facilities that specifically contributed to these performance changes; that is, we are yet to empirically open the “black box.”
Prior to the reorganization, the VA health care system had been suffering from waning demand, perceptions of poor quality and customer service, and a threat from health care reform efforts as market research suggested that 3 out of 4 veterans would “vote with their feet” and leave if given a national health care card.14–16 This survival threat was a call to action. One of VA’s first actions was to commission an assessment of its staffing, management, and resources to determine how ready the VA health care system was for transformative change, which led to the establishment of an evidence-based policy to nationally adopt primary care as its foundation.17 VA’s subsequent policy changes and strategic plans comprised substantive changes in network restructuring, electronic charting, health care financing, and performance measurement, as well as augmentations to primary care delivery (e.g., increased access to nonphysician providers).3,4,18 These policy changes and the strategic plan provided added fuel and a roadmap. Although VA’s quality transformation has many underlying causes and outcomes, many of the gains may have had their early roots in VA’s investment in primary care development, a necessary substrate for organizational change. The notion that the VA’s transformation had its roots in primary care development is consistent with recommendations for improving quality through greater attention to internal structural changes in how primary care practice is organized and delivered.19
We report on the results of a series of highly unique data sources that span VA’s reorganization, which was launched in 1996 with Kizer’s Vision for Change and Journey for Change policy directive and implementation plan.20–22 We analyzed surveys from a predirective year (1993), through early reorganization (1996), and later reorganization (1999–2000), during which most of the early performance gains had been achieved.9 To date, these surveys have been used individually in cross-sectional snapshots to good effect; they have substantively informed our understanding of the environmental, organizational, and primary care practice structural features associated with quality of care in general.23–27 However, they have never been combined and examined crosssectionally over time to tell the story of VA as a public sector turnaround.
Capitalizing on these national organizational surveys conducted over the course of VA’s natural experiment, we provide the first quantitative evaluation of the detailed primary care organizational changes underlying VA’s quality transformation. Our overarching goal is to provide an empirical base for informing evidence-based management, practice, and policy, and to provide practical knowledge for use by other health care systems, organizations, and health plans.28
METHODS
Study Design and Samples
We evaluated organizational changes in VA primary care delivery using 3 cross-sectional national practice structure surveys administered to all medical directors and primary care chiefs before VA’s reorganization in 1993, during the early phases of reorganization in 1996, and in the later phases of reorganization in 1999.
Each survey wave was targeted to medical directors (i.e., chiefs of staff) or primary care directors of all VA medical centers (n = 168). By 1996, several VA medical centers had undergone facility integrations that combined VA medical centers into a single health care system (n = 160). By 1999, we applied a sampling criterion of 4000 or more outpatients and 20 000 or more outpatient visits to the census of VA facilities, which captured all VA medical centers from the previous 2 survey waves.
Data Sources and Collection
The original 1993 prereorganization survey was designed to assess VA’s readiness for managed care in the face of national health care reform efforts under the Clinton Administration, which in turn led to VA’s Primary Care Directive (in 1994), which mandated the development of VA primary care programs and placed emphasis on team-based care.17 The early reorganization survey (in 1996) was designed to evaluate VA’s response to the VA primary care directive. The later reorganization survey (in 1999–2000) was designed to assess the ongoing evolution of VA management strategies, uptake of managed care arrangements, and changes in relation to the previous survey waves.18
These organizational surveys were for key informants (i.e., knowledgeable individuals capable of reporting how particular facilities are structured, managed, and operated). We used tailored design methods to prepare and conduct all survey waves.29 We contacted each VA medical center to identify the name, title, and contact information for each key informant, and we express-mailed personalized surveys with prepaid express-mail return envelopes, in addition to endorsement letters from senior VA leadership and the research team. Because survey incentives are not feasible in government settings, we provided respondents with opportunities to get copies of survey results and related products. Announcements about the surveys were also made during national VA conference calls that were used by VA leaders to provide a regular forum for routine communication to the field.
Survey Development, Measures, and Validation
To develop each survey, we reviewed the existing published literature, used modified Delphi techniques derived from the RAND–University of California, Los Angeles, appropriateness panel methods to integrate expert opinion, and culled organizational measures from an array of existing survey tools.30,31 Content finalization was achieved through iterative review, priority setting, and pilot testing among sample respondents to ensure field-worthy instruments that minimized response burden while maximizing information yield and the reliability and validity of survey questions.
Because the adoption of primary care delivery was an innovation in VA in the early 1990s, we used a combination of diffusion theory32 and the Institute of Medicine’s guidance on desirable attributes of primary care33 as the conceptual framework for the development of measures. We mapped survey content across the 3 waves and identified common measures for use in making comparisons. Table 1 ▶ shows comparisons among the 1993–1996, 1993–1999, and 1996–1999 survey results, depending on retention of survey items and comparable response categories over time.
TABLE 1—
Survey Responses Regarding Changes in Veterans Health Administration (VA) Primary Care Delivery Over the Course of Its Reorganization: 1993–1999
| 1993 | 1996 | 1999 | |
| No. of VA medical centers | 163 | 160 | 160 |
| Primary care mission | |||
| Primary care implementation scale score, a mean (SD) | 5.7 (2.4) | 6.8 (2.0) | 8.0 (1.5) |
| Answered affirmatively to “Is a physician or team of physicians responsible for the overall health of each patient, including health promotion and disease prevention, management of acute and chronic medical conditions, and biopsychosocial problems (e.g., domestic violence, job performance impairment, depression)?”, % | 79.7 | 96.3 | 98.7 |
| Answer to “When fully implemented, does this primary care program expect to provide primary care to majority of veterans who receive care at your VA?”,b % | |||
| Definitely yes | 54.8 | 82.5 | |
| Probably yes | 25.0 | 13.8 | |
| Maybe | 7.1 | 0.6 | |
| Probably no | 11.9 | 2.5 | |
| Definitely no | 1.2 | 0.6 | |
| Percentage of unique patients in outpatient clinics obtaining most of their care through VA primary care clinic | |||
| All/Almost all (91–100%) | 13.9 | 14.5 | 61.6 |
| Most (61–90%) | 24.1 | 30.2 | 33.3 |
| About half (41–60%) | 19.0 | 27.7 | 4.4 |
| Some (21–40%) | 38.0 | 17.0 | 0.6 |
| A few (1–20%) | 5.1 | 5.7 | 0 |
| None (0%) | 0 | 1.9 | 0 |
| Don’t know/can’t estimate | 0 | 3.1 | 0 |
| Primary care reporting arrangement | |||
| Physicians, % | |||
| Service of origin | 41.5 | 20.8 | 12.2 |
| Primary care only | 6.1 | 20.8 | 55.4 |
| Both | 51.2 | 56.0 | 31.1 |
| Other | 1.2 | 2.5 | 1.4 |
| Registered nurses, % | |||
| Service of origin | 35.8 | 28.9 | 13.9 |
| Primary care only | 2.5 | 13.8 | 58.9 |
| Both | 60.5 | 55.3 | 25.6 |
| Other | 1.2 | 0.6 | 1.6 |
| Not applicable | . . . | 1.3 | . . . |
| Social workers, % | |||
| Service of origin | 59.5 | 40.3 | 23.5 |
| Primary care only | 1.3 | 6.9 | 44.5 |
| Both | 39.2 | 47.2 | 31.9 |
| Other | . . . | 0.6 | . . . |
| Not applicable | . . . | 5.0 | . . . |
| Physician assistants, % | |||
| Service of origin | 36.0 | 12.0 | 8.2 |
| Primary care only | 10.0 | 22.8 | 76.3 |
| Both | 54.0 | 32.9 | 14.4 |
| Other | . . . | 1.3 | 1.0 |
| Not applicable | 36.0 | 31.0 | . . . |
| Nurse practitioners, % | |||
| Service of origin | 26.1 | 19.0 | 13.4 |
| Primary care only | 8.7 | 17.7 | 66.4 |
| Both | 63.8 | 43.7 | 19.4 |
| Other | 1.4 | 0.6 | 0.7 |
| Not applicable | . . . | 19.0 | . . . |
| Primary care practice management | |||
| Frequency of formal primary care team meetings for patient care, % | |||
| More than once a week | 19.6 | 28.7 | 21.7 |
| About once a week | 41.3 | 34.7 | 19.6 |
| 2–3 times a month | 10.9 | 10.7 | 15.2 |
| About once a month | 21.7 | 17.3 | 23.2 |
| Less than once a month | 6.5 | 8.7 | 20.3 |
| Primary care providers promptly notified of hospital admissions, % | |||
| Always/almost always | 16.0 | 50.9 | 68.8 |
| Most of the time | 23.5 | 22.6 | 15.0 |
| Some of the time | 23.5 | 8.2 | 5.0 |
| Occasionally | 19.8 | 14.5 | 5.0 |
| Never | 12.3 | 3.1 | 6.2 |
| Not applicable/cannot estimate | 4.9 | 0.6 | 0 |
| Primary care providers promptly notified of long-term care admissions, % | |||
| Always/almost always | 12.5 | 27.2 | 41.5 |
| Most of the time | 13.8 | 18.4 | 9.5 |
| Some of the time | 21.3 | 10.8 | 12.9 |
| Occasionally | 27.5 | 22.2 | 13.6 |
| Never | 13.8 | 10.1 | 22.4 |
| Not applicable/cannot estimate | 11.3 | 11.4 | 0 |
| Primary care providers promptly notified of emergency department visits, % | |||
| Always/almost always | 2.5 | 15.7 | 17.2 |
| Most of the time | 16.3 | 24.5 | 17.9 |
| Some of the time | 21.3 | 22.6 | 18.5 |
| Occasionally | 30.0 | 24.5 | 15.9 |
| Never | 13.8 | 8.8 | 30.5 |
| Not applicable/cannot estimate | 6.3 | 3.8 | 0 |
| Primary care providers promptly notified of subspecialty consult results, % | |||
| Always/almost always | 3.7 | 14.5 | 12.1 |
| Most of the time | 29.6 | 27.0 | 23.6 |
| Some of the time | 19.8 | 20.8 | 28.0 |
| Occasionally | 34.6 | 25.2 | 18.5 |
| Never | 9.9 | 10.7 | 17.8 |
| Not applicable/cannot estimate | 2.5 | 1.9 | 0 |
| Primary care team coverage: inpatient care, % | |||
| Complete responsibility | 17.4 | 33.1 | 21.7 |
| Some responsibility | 21.7 | 29.8 | 13.2 |
| Little or no responsibility | 60.9 | 37.1 | 65.1 |
| Primary care team coverage: urgent care, % | |||
| Complete responsibility | 28.3 | 35.8 | 32.2 |
| Some responsibility | 60.9 | 58.9 | 50.6 |
| Little or no responsibility | 10.9 | 5.3 | 17.1 |
| Primary care team coverage: chronic care, % | |||
| Complete responsibility | 63.8 | 80.8 | 78.3 |
| Some responsibility | 34.0 | 17.2 | 12.5 |
| Little or no responsibility | 2.1 | 2.0 | 9.2 |
| Primary care team coverage: nursing home care, % | |||
| Complete responsibility | 4.3 | 10.1 | 5.3 |
| Some responsibility | 15.2 | 26.2 | 20.4 |
| Little or no responsibility | 80.4 | 62.4 | 74.3 |
| Primary care team coverage: emergent care, % | |||
| Complete responsibility | 13.3 | 14.6 | 10.5 |
| Some responsibility | 44.4 | 62.9 | 42.1 |
| Little or no responsibility | 42.2 | 22.5 | 47.4 |
| Primary care team coverage: patient phone calls requiring physician consultation, % | |||
| Complete responsibility | 48.9 | 60.3 | 53.3 |
| Some responsibility | 40.4 | 37.1 | 35.5 |
| Little or no responsibility | 10.6 | 2.6 | 11.2 |
| Primary care team coverage: team administration, % | |||
| Complete responsibility | 38.3 | 35.8 | 17.8 |
| Some responsibility | 55.3 | 55.0 | 55.3 |
| Little or no responsibility | 6.4 | 9.3 | 27.0 |
aIn this ordinal scale, 1 = start-up phase, 5 = mid-way, and 9 = fully implemented.
bThis is out of 84 medical centers with primary care programs for 1993, and out of all 160 medical centers for 1996 and 1999.
Many survey items focus on the presence or absence of specific structural features and clinical process-of-care actions. We conducted 2 types of validation checks. First, we conducted site visits at sites that were deemed exemplar on the basis of the quality of the type of primary care practice that their survey responses described (e.g., they had more organizing features in place). We used semi-structured interviews of medical center directors, chiefs of staff, primary care directors, frontline providers, and nurses to ascertain construct validity of key domains. Second, to examine content validity, we conducted random telephone follow-up among respondents from selected sites, conducted focused interviews, and carried out cognitive testing of individual items.
Statistical Analysis
We used univariate statistics to describe the characteristics of VA medical centers before the 1993 launch of VA’s formal reorganization and bivariate statistics (e.g., the t test for continuous and the χ2 test for ordinal or dichotomous variables) to examine incremental changes (e.g., 1993 to 1996 or 1996 to 1999).
RESULTS
National survey response rates for the 1993, 1996, and 1999 organizational surveys from VA medical centers’ were 97.6% (n = 163), 100% (n = 160), and 93.5% (n = 160), respectively.
Characteristics of Veterans Health Administration Medical Centers
In 1993, VA medical centers were roughly equally distributed across 4 regions: 27.4% Eastern, 25.6% Southern, 26.2% Central, and 20.7% Western. The majority were in large urban areas (37.4%) and small cities (35.0%), with the remainder in semirural (12.9%) and rural areas (14.7%).
Eighty percent of VA medical centers were academically affiliated, with their academic mission remaining unchanged through the reorganization. However, the mean number of internal medicine residents increased substantially from 19.4 (± 23.1) in 1993 to 30.6 (± 31.2) in 1996 and to 45.2 (± 41.5) by 1999 (P < .001). The duration of block rotations (i.e., the time residents spend in each clinical area before moving to the next one) in outpatient care increased, with fewer VA medical centers having less than 1-month blocks (37.3% in 1993 vs 26.6% in 1999) and more having blocks of 4 or more months (8.8% in 1993 vs 14.7% in 1999; P < .05). By 1996, 90 VA medical centers (70.3% of academically affiliated VA medical centers) had formal primary care training programs, which increased to 108 (87.8%) by 1999. These primary care training programs trained physician residents (95.6%), medical students (57.8%), and associated health care providers (83.3%).
Only three quarters of VA medical centers had implemented or begun to implement a distinct and separate general medicine program (n = 123, 75.5%) in 1993. Of these, three quarters (n = 98, 76.6% or 60.1% of all VA medical centers) had a general medicine program that was comprised of a physician or team of physicians responsible for the overall health of each patient, including health promotion and disease prevention, management of acute and chronic medical conditions, and biopsychosocial problems. Most of these types of general medicine programs operated separately from the subspecialty clinics, enabled patients to obtain routine outpatient visits (e.g., annual physical exams, routine care for diabetes and hypertension), and included general internal medicine or family medicine continuity of care providers (other than residents) with whom patients could schedule routine visits. Overall, in 1993, only two thirds of VA medical centers nationwide (n = 83, 67.4%) had all of these general medicine program characteristics; 23 VA medical centers (12.9%) reported that they did not plan to implement such a program. By 1996 and 1999, the vast majority of VA medical centers (96.2% and 98.1%) reported having general medicine physicians responsible for the overall health of their patients (P < .05 compared with the 1993 level).
In 1993, we asked about perceived barriers to initiating or implementing full general medicine and primary care programs. Adequate financial resources and sufficient space for programs’ clinics and activities were by far rated as the most likely obstacles (65.9% and 64.1% with scores of 4 or 5 for “strong negative effect” on a 5-point ordinal scale, respectively). Rated after these barriers was the ability to fill available general medicine positions by external recruitment or internal realignment, specifically for academic generalists (i.e., general internists and family medicine physicians; 35.3%), physicians in other specialties (31.7%), and non-academic generalists (25.7%). Support from existing subspecialist physicians was also of concern (27.0%).
Changes in the Primary Care Mission
Self-reported levels of primary care implementation from start-up (score of 1) to the fully implemented stage (score of 9) changed significantly over time, from 5.7 in 1993 to 6.8 in 1996 to 8.0 in 1999–2000 on average (Table 1 ▶). In 1993, 54.8% of VA’s said that primary care served the majority of veterans; this increased dramatically to 82.5% by 1996. The percentage of veterans who could obtain all or most of their care through primary care in a VA medical center changed dramatically, from 38% in 1993, to 44.7% by 1996, and 94.9% by 1999–2000 (P < .05).
Changes in Primary Care Staffing and Reporting Arrangements
General administrative staffing nearly doubled between 1993 and 1996 (0.57 ± 0.89 vs 0.93 ± 1.09; P<.05), and the level of administrative support (i.e., government service [GS] level of primary care–based administrative staff) increased. For example, between 1996 and 1999, 61.6% versus 86.9% of VA medical centers had integrated GS-level 9 or higher administrative support (P<.01) at the same time that more clerks and receptionists were incorporated into primary care practice (7.20 ± 5.70 vs 9.72 ± 6.91 fulltime equivalent employees; P<.05). Primary care–based physician staffing was initially achieved by shifting subspecialists (5:1, the ratio between 1996 and 1993) and psychiatrists (4:1) into primary care; infusions were later backtracked, as generalist physicians increased (Figure 1 ▶). Registered nurse and nurse practitioner staffing also increased 2–3 times, with modest physician assistant recruitment.
FIGURE 1—
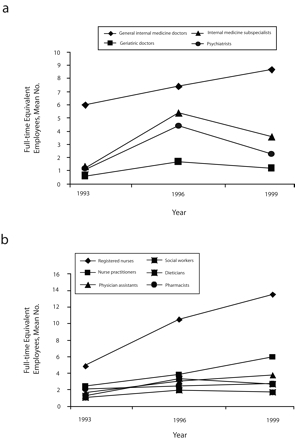
Changes in primary care staffing within the Veterans Health Administration among (a) physicians and (b) nonphysicians: 1993–1999.
Reporting arrangements also changed (Table 1 ▶). In 1993 and 1996, relatively few primary care providers and staff were reporting to the head of primary care. By 1999 however, the majority of primary care physicians, nurse practitioners, physician assistants, and nurses were aligned in their reporting to primary care rather than their services of origin (e.g., department of medicine for physicians, chief of nursing; all P < .001 between 1993–1999; Table 1 ▶). The reporting of social workers to primary care also increased, although most social workers still reported to social work service.
Changes in Primary Care Delivery and Practice Management
Primary care enrollment grew from 38% to 45% to 95%, during 1993, 1996, and 1999, respectively, as VA medical centers adopted primary care team structures (57% to 94% to 97%, respectively; P<.001 between 1993 and 1996) and increased the assignment of patients to individual primary care providers (from 42% to 53% to 81%, respectively; P<.01; Figure 2 ▶). The time primary care providers expected to retain responsibility of their assigned patients also increased: 78% of VA medical centers with general medicine programs in 1993 reported an indefinite time period for their patient relationships compared with 91% in 1999 (P<.05). The frequency of formal primary care team meetings for patient care increased significantly by 1996 but declined by 1999 (Table 1 ▶).
FIGURE 2—
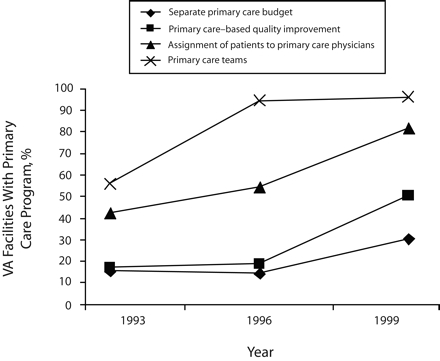
Changes in primary care delivery within the Veterans Health Administration: 1993–1999.
Primary care–based (as opposed to hospital-wide) quality improvement programs also expanded. Only 17.1% of the VA medical centers with general medicine programs in 1993 had a fully implemented primary care–based total quality improvement or continuous quality improvement program compared with 50.6% reporting fully implemented programs by 1999 (P < .01). By 1999, 38.0% reported only partially implemented programs and 11.4% reported having them planned or under consideration. The development of separate primary care budgets also increased, although to a lesser degree (15.6% in 1993 to 30.5% by 1999; Figure 2 ▶).
Prompt primary care provider notification (i.e., within 1–2 days) of their patients’ hospital admissions, nursing home admissions, emergency room visits, and subspecialty-consult results increased by nearly 5 times (Table 1 ▶). The greatest gains were in prompt notification of hospital admissions, followed by nursing home admissions.
Primary care team responsibilities grew over the course of the reorganization (Table 1 ▶). Primary care team coverage of their hospitalized patients initially grew in 1996 and then declined by 1999. For example, primary care teams had no responsibility for inpatient care in 60.9% of VA medical centers in 1993; 39.1% had some or total responsibility for in-patient care in addition to primary care delivery. By 1996, 62.9% of primary care teams had some or total responsibility, although this scaled back to 34.9% by 1999. Emergency and urgent care had similar although less pronounced patterns. Primary care team responsibility for chronic care management generally grew (63.8% to 78.3% with complete responsibility between 1993 and 1999). Responsibility for nursing home and emergency department care was more limited, although not absent. Coverage of patient telephone calls requiring physician consultation did not change appreciably, whereas team administration duties increased significantly in 1996 and were scaled back by 1999.
Changes in Primary Care Resources
Between 1993 and 1996, the sufficiency of primary care–based resources increased substantially (Figure 3 ▶). The percentage of VA medical centers reporting always to mostly sufficient administrative office space, examining rooms, and patient education space more than doubled, and the sufficiency of available workstations and personal computers quadrupled. Sufficiency of adequately equipped treatment rooms nearly doubled as well.
FIGURE 3—
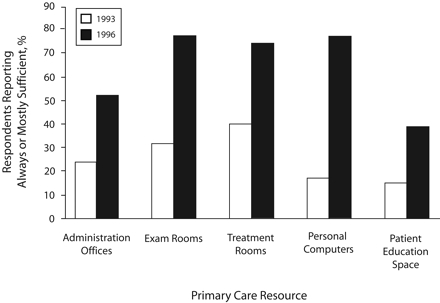
Percentage of survey respondents from Veterans Health Administration medical centers who reported primary care resource sufficiency: 1993 and 1996.
Note. Between 1993 and 1996, P < .01. Respondents answered “always or mostly sufficient” in surveys.
DISCUSSION
Changes Underlying the Veterans Health Administration’s Quality Transformation
Before VA’s ambitious reorganization plans were proposed, only rudimentary primary care programs (i.e., walk-in clinics) were in place and VA leaders were already grappling with concerns about their ability to further implement primary care given historical investments in hospital-based and specialty-focused care throughout the VA.34 Before the reorganization began, the VA was staffed with roughly 70% specialists and 30% generalists (comparable to other academic medical centers), which posed significant issues in generalist recruitment, retraining, and reallocation of specialists to primary care programs. With the subsequent publication of the primary care directive in 1994, VA medical centers were mandated to adopt primary care programs with limited guidelines on their implementation.
Within 2 short years of the directive, VA medical centers had accomplished nearly universal adoption of primary care teams (from 57% in 1993 to 94% in 1996) and substantially increased primary care–based physician staffing. Early subspecialist staffing of primary care appears to have been an interim measure until generalists could be recruited, which is demonstrated by the linear growth of general internal medicine physician staffing in primary care and declines in both internal medicine subspecialists and geriatricians delivering primary care by 1999. However, none returned to their prereorganization levels. The growth of primary care–based nurses increased 2 to 3 times and only continued to increase by 1999. A growing cadre of nurse practitioners was also evident by 1996, although nurse practitioners in particular were more commonly recruited in VA medical centers in which specialists predominated.35
Other structural changes took longer to evolve and appear to have been accelerated by the formal VA reorganization policy initiatives that gave incentives for further restructuring of care delivery and management. Primary care enrollment, for example, grew from 38% in 1993 to 45% in 1996 and then more than doubled to 95% by 1999. Patient assignment to individually identifiable primary care providers increased from 42% in 1993 to 53% in 1996 and then increased to 81% by 1999. Human resource changes also took more time, especially in terms of aligning staff to primary care rather than allowing them to remain under matrix management conditions (i.e., shared supervision across departments), a human resource strategy in vogue in the late 1980s and early 1990s.36,37 Previous VA research has demonstrated that such matrix management strategies had some unintended consequences, because relatively newly appointed primary care directors had little authority over their own staff (e.g., hospitals could pull nurses out of primary care without much warning).38 Primary care–based quality-improvement programs also expanded rapidly, which may be attributable to the focus on performance audit and feedback; many of the original VA performance measures were related to primary care delivery (e.g., colorectal cancer screening, flu shots).23
Many of these later changes likely benefited from VA’s investment in the implementation of electronic medical records.39 The development of electronic medical records in VA began well before its reorganization; the national Decentralized Hospital Computing Program was in place for documenting utilization, scheduling, and entering orders for more than 20 years.40 Several pilot information systems also served as precursors of today’s Computerized Patient Record System, all of which were jointly designed by teams of providers and informatics experts (i.e., none were “off-the-shelf” package programs).41,42 Given that the sufficiency of computer workstations for patient care quadrupled between 1993 and 1996, with 80% of VA medical centers reporting that the number of computers were always to mostly sufficient, our findings suggest that much of the learning curve among providers may have begun before reorganization. Similarly, the early 2- to 6-times increases in primary care notification of patients’ admissions, emergency department visits, and specialty-consult results corroborates the notion that early performance jumps9 may have been associated with documentation abilities within a larger context of primary care structural changes.
Limitations
A number of limitations in this work are worth noting. First, our analysis represented VA facilities as a series of cross-sections rather than capitalizing on their longitudinal nature (i.e., linking changes within facility and conducting more-sophisticated analyses of time trends). New research is underway that will do just that. Researchers are combining longitudinal survey measures and linking them to VA performance measures. They are also using latent variable analysis and structural equation modeling to explicitly examine the influence of area characteristics on the trajectory of change and degree of performance impact. By contrast, our study’s value is in describing the natural history of the nature of the organizational changes underlying VA’s transformation. The cross-sectional nature of these data precludes our ability to make causal inferences about the organizational attributes associated with particular gains in VA quality.
Given the breadth of system changes, it would be difficult to weigh the relative contributions of specific interventions in terms of what activities ultimately were responsible for VA’s far-reaching improvements. Also, our organizational measures were based on self-report, which leads to potentially socially desirable responses. However, subsequent structure-process and structure-outcome models demonstrate the validity of our measures as strong predictors of performance.23–26 Use of multiple respondents per facility would also have increased our precision.
Finally, we draw upon what are now historical data from 1993, 1996, and 1999; as such, they are somewhat dated. They are, however, directly mapped to the principal years attributed to VA’s quality transformation9 and have the benefit of having been collected prospectively (vs contemporary surveys recalling reorganization activities). Data are now being collected to evaluate changes 10 years after the VA put their reorganization into motion.
Conclusions
The transformation of the VA health care system offers an array of organizational strategies that may inform US health care reform.10–13 Studies that compare VA care quality with that of private sector care have spurred hopes that VA may represent a model delivery system for the United States.9,43–48 Current health care reform efforts, by contrast, commonly favor economic solutions over changing organizational frameworks for improving quality and population health.49 We speculate that fundamental changes in how primary care was organized (e.g., improved continuity of doctor–patient relationships, use of primary care to train future providers, use of biopsychosocial models to improve patient health) may have served as an essential base for VA’s policy and practice initiatives and thus warrant greater attention in other public and private health care sectors. These facets of primary care are not unique to VA settings but instead represent the Institute of Medicine’s priorities for primary care provision and system redesign.1,29
Despite these advances, the VA health care system has continued to face challenges. VA has seen unprecedented growth in patient enrollment; more than 5.3 million people were served in 2005 (up from 4.1 million in 2001) in more than 1200 sites of care.50,51 This growth has raised concerns about VA’s ability to continue to care for the poor and underserved.52 With veterans returning from the wars in Iraq and Afghanistan, the VA has also faced special challenges in meeting these veterans’ health care needs, especially in terms of polytrauma, traumatic brain injury, and posttraumatic stress disorder. Following troubling stories of problems in the US military health care system (i.e., Walter Reed, which has separate leadership, funding, and oversight from the VA), media attention has also focused on substandard conditions in VA buildings.53–55 Furthermore, with the aging of VA primary care policies and competing demands, VA must continually evolve to meet these new challenges. We recommend that future initiatives continually monitor the health of primary care practice as a strategy for ensuring that the organizational foundation for ongoing quality improvement efforts is solid. In all, there is still a great deal of work ahead for the VA health care system despite its remarkable accomplishments to date. The ability of the VA to continually improve under these shifting conditions will contribute to its potential utility and credibility as a national model for health care reform.
Acknowledgments
This work was funded by the Veterans Health Administration (VA) Greater Los Angeles Health Services Research and Development (HSR&D) Center of Excellence (project HFP 94–028), VA Central Office, and by VA HSR&D Service (project MPC97–012).
We gratefully acknowledge the survey development, administration, follow-up work, and field preparation and sample-development support from Ismelda Canelo, MPA, MingMing Wang, MPH, and Alissa Simon, MA, all of the VA Greater Los Angeles HSR&D Center of Excellence.
Note. The views expressed in this article are those of the authors and do not necessarily represent the views of the Department of Veterans Affairs.
Peer Reviewed
Contributors E. M. Yano originated and drafted the article; oversaw the design, administration, and analysis of the 1996 and 1999 survey waves; developed the comparative tables and figures by combining data years; and made iterative revisions to and finalized the article. B. F. Simon was instrumental in the design, content, and conduct of all 3 organizational survey waves. A. B. Lanto was the lead statistician and programmer for all 3 survey waves. L. V. Rubenstein was the chief architect of the 1993 survey wave (with B. F. Simon), participated in survey design and content on the 1996 and 1999 survey waves.
Human Participant Protection The studies were reviewed by the Veterans Health Administration Greater Los Angeles Healthcare System’s institutional review board and found to be exempt.
References
- 1.Institute of Medicine. Crossing the Quality Chasm. Washington DC: National Academy Press; 2004.
- 2.Gillies RR, Shortell SM, Young GJ. Best practices in managing organized delivery systems. Hosp Health Serv Adm. 1997;42:299–321. [PubMed] [Google Scholar]
- 3.Kizer KW. The “new VA”: a national laboratory for health care quality management. Am J Med Qual. 1999;14:3–20. [DOI] [PubMed] [Google Scholar]
- 4.Kizer KW, Pane GA. The “new VA”: Delivering health care value through integrated service networks. Ann Emerg Med. 1997;30:804–807. [DOI] [PubMed] [Google Scholar]
- 5.Ogden JE, Muniz A, Patterson AA, Ramirez DJ, Kizer KW. Pharmaceutical services in the Department of Veterans Affairs. Am J Health Syst Pharm. 1997;54:761–765. [DOI] [PubMed] [Google Scholar]
- 6.Kizer KW, Fonseca ML, Long LM. The Veterans healthcare system: Preparing for the 21st century. Hosp Health Serv Admin. 1997;42:283–298. [PubMed] [Google Scholar]
- 7.Sprague L. Veterans’ health care: Balancing resources and responsibilities. Washington DC: George Washington University; 2004. National Health Policy Forum Issue Brief #796. [PubMed]
- 8.Young GJ, Charns MP, Barbour GL. Quality improvement in the US Veterans Health Administration. Int J Qual Health Care. 1997;9:183–188. [DOI] [PubMed] [Google Scholar]
- 9.Jha AK, Perlin JB, Kizer KW, Dudley RA. Effect of the transformation of the Veterans Affairs health care system on the quality of care. N Engl J Med. 2003; 348:2218–2227. [DOI] [PubMed] [Google Scholar]
- 10.Waller D. How VA hospitals became the best. TIME. September 4, 2006;36–37. [PubMed]
- 11.Stires D. How the VA healed itself. Fortune. May 15, 2006:130–136. [PubMed]
- 12.Longman P. The best care anywhere. Washington Monthly. January/February 2005. Available at: http://www.washingtonmonthly.com/features/2005/0501.longman.html. Accessed May 30, 2007.
- 13.Gearon C. Military might: today’s VA hospitals are models of top-notch care. U.S. World News Report. July 18, 2005:100–106.
- 14.Iglehart JK. The Veterans Administration medical care system faces an uncertain future. N Engl J Med. 1985;313(18):1168–1172. [DOI] [PubMed] [Google Scholar]
- 15.Oliver A. The Veterans Health Administration: an American success story? Milbank Q. 2007;85:5–35. [DOI] [PMC free article] [PubMed] [Google Scholar]
- 16.Perlin JB, Kolodner RM, Roswell RH. The Veterans Health Administration: quality, value, accountability, and information as transforming strategies for patient-centered care. Am J Manag Care. 2004;10(11 Pt 2):828–836. [PubMed] [Google Scholar]
- 17.Veterans Health Administration. Guideline for the implementation of primary care in the VHA (Directive 10–94-100). Washington DC, US Department of Veterans Affairs; 1994.
- 18.Yano EM. Managed care performance of VHA primary care delivery systems. Final Report. Washington DC: Veterans Health Administration Health Services Research and Development; 2000.
- 19.Burstin H, and Clancy CM. Primary care experience: Crossing the chasm between theory and practice. J Gen Intern Med. 2004;19:1064–1065. [DOI] [PMC free article] [PubMed] [Google Scholar]
- 20.Kizer K. Vision for Change: A Plan to Restructure the Veterans Health Administration. Washington DC: Department of Veterans Affairs; 1995.
- 21.Kizer K, Pane G. Journey for Change. Washington, DC: Department of Veterans Affairs; 1997.
- 22.Kizer K. The “new VA”: a national laboratory for health care quality management. Am J Med Qual. 1999;14:3–10. [DOI] [PubMed] [Google Scholar]
- 23.Yano EM, Soban SM, Parkerton PH, Etzioni DA. Does primary care practice organization influence colorectal cancer screening performance? Health Serv Res. 2007;48:1130–1149. [DOI] [PMC free article] [PubMed] [Google Scholar]
- 24.Jackson GL, Yano EM, Edelman D, et al. Veterans Affairs primary care organizational characteristics associated with better diabetes control. Am J Manage Care. 2005;11:225–237. [PubMed] [Google Scholar]
- 25.Soban LM, Yano EM. The impact of primary care resources on prevention practices. J Ambul Care Manage. 2005;28:241–253. [DOI] [PubMed] [Google Scholar]
- 26.Goldzweig CL, Parkerton PH, Washington DL, Lanto AB, Yano EM. Primary care practice and facility quality orientation: influence on breast and cervical cancer screening rates. Am J Manage Care. 2004;10:265–272. [PubMed] [Google Scholar]
- 27.Weeks WB, Yano EM, Rubenstein LV. Primary care practice management in rural and urban Veterans Health Administration settings. J Rural Health. 2002; 18:298–303. [DOI] [PubMed] [Google Scholar]
- 28.Shortell SM. Increasing value: a research agenda for addressing the managerial and organizational challenges facing health care delivery in the United States. Med Care Res Rev. 2004;61(suppl 3):12S–30S. [DOI] [PubMed] [Google Scholar]
- 29.Dillman D. Mail and Internet Surveys: The Tailored Design Method. 2nd ed. New York, NY: John Wiley & Sons, Inc; 2000.
- 30.Yano EM, Fink A, Hirsch SH, Robbins AS, Ruben-stein LV. Helping practices reach primary care goals: lessons from the literature. Arch Intern Med. 1995;155:1146–1156. [PubMed] [Google Scholar]
- 31.Allen J, Dyas J, Jones M. Building consensus in health care: a guide to using the nominal group technique. Brit J Community Nursing. 2004;9:110–114. [DOI] [PubMed] [Google Scholar]
- 32.Rogers EM. Diffusion of innovation. New York, NY: The Free Press; 1995.
- 33.Donaldson MS, Yordy KD, Lohr KN, and Vandselow NA, eds. Primary Care: America’s Health in a New Era. Washington DC: Institute of Medicine, National Academy Press; 1996. [PubMed]
- 34.Robbins AS, Guze PA, eds. Proceedings from the Conference on Ambulatory Care and Education; July 14–16, 1988, Los Angeles, Calif. Acad Med. 1989; 64(10):S1–S67. [PubMed] [Google Scholar]
- 35.Huang PY, Yano EM, Lee ML, Chang B, Rubenstein LV. Determinants of variations in nurse practitioner use in VA primary care practices. Health Serv Res. 2004;39:887–904. [DOI] [PMC free article] [PubMed] [Google Scholar]
- 36.Burns LR, Wholey DR. Adoption and abandonment of matrix management programs: effects of organizational characteristics and interorganizational networks. Acad Manage J. 1993;36(1):106–138. [PubMed] [Google Scholar]
- 37.Burns LR. Matrix management in hospitals: testing theories of matrix structure and development. Adm Sci Q. 1989;34(3):349–368. [PubMed] [Google Scholar]
- 38.Rubenstein LV, Lammers J, Yano EM, Tabarrah M, Robbins AS. Evaluation of VA institutional reorganization toward primary and ambulatory care: Part II: A study of organizational stresses and dynamics. Acad Med. 1996;71:784–792. [DOI] [PubMed] [Google Scholar]
- 39.Evans DC, Nichol P, Perlin JB. Effect of the implementation of an enterprise-wide electronic health record on productivity in the Veterans Health Administration. Health Econ Pol Law. 2006;1:163–169. [DOI] [PubMed] [Google Scholar]
- 40.Kupersmith J, Francis J, Kerr E, et al. Advancing evidence-based care for diabetes: lessons from the Veterans Health Administration. Health Aff (Millwood). 2007;26(2):w156–w168. [DOI] [PubMed] [Google Scholar]
- 41.Smith CS. The impact of an ambulatory firm system on quality and continuity of care. Med Care. 1995; 33:221–226. [DOI] [PubMed] [Google Scholar]
- 42.Cope DW, Sherman SE, Robbins AS. Restructuring VA ambulatory care and medical education: the PACE model of primary care. Acad Med. 1996;71:761–771. [DOI] [PubMed] [Google Scholar]
- 43.Asch SM, McGlynn EA, Hogan MM, et al. Comparison of quality of care for patients in the Veterans Health Administration and patients in a national sample. Ann Intern Med. 2004;141:938–945. [DOI] [PubMed] [Google Scholar]
- 44.Kerr EA, Gerzoff RB, Krein SL, et al. Diabetes care quality in the Veterans Affairs health care system and commercial managed care: the TRIAD study. Ann Intern Med. 2004;141:272–281. [DOI] [PubMed] [Google Scholar]
- 45.Asch SM, Kerr EA, Keesey J, et al. Who is at greatest risk for receiving poor-quality health care? N Engl J Med. 2006;354:1147–1156. [DOI] [PubMed] [Google Scholar]
- 46.Haugh R. Reinventing the VA. Civilian providers find valuable lessons in a once-maligned health care system. Hosp Health Netw. 2003;77(12):50–52, 55. [PubMed] [Google Scholar]
- 47.Yaisawarng S, Burgess JF. Performance-based budgeting in the public sector: an illustration from the VA health care system. Health Econ. 2006;15:295–310. [DOI] [PubMed] [Google Scholar]
- 48.Anderson M. Lessons learned from the Veterans Health Administration. Healthc Pap. 2005;5:30–37. [DOI] [PubMed] [Google Scholar]
- 49.Fuchs VR, Emanuel EJ. Health care reform: why? what? when? Health Aff (Millwood). 2005;24:1399–1414. [DOI] [PubMed] [Google Scholar]
- 50.Fong T. An army of patients. The VA struggles with a growing population of veterans using its health-care system as it works to boost quality and capacity. Mod Healthc. 2003;33(20):48–50, 62. [PubMed] [Google Scholar]
- 51.US Department of Veterans Affairs. Fact Sheet: Facts about the Department of Veterans Affairs. Washington DC: Office of Public Affairs; 2006. Available at: http://wwwl.va.gov/opa.fact/vafacts.asp. Accessed September 14, 2007.
- 52.Hughes JS. Can the Veterans Affairs health care system continue to care for the poor and vulnerable? J Ambul Care Manage. 2003;26:344–348. [DOI] [PubMed] [Google Scholar]
- 53.Tyson AS. Substandard conditions at VA centers noted. Washington Post. March 22, 2007. Available at: http://www.washingtonpost.com/wp-dyn/content/article/2007/03/21/AR2007032102583.html. Accessed May 30, 2007.
- 54.Priest D, Hull A. Soldiers face neglect, frustration at Army’s top medical facility. Washington Post. February 18, 2007. Available at: http://www.washington-post.com/wp-dyn/content/article/2007/02/17/AR2007021701172_pf.html. Accessed May 30, 2007.
- 55.Yancey D. Fighting Walter Reed after fighting the war. Washington Post. April 8, 2007. Available at: http://www.washingtonpost.com/wp-dyn/content/article/2007/04/06/AR2007040601788.html. Accessed May 30, 2007.