

Abstract
Objectives. Influenza and pneumococcal vaccinations reduce morbidity, mortality, and health care costs, but their use lags behind goals set by public health experts. We evaluated the effect of a performance measurement program instituted by the Veterans Health Administration in 1995 to improve vaccination rates.
Methods. We used cross-sectional chart-abstracted data to calculate influenza and pneumococcal vaccination rates among eligible patients, and administrative data to calculate pneumonia admission rates. We compared vaccination and hospitalization rates before and after the institution of the performance measurement program with rates outside the Veterans Health Administration.
Results. Influenza and pneumococcal vaccination rates for eligible patients rose from 27% and 28% during 1994 to 1995 to 70% and 85%, respectively, by 2003 (P for trend<.001). Geographic and other variations were substantially reduced. During this time, pneumonia hospitalization rates decreased by 50% among elderly Veterans Health Administration enrollees but increased among Medicare enrollees by 15% (P for differences in trend<.001).
Conclusions. The performance measurement program was associated with increases in vaccination rates, reduced variation, and reduced pneumonia admissions. Health systems instituting similarly effective programs may substantially improve the quality of their clinical health care.
Influenza and pneumococcal infections are important causes of morbidity and mortality among the elderly, representing the fifth most common cause of death among persons 65 years or older.1 In the United States, nearly 500 000 cases of pneumonia each year are thought to result from pneumococcus alone. This organism is responsible for nearly 50 000 cases of sepsis, 3000 cases of meningitis, and nearly 40000 deaths annually.1
Vaccines can prevent many of the complications of pneumococcal and influenza infections. Current pneumococcal vaccines have an overall efficacy against invasive pneumococcal disease in immunocompetent, elderly hosts of 75%.2 The effectiveness of influenza vaccines varies annually but is clearly associated with decreased days of illness and hospitalizations.3 In their prospective study of Swedish elderly persons, Christenson et al. found a 57% reduction in all-cause mortality among those vaccinated with the pneumococcal vaccine when compared with unvaccinated elderly persons.4 Nichol et al.5 found that influenza vaccination was associated with halving the rate of hospitalization for influenza or pneumonia and saving the health care system $117 annually for each vaccine administered.6
Despite their proven efficacy and cost savings, these vaccines are underused in the United States. According to the most recent survey of elderly Americans, only 58.5% of noninstitutionalized adults aged 65 years or older received an influenza vaccine in the past year; 56.2% have ever received a pneumococcal vaccine.7 These levels are well below the Healthy People 2010 goal of a 90% vaccination rate.8
In 1995, the Veterans Health Administration (VHA), part of the Department of Veterans Affairs, the largest integrated health care system in the United States, undertook a comprehensive effort to improve the quality of care provided to veterans. One of the primary strategies for improving quality of care was the adoption of performance measures and accountability standards. Performance measures for rates of preventive services, including immunizations, were developed, and the leaders of each newly developed regional network were held accountable through financial and nonfinancial incentives. VHA hospitals and clinics implemented a variety of strategies to improve their vaccination rates to meet these performance targets, including the use of clinical reminders and the dedication of a portion of the nursing staff to immunizations.
Although the performance measurement program had a significant effect on the quality of care provided to veterans,9 important questions remain. Elucidating these issues would improve our understanding of the value of these improvements. Therefore, we sought to answer the following questions: did improvements occur throughout this large health care system, including in different regions, at different types of hospitals and clinics, and among different patient populations? Did increases in vaccinations lead to improved patient outcomes by decreasing hospitalizations for pneumonia?
METHODS
Study Design
We used data from the External Peer Review Program (EPRP), an independently contracted program, for abstraction of clinical records to assess the quality of inpatient and outpatient care in VHA. We used data from 1994 to 1995, just before the implementation of the VHA performance measures program (which occurred during 1995 and 1996), to assess baseline vaccination rates. We used annual samples of EPRP data from 1997 to 2003 to assess trends in vaccination after the performance measures were instituted.
EPRP data are cross-sectional samples taken continuously. The first samples were of patient visits to VHA clinics during fiscal year 1995. No data were collected on patient visits during 1996, but data were obtained for each subsequent year. Trained reviewers abstracted the charts. Between 1995 and 2000, patients with at least 3 visits in the previous 12 months were eligible for sampling. Between 2001 and 2003, any patient with 1 visit in the past 12 months became eligible for sampling. Of those meeting the criteria, a random sample of all patients, as well as random samples of patients with chronic diseases of interest (hypertension, diabetes, congestive heart failure, ischemic heart disease, and chronic obstructive pulmonary disease), were drawn. Women make up a growing portion of VHA users, and measuring quality of care in this population is a high priority; therefore, the EPRP oversampled female veterans. Visits related to employee health were not included in the sampling frame.
Eligibility for vaccinations was determined by criteria developed by the Centers for Disease Control and Prevention’s Advisory Committee on Immunization Practices.1,10 These criteria included being 65 years or older or being at increased risk because of immunosuppressive chronic disease. The list of conditions that defined patients as immunocompromised or high risk differed for pneumococcal vaccination and influenza vaccination (criteria are available as a supplement to the online version of this article at http://www.ajph.org).
Measures
The 2 primary outcome variables were patient receipt or nonreceipt of influenza vaccination and receipt or nonreceipt of pneumococcal vaccination. We considered any patient with medical documentation indicating receipt of a vaccination at any VHA facility to have been vaccinated. Several hospital characteristics were evaluated with methods described elsewhere.11 A hospital was designated as urban if it was in a metropolitan area with a population of 1 million persons or more. Hospitals were assigned to a geographic region by dividing the country into the 4 census regions.12 Given that the number of resident physicians (house staff) who work in a hospital is a primary determinant of being designated an academic hospital, we ranked all VHA hospitals by the number of house staff. A hospital was categorized as academic if it was in the top half of this ranking.
We compared rates of vaccinations within VHA with those reported by the Behavioral Risk Factor Surveillance System (BRFSS).13 The BRFSS, a national telephone survey of community-dwelling adults, is conducted annually to collect a variety of health care information. The BRFSS collects information on the vaccination rates for adults 65 years or older regardless of other risk factors.
To assess the effect of immunization on patient outcomes, we examined rates of hospital admissions for pneumonia in VHA hospitals from 1992 through 2001. The Patient Treatment File, a database of all admissions to VHA hospitals, was used to identify patients discharged with pneumonia as their primary diagnosis (diagnosis-related group codes 89–90). We calculated pneumonia hospitalization rates by dividing the number of discharges of pneumonia patients among veterans 65 years or older by the total number of veterans in that age group who used VHA services. Because some data suggest that overall VHA hospitalization rates decreased, we examined rates of 2 other common conditions: acute myocardial infarction (International Classification of Diseases, Ninth Revision [ICD-9] code 410.xx14) and gastrointestinal hemorrhage (ICD-9 codes 456.0, 531.0, 533.0, 535.31, 562.12, 569.85, and 578.0). National, non-VHA rates of pneumonia were calculated by using the same ICD-9 codes for the elderly population from the National Hospital Discharge Survey, a nationally representative database released annually by the National Center for Health Statistics.15
Statistical Methods
We determined the proportion (with 95% confidence interval [CI]) of patients eligible for vaccination and who were actually vaccinated for each year. Because vaccination rates between different sampling cohorts were similar within each year, these data were combined to create an aggregate vaccination rate for each fiscal year, which began on October 1 of each year.
We used the Student t test and χ2 test where applicable to compare characteristics of patients who received vaccinations with those who did not. To assess changes in vaccinations within subgroups, we used a χ2 test for trends to observe whether improvements occurred.
Finally, we assessed whether temporal trends in vaccinations in VHA differed from those in vaccinations in the BRFSS by including time by group (VHA vs BRFSS) in multivariable models. We used similar techniques to assess differences in temporal trends in admission rates, with VHA pneumonia admissions as the reference group and VHA acute myocardial infarction, VHA gastrointestinal hemorrhage, and Medicare pneumonia rates as the comparison groups.
P values less than .05 (2 sided) were considered to be statistically significant. We performed all analyses with SAS version 8.0 (SAS Institute, Cary, NC) or Stata version 7.0 (Stata Corp, College Station, Tex).
RESULTS
Patients in the 5 EPRP samples we chose to report, from fiscal years 1995, 1997, 1999, 2001, and 2003, were similar in sociodemographic characteristics (Table 1 ▶). They were predominantly older men from nonurban settings, divided evenly among the regions of the country. During the baseline year of 1995, among patients eligible for the influenza vaccine who were sampled, 27.4% (95% CI = 25.2%, 29.1%) received vaccination. During the same baseline period, approximately one fourth (26.3%, 95% CI = 24.1%, 28.3%) of sampled patients eligible for the pneumococcal vaccine were vaccinated. The next sample, from 1997, after the introduction of the performance contract (fiscal year 1997), showed an increase in influenza and pneumococcal vaccination rates to 60.3% (Table 2 ▶). By fiscal year 1999, 75.1% (95% CI = 74.8%, 75.5%) of sampled patients eligible for influenza vaccination received the vaccine. Similarly, among those eligible for a pneumococcal vaccine, 76.8% (95% CI = 76.6%, 77.0%) received the vaccine. In 2001, although the percentage of patients who received a pneumococcal vaccine rose slightly to 79.4%, the rate of influenza vaccination dropped to 68.0% (Table 2 ▶).
TABLE 1—
Characteristics of Veterans Health Administration Patients Sampled for Either Pneumococcal or Influenza Vaccinations: Fiscal Years 1995, 1997, 1999, 2001, and 2003
| 1995 | 1997 | 1999 | 2001 | 2003 | |
| Sample, No. | 45 502 | 34 182 | 44 867 | 74 250 | 33 504 |
| Patient characteristics | |||||
| Age, y, Mean ± SD | 68.6 ± 11.5 | 68.6 ± 10.0 | 67.6 ± 10.7 | 68.2 ± 11.1 | 69.8 ± 10.9 |
| Immunocompromised or high risk,a No. (%) | 10 684 (23.5) | 8 311 (24.4) | 13 745 (30.9) | 22 584 (37.2) | 10 876 (30.4) |
| Hospital characteristics | |||||
| Region, No. (%) | |||||
| Northeast | 10 207 (24.1) | 7 364 (23.3) | 8 939 (20.1) | 18 139 (24.4) | 8 285 (23.2) |
| South | 13 562 (32.0) | 10 011 (30.8) | 14 276 (32.1) | 24 452 (32.9) | 12 581 (35.2) |
| Midwest | 10 807 (25.5) | 8 405 (25.9) | 11 890 (26.7) | 19 089 (25.7) | 8 922 (25.0) |
| West | 7 766 (18.3) | 6 717 (20.7) | 9 377 (21.1) | 12 570 (16.9) | 5 936 (16.6) |
| Urban hospital, No. (%) | 13 286 (31.4) | 10 625 (32.7) | 15 510 (34.9) | 23 760 (32.0) | 11 253 (32.9) |
| Academic hospital,b No. (%) | 18 811 (44.4) | 15 113 (46.5) | 21 865 (49.2) | 32 819 (44.5) | 16 261 (45.5) |
aImmunocompromised or high-risk patients include those with chronic cardiovascular disease, pulmonary disease, diabetes mellitus, alcoholism, chronic liver disease, or other forms of documented immunocompromised state, including HIV infection and hematologic malignancies (criteria available as a supplement to the online version of this article at http://www.ajph.org).
bAll hospitals were ranked by the number of house staff and designated as academic if they were in the top half of this ranking.
TABLE 2—
Unadjusted Influenza and Pneumococcal Vaccination Rates, by Veterans Health Administration Patient and Hospital Characteristics: Fiscal Years 1995, 1997, 1999, 2001, and 2003
| 1995 | 1997 | 1999 | 2001 | 2003 | |||||||
| Influenza | Pneumococcal | Influenza | Pneumococcal | Influenza | Pneumococcal | Influenza | Pneumococcal | Influenza | Pneumococcal | P (Trend) | |
| Patient characteristics | |||||||||||
| No. eligible | 42 717 | 45 502 | 31 667 | 34 128 | 39 102 | 41 524 | 44 673 | 74 250 | 24 868 | 33 504 | |
| No. (%) vaccinated | 11 980 | 11 980 | 19 100 | 20 592 | 29 377 | 31 906 | 30 369 | 58 948 | 17 399 | 28 318 | < .001 |
| (28.0) | (26.3) | (60.3) | (60.3) | (75.1) | (76.8) | (68.0) | (79.4) | (70.0) | (84.5) | ||
| Vaccination rate by eligibility, % | |||||||||||
| Immunocompromised or high riska | 25 | 21 | 52 | 47 | 68 | 63 | 58 | 66 | 58 | 71 | < .001 |
| Elderly (aged ≥65 years) | 29 | 29 | 62 | 65 | 78 | 83 | 73 | 85 | 76 | 89 | < .001 |
| Hospital characteristics | |||||||||||
| Vaccination rate by region, % | |||||||||||
| Northeast | 30 | 27 | 60 | 58 | 74 | 75 | 70 | 79 | 74 | 87 | < .001 |
| South | 23 | 20 | 60 | 56 | 75 | 76 | 65 | 77 | 66 | 82 | < .001 |
| Midwest | 30 | 33 | 62 | 69 | 76 | 81 | 69 | 81 | 71 | 86 | < .001 |
| West | 32 | 31 | 59 | 60 | 75 | 74 | 70 | 80 | 71 | 85 | < .001 |
| Vaccination rate by academic character of hospital,b % | |||||||||||
| Academic | 27 | 28 | 57 | 57 | 72 | 73 | 67 | 79 | 69 | 84 | < .001 |
| Not academic | 29 | 25 | 63 | 59 | 77 | 79 | 70 | 80 | 72 | 86 | < .001 |
| Vaccination rate by hospital location, % | |||||||||||
| Urban | 27 | 27 | 54 | 54 | 71 | 70 | 68 | 78 | 67 | 84 | < .001 |
| Nonurban | 29 | 27 | 64 | 64 | 77 | 81 | 68 | 81 | 74 | 86 | < .001 |
aImmunocompromised or high-risk patients vary between pneumococcal and influenza vaccination (criteria available as a supplement to the online version of this article at http://www.ajph.org).
bAll hospitals were ranked by the number of house staff and designated as academic if they were in the top half of this ranking.
Although there were substantial regional differences in rates of vaccinations in 1995 (Table 2 ▶), these variations narrowed by 1999. Further, we found that rates increased across many subgroups, including patients in both academic and nonacademic centers and urban and nonurban locations, as well as across indicators such as being elderly versus being nonelderly immunocompromised persons (Table 2 ▶). However, despite these increases, some disparities in vaccination rates, especially between elderly persons and nonelderly immunocompromised patients, remained.
Compared with the rates reported for community dwellers outside VHA by the BRFSS, VHA’s rates were initially below this national benchmark (Figure 1 ▶). For example, only 28% of eligible veterans were immunized against influenza in 1995, but the BRFSS survey found that nearly 60% of elderly Americans had received the influenza vaccine. By 1999, VHA enrollees were much more likely to have been vaccinated for both influenza and pneumococcus than were community dwellers outside VHA. A statistical comparison of trends in vaccinations in VHA with those in BRFSS illustrated that they were meaningfully different (P< .001; Figure 1 ▶).
FIGURE 1—
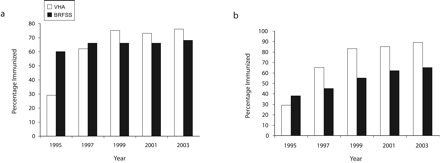
Veterans Health Administration (VHA) and Behavioral Risk Factor Surveillance System (BRFSS) rates of vaccination among persons 65 years and older for (a) influenza and (b) pneumococcus: 1995–2003.
We examined temporal trends in pneumonia discharges within VHA and found that in the early 1990s, rates of pneumonia discharges were relatively stable. Starting in 1996, there were approximately 10% to 20% annual drops in the rates of patients being hospitalized with a primary diagnosis of pneumonia, a trend that continued through 2001 (Figure 2 ▶). In 1995, VHA’s rate of pneumonia for elderly veterans was 10.4 per 1000 enrollees. By 2001, the rate had dropped to 5.2 per 1000 enrollees. Admissions for the other medical conditions examined, acute myocardial infarction and gastrointestinal hemorrhage, also dropped in VHA during this time, but by less than the drop in pneumonia admission rates. For example, between 1995 and 2000, in the VHA health care system, admissions of elderly patients with pneumonia fell by 46%, acute myocardial infarction admissions fell by 32%, and admissions for gastrointestinal hemorrhage fell by 22%. National Medicare pneumonia admission rates rose 15% during the same period, from a baseline of 20.5 admissions per 1000 in 1995 to 23.1 admissions per 1000 in 2000. In multivariable models, we found that trends for admission rates for pneumonia discharges among Medicare patients were statistically different than the trend for pneumonia discharges in VHA (for each comparison, P< .001). We found similar differences within VHA between discharge rates for nonpneumonia conditions and pneumonia. If VHA’s hospitalizations had risen by the same rate as that of Medicare between 1995 and 2000, VHA’s pneumonia hospitalization rate would have been 11.8 per 1000 enrollees, resulting in approximately 10461 more pneumonia hospitalizations in 2000 alone.
FIGURE 2—
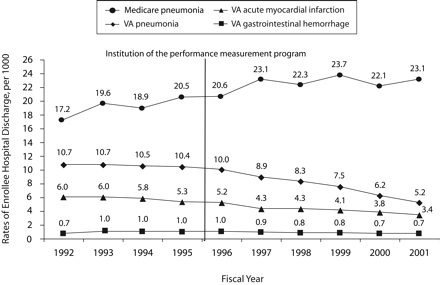
Annual rate (per 1000) of inpatient discharges after treatment for common medical conditions from Veterans Health Administration (VHA) and non-VHA hospitals: Behavioral Risk Factor Surveillance System,1992–2001.
DISCUSSION
The institution of performance measurement was associated with a substantial increase in VHA’s nationwide vaccination rates. Although VHA’s rates were initially below the national average for community dwellers, by the end of the study period, both the influenza and the pneumococcal vaccination rates in VHA settings were well above those reported in other settings. Further, there were improvements in rates of vaccination across all geographic regions, types of hospitals, and sociodemographic groups. Finally, improvements in vaccinations coincided with drops in pneumonia admissions in VHA, suggesting that potentially important gains can be achieved by health care systems when they institute immunization performance measurement programs.
The success of VHA’s improvement efforts must be evaluated in the context of what is known about barriers to optimal medical care. In the case of vaccines, the barrier is not physicians’ knowledge but rather physicians’ priorities.16 As Weingarten et al. found, physicians’ knowledge and acceptance of preventive guidelines do not necessarily correlate with their practices.17 The reasons that vaccination rates are low in many health care organizations are multifactorial, complex, and not necessarily amenable to traditional educational interventions.
VHA overcame these barriers through several important efforts. Bradley et al. identified several factors associated with successful efforts to improve beta blocker use among post–myocardial infarction patients: shared goals, substantial administrative support, strong physician advocacy, and credible data feedback.18 These factors are likely applicable to improving immunization rates as well. VHA’s implementation of performance measures systematized many of these features. Several key features were needed to realize the improvements: clear enunciation of organizational priorities; measurable goals, with incentives tied to achieving those goals; and the resources each facility needed to improve its care and meet those goals. The accountability associated with meeting performance goals, including performance appraisal based on these measures, unified the clinicians and managers in a shared purpose. Because these measures were highly evidence based, clinicians more readily supported them. In addition, the vetting of measures for selection, as well as the performance targets, among clinicians and nonclinician administrators alleviated some of the tensions between administrative leadership and the clinical front line. Perhaps most important was the regular feedback associated with the EPRP process. Data were collected and reported back to each network and each hospital at least quarterly; thus, each organization could continuously monitor quality improvement programs without the burden of additional data collection.
The performance measures program was associated with systematic effects on vaccinations. Vaccination rates rose in both the elderly and the immunocompromised nonelderly (in nearly all types of hospitals, irrespective of urban location, academic status, or technological capability) and in each region of the country. In 1995 there was a 13.7% regional difference in pneumococcal vaccination rates between the Midwest and the South (Table 2 ▶). By 1999, geographic differences had been greatly reduced, a pattern that was also reflected in vaccination rates for influenza. These changes suggest that the forces driving improvements were institutionalized across the entire VHA system, although there was likely important variation in the kinds of efforts individual facilities made to improve care.
Another potentially important reason for the high rates of vaccination within VHA may be the presence of electronic medical records and clinical reminders. Their effectiveness has been well demonstrated19; Demakis et al. found that such reminder systems effectively improved adherence to many ambulatory care guidelines, including vaccination.20 However, the vaccination rate increases across VHA often preceded full implementation of an effective electronic medical record system in some facilities.
Finally, whereas rates of influenza and pneumococcal vaccinations were increasing, hospitalization rates for pneumonia were falling, for a variety of possible reasons. In 1995, VHA launched an important transformation from a hospital model to an integrated health system model, emphasizing prevention and disease management. Some of the decrease in admissions may have been attributable to these changes. However, much of the decrease in pneumonia hospitalizations was likely attributable to increased vaccination rates, suggesting that when large health care organizations effectively institute quality improvement programs, they can garner substantial clinical gains.
Although much progress has been made, challenges remain. With the change in sampling scheme in 2001, we found a drop in influenza vaccination rates to 68%, suggesting that nearly one third of eligible patients did not receive the vaccine. Some of these omissions were attributable to patient refusal, which is often not well documented in the medical record. Because many patients have concerns about the safety of vaccines,21 additional patient education may be an effective intervention. Further, other deficiencies in documentation may be caused by patients receiving vaccination outside VHA. The change in sampling allowed for inclusion of more patients who received only intermittent care within VHA and who may have received much of their care elsewhere. However, whether these represent documentation gaps or true gaps in vaccination rates, VHA’s performance program is designed to raise these rates. As Kiefe et al. demonstrated, feedback tied to achievable benchmarks improves quality of care provided to patients.22 VHA, using the principles of this model, develops ambitious, yet realistic, goals on a yearly basis. The minimum requirement for each network is set at the leading edge of performance among networks during the previous year. Thus, by raising the bar to acceptable levels, each network continues to improve its performance.
Limitations
There are important limitations to this study. Although we found that VHA’s vaccination rates increased after the institution of the performance measurement program, we could not prove a causal link between this program and improved vaccination rates. This association may have been attributable to other factors that we could not measure. Comparisons between VHA and BRFSS data also have their limitations. The BRFSS data were self-reported vaccination rates rather than documented rates. Nevertheless, self-reported rates have been shown to be a valid method to determine the actual rate of vaccination among elderly outpatients.23 VHA data were based on medical record review, and the failure to record vaccinations that were given would lead to an undercount of rates of vaccination within VHA.
BRFSS data included more women than did VHA’s data and a population that was generally healthier than VHA’s elderly patients. However, gender differences in vaccination rates among the cohort sampled by BRFSS were small and unlikely to influence our findings. The comparison time frames between BRFSS and VHA data were not identical: BRFSS data were reported by the calendar year, and VHA data were reported by the fiscal year (which starts October 1). Therefore, given that the vaccination rates were rising in both groups, we likely understated the VHA rates in comparison with the BRFSS rates.
Another important limitation is that many VHA patients may have received a pneumococcal or influenza vaccine outside VHA, and these vaccinations may not have been documented in the patient record. This would likely bias results toward underreporting the rates of vaccination in this population. Furthermore, VHA patients represent an older, more ill subset of the American population,24 and therefore these findings may not be generalizable to all Americans. Finally, given that there is no comparable data-extraction effort available for the general population outside VHA, comparisons to non-VHA settings have limitations.
Conclusions
During a time of restructuring of the VHA health care system and the institution of a new quality improvement program, there were marked increases in vaccination rates with a concomitant observation of fewer hospitalizations from the complications of influenza and pneumonia. Although the exact reason for the improvement cannot be discerned, the increased rates are likely attributable to an increased focus on health promotion and disease prevention, a new performance accountability system, clear explication of the clinical evidence, and ongoing data feedback.
Acknowledgments
A. K. Jha was funded in part by the Physician Faculty Scholar Program of the Robert Wood Johnson Foundation (grant S7404).
Human Participant Protection The study was approved by the human subjects committee of the Veterans Administration Boston Healthcare System.
Peer Reviewed
Contributors A. K. Jha helped originate the study, performed the analyses, and led the writing of the article. S. M. Wright helped with the analytic plan, provided key feedback on article drafts, and was instrumental in obtaining the data. J. B. Perlin supervised all stages of the study, including originating the study and creating the analytic plan, and provided critical feedback on each version of the article.
References
- 1.Centers for Disease Control and Prevention. Prevention of pneumococcal disease: recommendations of the Advisory Committee on Immunization Practices (ACIP). MMWR Morb Mortal Wkly Rep. 1997;46(RR-8): 1–24. [PubMed] [Google Scholar]
- 2.Butler JC, Breiman RF, Campbell JF, Lipman HB, Broome CV, Facklam RR. Pneumococcal polysaccharide vaccine efficacy. An evaluation of current recommendations. JAMA. 1993;270:1826–1831. [PubMed] [Google Scholar]
- 3.Nichol KL. Complications of influenza and benefits of vaccination. Vaccine. 1999;17(suppl 1):S47–S52. [DOI] [PubMed] [Google Scholar]
- 4.Christenson B, Lundbergh P, Hedlund J, Ortqvist A. Effects of a large-scale intervention with influenza and 23-valent pneumococcal vaccines in adults aged 65 years or older: a prospective study. Lancet. 2001;357: 1008–1011. [DOI] [PubMed] [Google Scholar]
- 5.Nichol KL, Margolis KL, Wuorenma J, Von Sternberg T. The efficacy and cost effectiveness of vaccination against influenza among elderly persons living in the community. N Engl J Med. 1994;331:778–784. [DOI] [PubMed] [Google Scholar]
- 6.Nichol KL, Baken L, Wuorenma J, Nelson A. The health and economic benefits associated with pneumococcal vaccination of elderly persons with chronic lung disease. Arch Intern Med. 1999;159:2437–2442. [DOI] [PubMed] [Google Scholar]
- 7.National Center for Health Statistics. National Health Interview Survey. Available at: http://www.cdc.gov/nchs/data/nhis/earlyrelease/earlyrelease200706.pdf. Accessed October 13, 2006.
- 8.Healthy People 2010. Available at: http://www.healthypeople.gov/Document/html/uih/uih_4.htm#immuniz. Accessed August 7, 2007.
- 9.Jha AK, Perlin JB, Kizer KW, Dudley RA. Transformation of the VA health care system: impact on quality of care. N Engl J Med. 2003;348:2218. [DOI] [PubMed] [Google Scholar]
- 10.Centers for Disease Control and Prevention. Prevention and control of influenza: recommendations of the Advisory Committee on Immunization Practices (ACIP). MMWR Morb Mortal Wkly Rep. 2001;50(RR-4):8–9. [Google Scholar]
- 11.Jha AK, Shlipak MG, Hosmer W, Frances CD, Browner WS. Racial differences in mortality among men hospitalized in the Veterans Affairs health care system. JAMA. 2001;285:297–303. [DOI] [PubMed] [Google Scholar]
- 12.Lanska DJ, Peterson PM. Comparison of additive and multiplicative models of regional variation in the decline of stroke mortality in the United States. Stroke. 1996;27:1055–1059. [DOI] [PubMed] [Google Scholar]
- 13.Division of Adult and Community Health, National Center for Chronic Disease Prevention and Health Promotion. Behavioral Risk Factor Surveillance System online prevalence data. 1995–2000. Available at: http://apps.nccd.cdc.gov/brfss/Trends/TrendData.asp. Accessed October 13, 2006.
- 14.International Classification of Diseases, Ninth Revision. Geneva, Switzerland: World Health Organization; 1980.
- 15.National Center For Health Statistics. National Hospital Discharge Survey. Available at: http://www.cdc.gov/nchs/about/major/hdasd/nhdsdes.htm. Accessed October 13, 2006.
- 16.Noe CA, Markson LJ. Pneumococcal vaccination: perceptions of primary care physicians. Prev Med. 1998;27:767–772. [DOI] [PubMed] [Google Scholar]
- 17.Weingarten S, Stone E, Hayward R, et al. The adoption of preventive care practice guidelines by primary care physicians: do actions match intentions? J Gen Intern Med. 1995;10:138–144. [DOI] [PubMed] [Google Scholar]
- 18.Bradley EH, Holmboe ES, Mattera JA, Roumanis SA, Radford MJ, Krumholz HM. A qualitative study of increasing beta-blocker use after myocardial infarction: why do some hospitals succeed? JAMA. 2001;285: 2604–2611. [DOI] [PubMed] [Google Scholar]
- 19.Dexter PR, Perkins S, Overhage JM, Maharry K, Kohler RB, McDonald CJ. A computerized reminder system to increase the use of preventive care for hospitalized patients. N Engl J Med. 2001;345:965–970. [DOI] [PubMed] [Google Scholar]
- 20.Demakis JG, McQueen L, Kizer KW, Feussner JR. Quality Enhancement Research Initiative (QUERI): a collaboration between research and clinical practice. Med Care. 2000;38(6 suppl 1):I17–I25. [PubMed] [Google Scholar]
- 21.Amanna I, Slifka MK. Public fear of vaccination: separating fact from fiction. Viral Immunol. 2005;18: 307–315. [DOI] [PubMed] [Google Scholar]
- 22.Kiefe CI, Allison JJ, Williams OD, Person SD, Weaver MT, Weissman NW. Improving quality improvement using achievable benchmarks for physician feedback: a randomized controlled trial. JAMA. 2001; 285:2871–2879. [DOI] [PubMed] [Google Scholar]
- 23.Mac Donald R, Baken L, Nelson A, Nichol KL. Validation of self-report of influenza and pneumococcal vaccination status in elderly outpatients. Am J Prev Med. 1999;16:173–177. [DOI] [PubMed] [Google Scholar]
- 24.Kazis LE, Ren XS, Lee A, et al. Health status in VA patients: results from the Veterans Health Study. Am J Med Qual. 1999;14:28–38. [DOI] [PubMed] [Google Scholar]