

Abstract
We investigate a very simple model describing the evolution of protein-protein interaction networks via duplication and divergence. The model exhibits a remarkably rich behavior depending on a single parameter, the probability to retain a duplicated link during divergence. When this parameter is large, the network growth is not self-averaging and an average node degree increases algebraically. The lack of self-averaging results in a great diversity of networks grown out of the same initial condition. When less than a half of links are (on average) preserved after divergence, the growth is self-averaging, the average degree increases very slowly or tends to a constant, and a degree distribution has a power-law tail. The predicted degree distributions are in a very good agreement with the distributions observed in real protein networks.
I. INTRODUCTION
A single- and multi gene duplication plays a crucial role in evolution [1–4]. On the proteomics level, the gene duplication leads to a creation of new proteins that are initially identical to the original ones. In a course of subsequent evolution, the majority of these new proteins are lost as redundant, while some of them survive by diverging, i.e., quickly losing old and possibly slowly acquiring new functions.
The protein-protein interaction network is commonly defined as an evolving graph with nodes and links corresponding to proteins and their interactions. Thus a successful single-gene duplication event results in a creation of a new node which is initially linked to all the neighbors of the original node. Later, some links between each of the duplicates and their neighbors disappear (Fig. 1). Such a network evolution process is called duplication and divergence (4,5). Duplication and divergence is usually considered as the key growth mechanism for protein-protein networks, and it also plays a role in creation of new nodes and links in the world wide web, growth of various networks of human contacts by introduction of close acquaintances of existing members, and evolution of many other nonbiological networks.
FIG. 1.
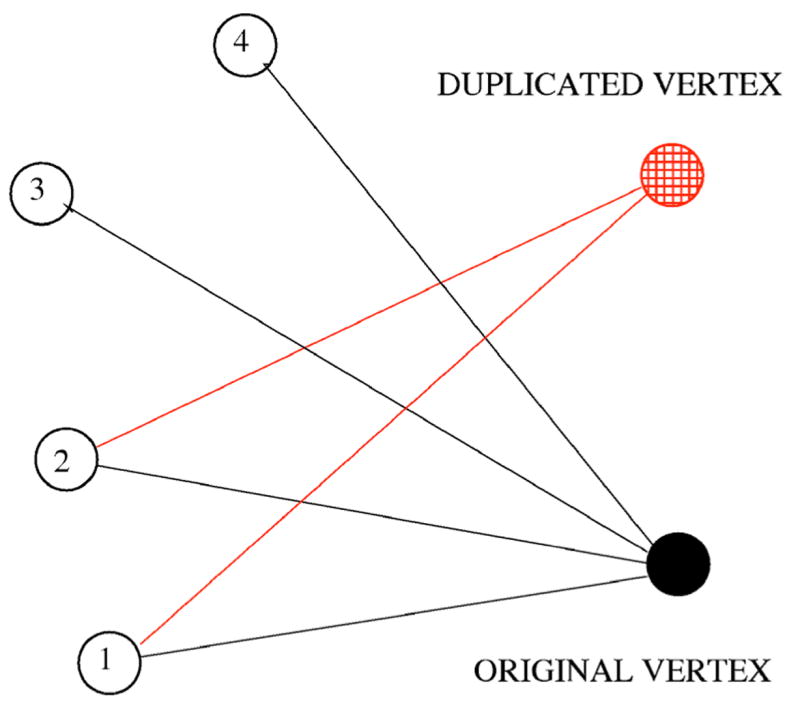
(Color online) A sketch of duplication and divergence event. Links between the duplicated vertex and vertices 3 and 4 disappeared as a result of divergence.
Does the evolution dominated by duplication and divergence define the structure and other properties of a network? So far, most of the attention has been attracted to the study of the degree distribution nk defined as the fraction of nodes with k links. Wagner [5] has provided a numerical evidence that duplication-divergence evolution does not noticeably alter the initial power-law degree distribution, provided that the evolution is initiated with a fairly large network. In a somewhat idealized case of the completely asymmetric divergence [5,6] when links are removed only from the duplicated node (as in Fig. 1), it was found [7–10] that the emerging degree distribution has a power-law tail: nk∼k−γ for k Yet apart from the shape of the degree distribution, a number of other perhaps even more fundamental properties of duplication-divergence networks remain unclear.
How well does the model describe its natural prototype, the protein-protein networks ?
Is the total number of links a self-averaging quantity ?
How does the average total number of links depend on the network size N ?
Does the degree distribution scale linearly with N ?
A nontrivial answer to any of these questions would be more important than details of the tail of the degree distribution.
Here we seek answers to above questions and we also look again at the degree distribution of the duplication-divergence networks. We examine a simple scenario of totally asymmetric divergence, where the evolution is characterized by a single parameter, the link retention probability σ. It turns out that even such an idealized model well describes the degree distribution found in the biological protein-protein networks. We find that depending on σ, the behavior of the system is extremely diverse: When more than a half of links are (on average) preserved, the network growth is non-self-averaging, the average degree diverges with the network size, and while a degree distribution has a scaling form, it does not resemble any power law. In a complimentary case of small σ the growth is self-averaging, the average degree tends to a constant, and a degree distribution approaches a scaling power-law form.
In the next section we formally define the model and compare the simulated degree distribution to the observed ones. The properties of the model are first analyzed in the tractable σ=1 and σ→+0 limits (Sec. III) and then in the general case 0<σ<1 (Sec. IV). Section V gives conclusions.
II. DUPLICATION AND DIVERGENCE
A number of the duplication-divergence models describing the evolution of protein interaction networks have been recently investigated. Asymmetric models assume that replica proteins carry some but generally not all of the interaction links of the target proteins from which they sprouted [7–9], while in symmetric models both replica and target proteins can lose the interaction links [11,12]. Some models also take into account the appearance of interactions [7,8,13–15] between new proteins and already existing ones, or specifically between the replica and the target proteins [12]. Despite their complexity, many of these models leave aside certain subtle details of biological evolution underlying actual duplication and divergence. Yet these models are usually analytically intractable and are not fully understood. Furthermore, the comparison with available data is ambiguous as the parameters used in the models are difficult to measure directly. Such a situation calls for a study of the simplest model that captures only the vital features of the network evolution and involves the minimal number of parameters.
We shall investigate the totally asymmetric model of duplication and divergence network growth involving only one parameter—the link retention probability σ. The model is defined as follows (Fig. 1).
(1) Duplication
A randomly chosen target node is duplicated, that is its replica is introduced and connected to each neighbor of the target node.
(2) Divergence
Each link emanating from the replica is activated with retention probability σ (this mimics link disappearance during divergence). If at least one link is established, the replica is preserved; otherwise the attempt is considered as a failure and the network does not change. [The probability of the failure is (1−σ)k if the degree of the target node is equal to k.]
As in the observed protein-protein interaction networks, in this model each node has at least one link and the network remains connected throughout the evolution. These features are the main distinction between our model and earlier models (see, e.g. [7,8]) which allowed an addition of nodes with no links and generated disconnected networks whose biological relevance is questionable. The simplest argument for the absence of disconnected components in protein-protein interaction networks is the existence of several ubiquitous biological pathways that are universal for all proteins (such as degradation, heat-shock, phosphorylation, dephosphorylation, glycosylation, cleavage, targeted transport to subcellular compartment, etc.). These processes are run by a few “housekeeping” proteins that correspond to high-degree hubs in the network and in principle must have physical links to all proteins present in a species. Several small disconnected components, observed in experiments, most probably owe their existence to the incompleteness of our knowledge about the protein-protein interaction networks.
Another difference between our model and many existing ones is that we do not take into account a process which is often called mutations in the network literature, i.e. possible appearance of new or reconnection of the existing links. The rate at which the links are lost is much higher than the rate at which the new links are acquired. The protein-protein interactions are highly specific: While a substitution of one or several amino acids often leads to a change of confirmation and subsequent loss of an affinity for a certain interaction, the probability that such substitution creates a protein that fits the binding domains of one of the existing proteins (and therefore establishes a link) is very low. Those few connections that can possibly form de novo do not contribute much to the “bulk” quantities that we focus on, such as the total number of links and degree distribution. Yet introduction of the noninherited links at least doubles the number of parameters and makes the model significantly less tractable.
The above simple rules generate networks which are strikingly similar to the naturally occurring ones. This is evident from Fig. 2 which compare the degree distribution of the simulated networks and protein-protein binding networks of baker yeast, fruit fly, and human. The protein interaction data for all three species were obtained from the Biological Association Network databases available from Ariadne Genomics [16]. The data for human (H. sapiens) protein network was derived from the Ariadne Genomics ResNet database constructed from the various literature sources using Medscan [17]. The data for baker yeast (S. cerevisiae) and fruit fly (D. melanogaster) networks were constructed by combining the data from published high-throughout experiments with the literature data obtained using Medscan as well [18].
FIG. 2.
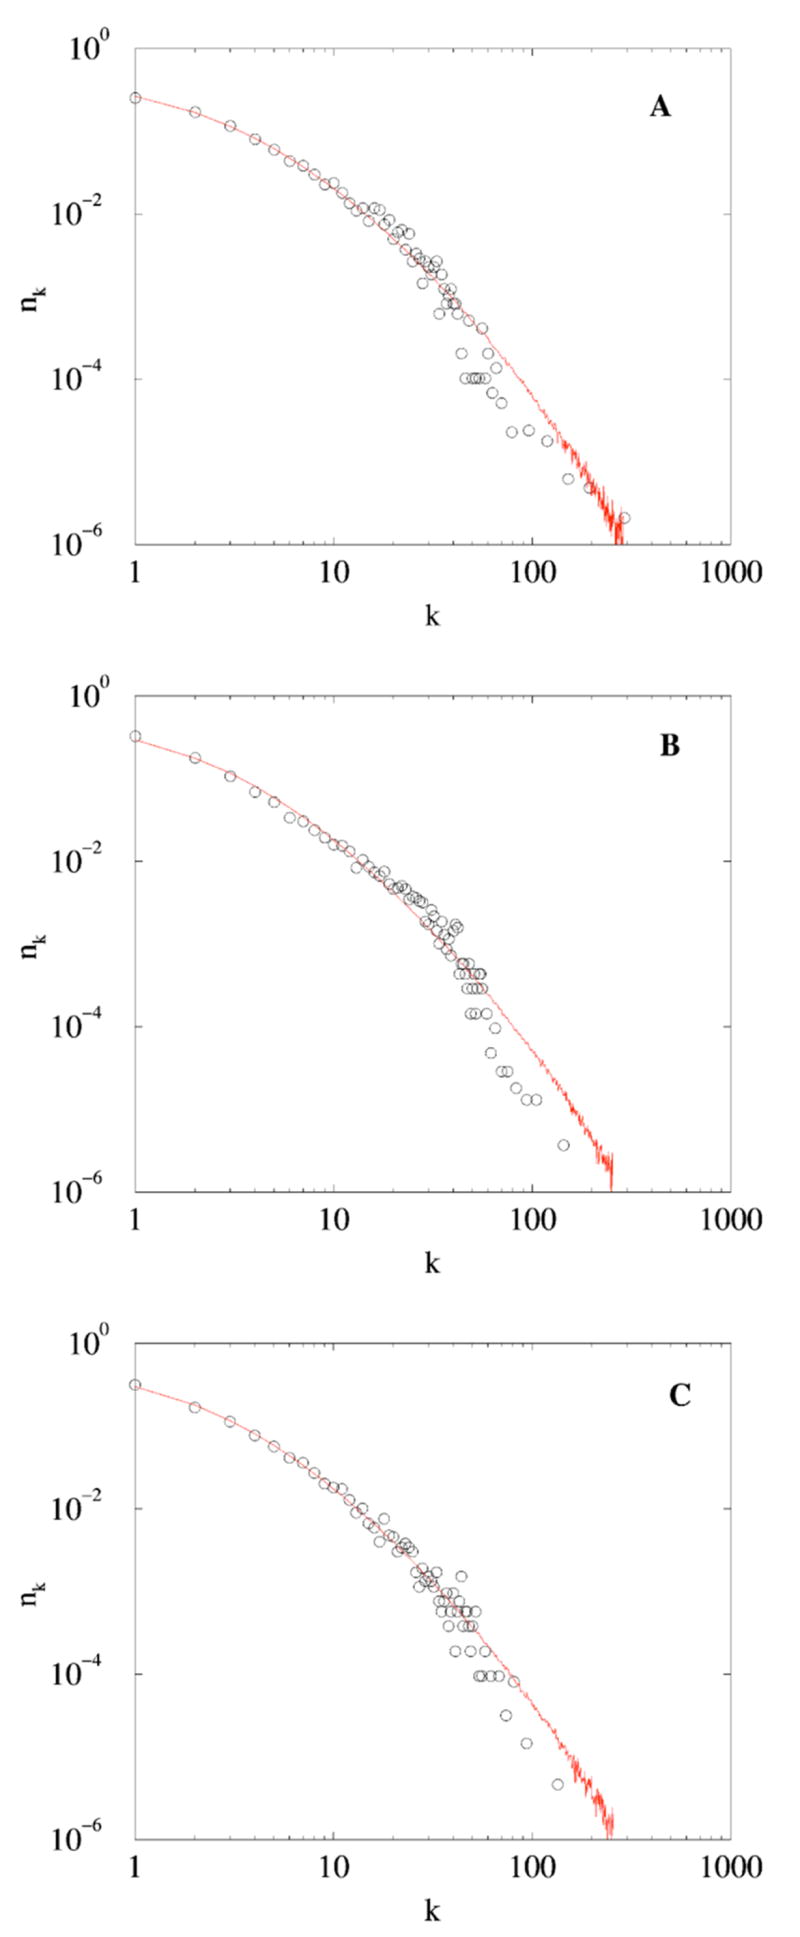
(Color online) Degree distribution of the protein-protein binding networks of the following. (A) Yeast with Np =4873 proteins and average degree 〈d〉 ≈ 6.6. The link retention probability of the fitted simulated network σ ≈ 0.413. (B) Fruit fly with Np =6954 proteins and average degree 〈d〉≈ 5.9. The link retention probability of the fitted simulated network σ≈ 0.380. (C) Human with Np =5275 proteins and average degree 〈d〉 ≈ 5.7. The link retention probability of the fitted simulated network σ ≈ 0.375.
Each simulated degree distribution was obtained by averaging over 500 realizations. The values of the link retention probability σof simulated networks were selected to make the mean degree 〈d〉 of the simulated and observed networks equal. The number of nodes and the number of links in the corresponding grown and observed networks were therefore equal as well.
Figure 2(A)–(C) demonstrate that even the most primitive form of the duplication and divergence model (which does not account for disappearance of links from the original node, introduction of new links, removal of nodes, and many other biologically relevant processes) reproduces the observed degree distributions rather well. These figures also show that the degree distributions of both simulated and naturally occurring networks are not exactly resembling power-laws that they are commonly fitted to (see, for example, [5]). A possible explanation is that the protein-protein networks (naturally limited to tens of thousands of nodes) are not large enough for a degree distribution to converge to its power-law asymptotics. To probe the validity of this argument we present (Fig. 3) the degree distributions for networks of up to 106 nodes with link retention probability σ =0.45. It follows that a degree distribution does not attain a power-law form even for very large networks, at least for naturally occurring σ≈0.4.
FIG. 3.
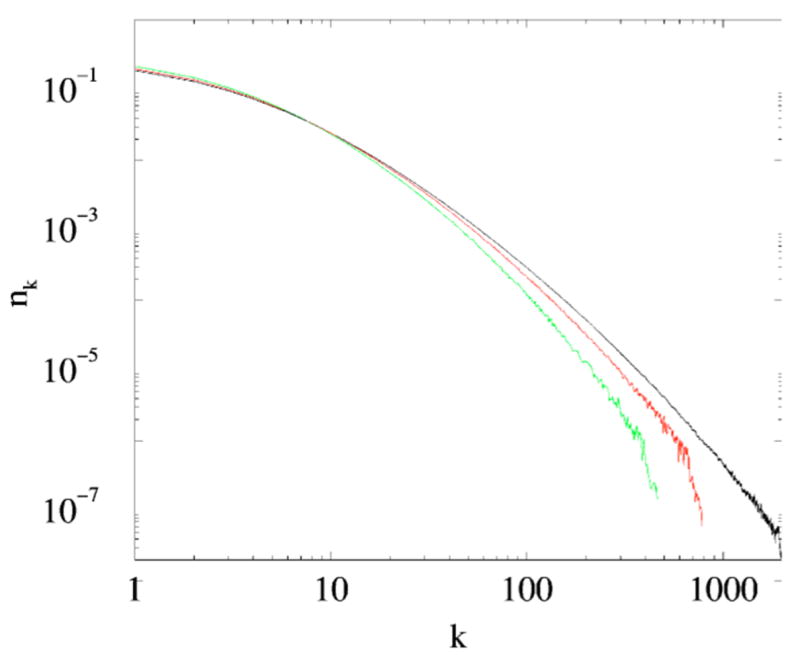
(Color online) Degree distributions of grown networks with (bottom to top) 104,105, and 106 vertices. The link retention probability σ=0.45, all data was averaged over 100 realizations.
III. SOLVABLE LIMITS
Here we analyze duplication-divergence networks in the limits σ=1 and σ→ 0 when the model is solvable and (almost) everything can be computed analytically.
A. No divergence (σ = 1)
This case has already been investigated in Refs. [8,9,19]. Here we outline its properties as it will help us to pose relevant questions in the general case when a divergence is present.
We assume that the initial network consists of two connected nodes. When σ=1, each duplication attempt is successful and the network remains a complete bipartite graph throughout the evolution. (A bipartite graph admits a partition into two disjoint sets of nodes with links only between nodes from different sets; if there are n and m nodes in two sets and each node from one set is linked to each node from the other set, the graph is called complete bipartite and denoted Kn,m.)The initial network is K1,1; at the next stage it turns into K2,1 or K1,2, equiprobably; and generally when the number of nodes reaches N, the network is the complete bipartite graph Kj,N−j with every value j =1, …,N−1 occurring equiprobably. In the complete bipartite graph Kj,N−j the degree of a node has one of the two possible values: j and N−j. Hence in any realization of a σ=1 network, the degree distribution is the sum of two delta functions: Nk(j) = jδk,N−j +(N− j)δk,j. Averaging over all realizations we obtain
| (1) |
The total number of links L in the complete graph Kj,N−j is L= j(N− j). Averaging over all j we can compute any moment 〈Lp〉; for instance, the mean L is equal to
| (2) |
and the mean square is given by
| (3) |
In the thermodynamic limit N→∝,L,→ ∝, the link distribution PN(L) becomes a function of the single scaling variable ℓ=L/N2, namely
| (4) |
with . The key feature of the networks generated without divergence (σ=1) is the lack of self-averaging. In other words, fluctuations do not vanish in the thermodynamic limit. This is evident from Eqs. (2)–(4): In the self-averaging case we would have had 〈L2〉 /〈L〉2=1 (instead of the actual value 〈L2〉/〈L〉2=6/5) and the scaling function would be the delta function. The lack of self-averaging implies that the future is uncertain—a few first steps of the evolution drastically affect the outcome.
Interestingly, the σ=1 limit of our model is equivalent to the classical Pólya’s urn model [20]. The urn models have been studied in the probability theory [21], have applications ranging from biology [22] to computer science [23,24], and remain in the focus of the current research (see, e.g. [25,26] and references therein).
B. Maximal divergence (σ= +0)
Let σ≪1. Then in a successful duplication attempt, the probability of retaining more than one link is very small (of the order of σ). Ignoring it, we conclude that in each successful duplication event, one node and only one link are added and for σ≪1 the emerging networks are trees.
If the degree of the target node is k, the probability of the successful duplication is 1− (1−σ)k which approaches σk when σ≪1. Hence any of the k neighbors of the target node will be linked to the potentially duplicated node with the same probability σ.
A given node n links to the new, duplicated, node in a process which starts with choosing a neighbor of n as the target node. The probability of that is proportional to the degree dn of the node n. Then the probability of linking to the node n is σ (as we already established) so the probability that the new node links to n is proportional to its degree dn. Thus we recover the standard preferential attachment model [27]. This model exhibits the well-known behavior: The total number of links is L=N−1, and the degree distribution is a self-averaging quantity peaked around the average,
| (5) |
IV. GENERAL CASE (0<σ<1)
We now move on to the discussion of the general case which is only partially understood.
A. Self-averaging
Self-averaging of any quantity can be probed by analyzing a relative magnitude of fluctuations of that quantity. As a quantitative measure we shall use the ratio of the standard deviation to the average. For the total number of links,
| (6) |
should vanish in the thermodynamic limit if the total number of links is the self-averaging quantity. Even if χ vanishes in the thermodynamic limit, fluctuations may still play noticeable role if χ approaches zero too slowly.
Simulations [Fig. 4] show that the system is apparently self-averaging when σ≤1/2. It is somewhat difficult to establish what is happening in the borderline case σ=1/2, though we are inclined to believe that self-averaging still holds. The self-averaging is evidently lost at σ=3/4, and the system is certainlyf non-self-averaging for σ=1 [in this situation , see Eqs. (2) and (3)]. These findings suggest that in the range 1/2<σ≤1 the total number of links is not a self-averaging quantity.
FIG. 4.
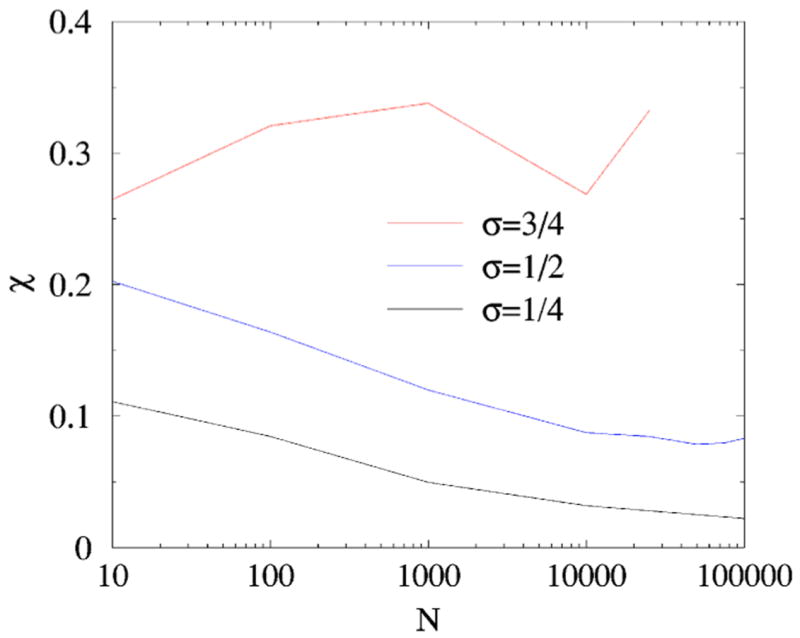
(Color online) χ vs N for (top to bottom) σ =3/4,1/2,1/4. The total number of nodes is obviously a self-averaging quantity for σ=1/4, apparently also self-averaging for σ=1/2, and evidently non-self-averaging for σ=3/4.
B. Total number of links
According to the definition of the model, a target node is chosen randomly. Therefore, the probability that a duplication event is successful, or equivalently, the average increment of the number of nodes per attempt is
| (7) |
where nk = Nk /N is a probability for a node to have a degree k. Similarly the increment of the number of links per step is
and therefore
| (8) |
The inequality kσ>1− (1−σ)k is valid for all k>1 and therefore dL/dN≥1 implying
| (9) |
This is obvious geometrically as (9) should hold for any connected network.
Using Eq. (8) we can verify the self-consistency of our conclusion (5) derived in the case of σ= +0. Substituting (5) in (8) we obtain
| (10) |
It confirms our assumption that for vanishingσ, each successful duplication event increments the number of links by one.
To analyze the growth of L versus N, we use the definition (7) ofν, an identity 2L=ΣkNk, and rewrite (8) as
| (11) |
which leads to an algebraic growth L~N2σ/ν. Noting that νcannot exceed one [this follows from (7) and the sum rule Σnk =1] we conclude that growth is certainly superlinear whenσ> 1/2. Hence the average degree 〈d〉 =Σk≥1knk =2L/N diverges with system size algebraically, 〈d〉~ Nαwith α=2σ/ν −1>0. Since the average degree grows indefinitely, the probability of the failure to inherit at least one link approaches zero, that isν→ 1 as N→∝. Therefore we anticipate that asymptotically L~N2σand 〈d〉~ Nαwith α=2σ −1>0. These expectations agree with simulations fairly well (Fig. 5). For instance when σ=3/4, the predicted exponent α=1/2 is close to the fitted one, α=0.51 (Fig. 5). The agreement is worse when σ approaches σ=1/2; the predicted exponent for σ=5/8 α=1/4 is notably smaller than αnumer≈ 0.3 observed in the simulations.
FIG. 5.
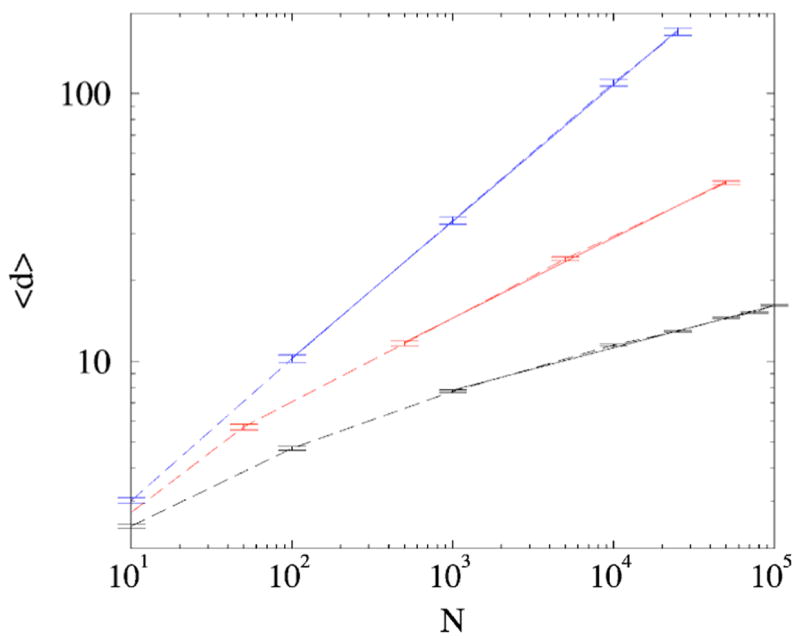
(Color online) The average node degree 〈d〉 vs N for (bottom to top, dashed lines) σ=1/2,5/8,3/4. Solid lines are corresponding power-law 〈d〉~Nα best fits for the large N parts of the plots: α( σ =1/2) ≈ 0.16,α (σ=5/8) ≈ 0.30, and α( σ=3/4) ≈ 0.51. The results are averaged over 100 network realizations.
In the range σ≤ 1/2, we cannot establish on the basis of Eq. (11) alone whether the growth is superlinear or linear [the growth is at least linear as it follows from the lower bound (9)]. The average node degree 〈d〉 grows with N but apparently saturates when σ is close to zero (see Fig. 6). For σ ≈ 0.3–0.4 the average degree seems to grow logarithmically, that is L(N)~ N ln N. For σ =1/2 the growth of 〈d〉 is superlogarithmical (see Fig. 6) and can be fitted both by 〈d〉~ (ln N)β with β≈ 2, or by a power law 〈d〉~ Nα with a fairly small exponent α(1/2)≈ 0.16.
FIG. 6.
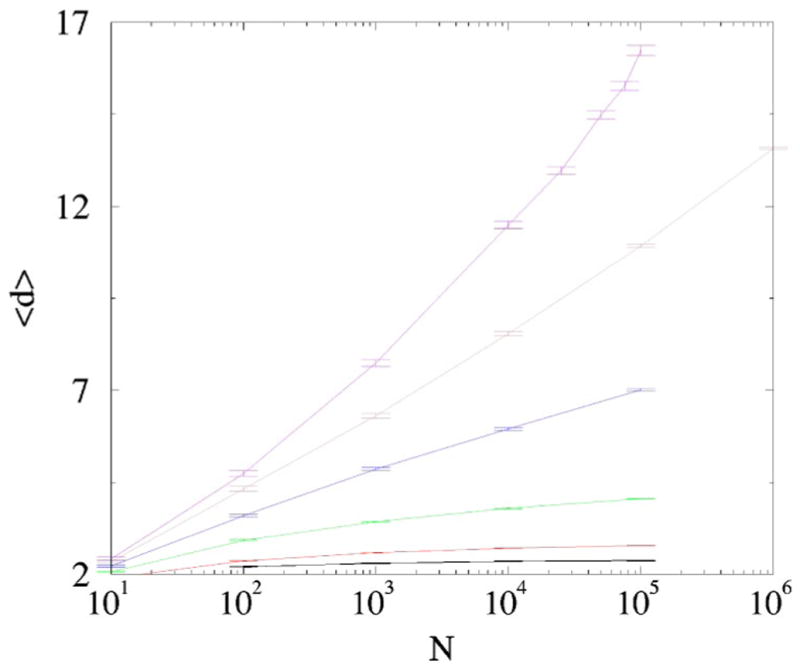
(Color online) The average node degree 〈d〉 vs N in the self-averaging regime. σ =1/16,1/8,1/4,3/8,0.45,1/2 (bottom to top). The results are averaged over 100 network realizations.
Hence, taking into account the simulation results and limiting cases considered earlier, the behavior of L can be summarized as follows:
| (12) |
Numerically it appears that σ* ≈ 0.3–0.4. In the next subsection we will demonstrate that σ*=e−1=0.367879….
C. Degree distribution
A rate equation for the degree distribution is derived in the same manner as Eq. (8) (see [8] for more details of a similar derivation):
| (13) |
Here we have used the shorthand notation
| (14) |
for the probability that the new node acquires a degree k. The general term in the sum on the right-hand side of Eq. (14) describes a duplication event in which k links remain and s -k links are lost due to divergence.
Summing both sides of (13) over all k≥1 we obtain ν on the left-hand side. On the right-hand side, only the second term contributes to the sum and also gives the sameν:
where the second line was derived using the binomial identity. Similarly, multiplying (13) by k and summing over all K≥ 1 we recover (11). These two checks show consistency of (13) with the growth equations, introduced earlier.
Since ν depends on all nk, see (7), Eqs. (13) are nonlinear. However, the observations made in the previous subsection allow us to approximate, for any givenσ,ν as parameter, thus ignoring its possible very slow dependence on N. Resulting linear Eqs. (13) are still very complicated: If we assume that k≫ 1 and employ the continuous approach, we still are left with a system of partial differential equations with a nonlocal “source” term mk. Fortunately, the summand in mk, that is is sharply peaked around s ≈ k/σ [8]. Hence we can replace Σs≥knsg(s,k) by nk/σΣ s≥kg(s,k)≡ σ− 1nk/σ [28], and Eqs. (13) become
| (15) |
Still, the analysis of (15) is hardly possible without knowing the correct scaling. Figure 7 indicates that the form of the degree distribution varies with σsignificantly. We will proceed (separately for 0< σ< 1/2 and 1/2< σ< 1) by guessing the scaling and trying to justify the consistency of the guess.
FIG. 7.

(Color online) The degree distribution nk vs k for (bottom to to top) σ =1/4, σ =1/2, and σ =3/4. The size of the network is N=105 for σ =1/4,N=5 × 104 for σ =1/2, and N=104 for σ =3/4. The results are averaged over 100 realizations.
1. 0<σ<1/2
Assuming the simplest linear scaling Nk ~N we reduce Eq. (15) to
| (16) |
We also used ν =2σ, which is required to assure that L~N [29] is consistent with (11). Plugging nk ~k−γ into (16) we obtain
| (17) |
This equation has two solutions: γ=2 and a nontrivial solution γ( σ) which depends on σ . The second solution γ( σ) decreases from γ( 0) =3 to γ( 1/2) =1. The two solutions coincide at σ*=e−1=0.367879. The sum Σknk converges whenγ> 2, and the total number of links grows linearly, L~N. Apparently the appropriate solution is the one which is larger: Forσ< e−1 the exponent is γ( σ), while forσ> e−1 the exponent is γ =2, Fig. 8. In the latter case,
FIG. 8.
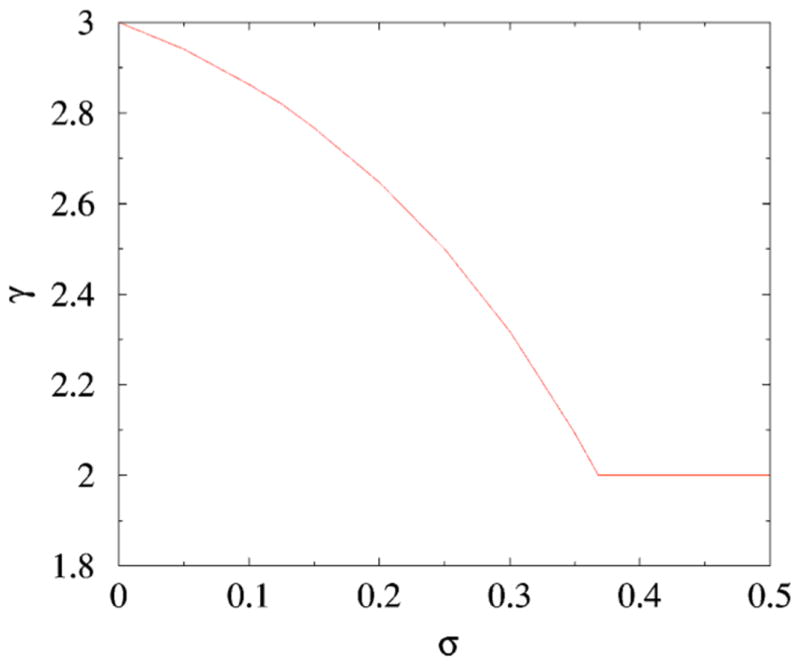
The degree distribution exponent γ( σ) from Eq. (17).
and therefore the total number of links grows as N ln N.
Simulations show that for small σ the degree distribution nk has indeed a fat tail (see Fig. 9). The agreement with the theoretical prediction of the algebraic tail is very good when σ=1/8 [Eq. (17) gives γ=2.817187 while numerically γnumer ≈2.82], not so good when σ=1/4 (γ=5/2 vs. γnumer≈2.7), and fair at best for σ=3/8.
FIG. 9.

(Color online) nk vs k for the network of size N =105 in the self-averaging regime. σ= +0,1/8,1/4,3/8,0.45 (bottom to top). The result for σ = +0 is the exact solution (5), simulation data is averaged over 100 realizations. The corresponding analytical predictions for the exponent are γ (σ =1/8) =2.817187,γ (σ=1/4) =5/2, and γ( σ =3/8) =γ( σ =0.45) =2.
Thus we explained the growth law (12). We also arrived at the theoretical prediction of σ* which reasonably well agree with simulation results. Due to the presence of logarithms, the convergence is extremely slow and better agreement will be probably very hard to achieve. Finally we note that the behaviors L~N ln N and nk ~k−2 arise in a surprisingly large number of technological and social networks (see [30] and references therein).
2. 1/2<σ<1
The growth law (12) suggests an introduction of a scaling form Nk = N 2–2σF(x) with x=k/N2σ − 1. Then the sum rules ΣNk = N and ΣkNk ~N2σ are manifestly satisfied [provided that the scaling function F(x) falls off reasonably fast for x→∝]. Simulation results (see Fig. 10) are in a good agreement with above scaling form.
FIG. 10.
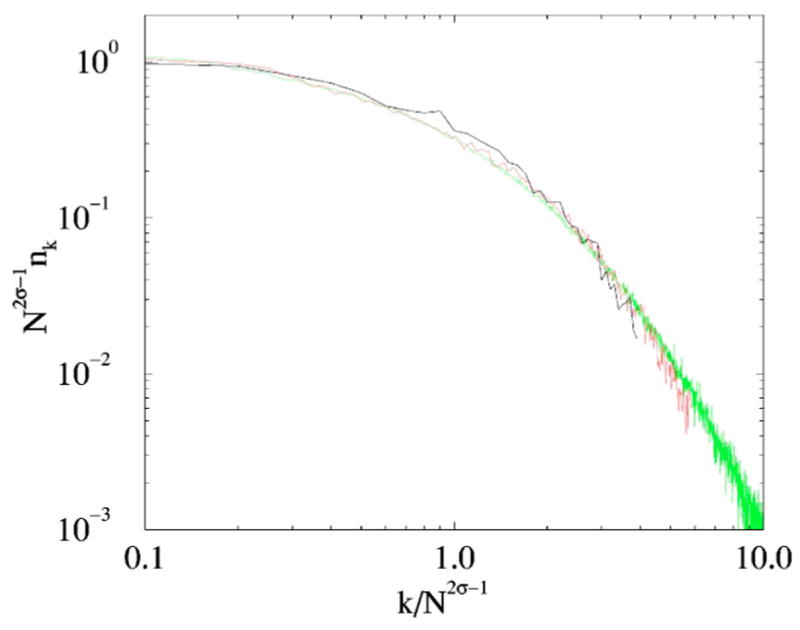
(Color online) Scaling of the degree distribution in the networks of N=100,N=1000, and N=10000 nodes with σ=3/4.
V. CONCLUSIONS
We have shown that a simple one-parameter duplication-divergence network growth model well approximates the degree distribution of realistic protein-protein networks. Table I summarizes how the major network features [self-averaging, evolution of the number of links L(N), the degree distribution nk] change when the link retention probability σ varies.
TABLE I.
The behavior of the duplication-divergence network for different values of probability to inherit a linkσ. Here L(N) is the average number of links for a given number of nodes N,nk is the average fraction of nodes of degree k, and the exponent γ( σ)> 2 is defined by equation γ=3-σγ − 2.
| σ | Self-averaging | L(N) | nk |
|---|---|---|---|
| σ=1 | No | N(N+1) /6 | 2(N-k) /[N(N-1)] |
| 1/2 < σ< 1 | No | ~N2σ − 1 | ~N1–2σF(k/N2σ − 1) |
| e−1< σ< 1/2 | Yes | ~N ln N | probably ~k−2 |
| 0< σ< e−1 | Yes | ~N | ~k−γ( σ) |
| σ= +0 | Yes | N-1 | 4/[k(k+1)( k+2)] |
The two most striking features of duplication-divergence networks are the lack of self-averaging for σ> 1/2 and extremely slow growth of the average degree forσ< 1/2. These features have very important biological implications: The lack of self-averaging naturally leads to a diversity between the grown networks and the slow degree growth preserves the sparse structure of the network. Both of these effects occur in wide ranges of parameter σ and therefore are robust—it is hard to expect that nature would have been able to fine-tune the value of σ if it were not so.
Our findings indicate that in the observed protein-protein networks σ ≈ 0.4, so biologically-relevant networks seem to be in the self-averaging regime. One must, however, take the experimental protein-protein data with a great degree of caution: It is generally acknowledged that our understanding of protein-protein networks is quite incomplete (see Fig. 11). Usually, as the new experimental data becomes available, the number of links and the average degree in these network increases. Hence the currently observed degree distributions may reflect not any intrinsic property of protein-protein networks, but a measure of an incompleteness of our knowledge about them. Therefore a possibility that the real protein-protein networks are not (or have not been at some stage of the evolution) self-averaging is not excluded.
FIG. 11.
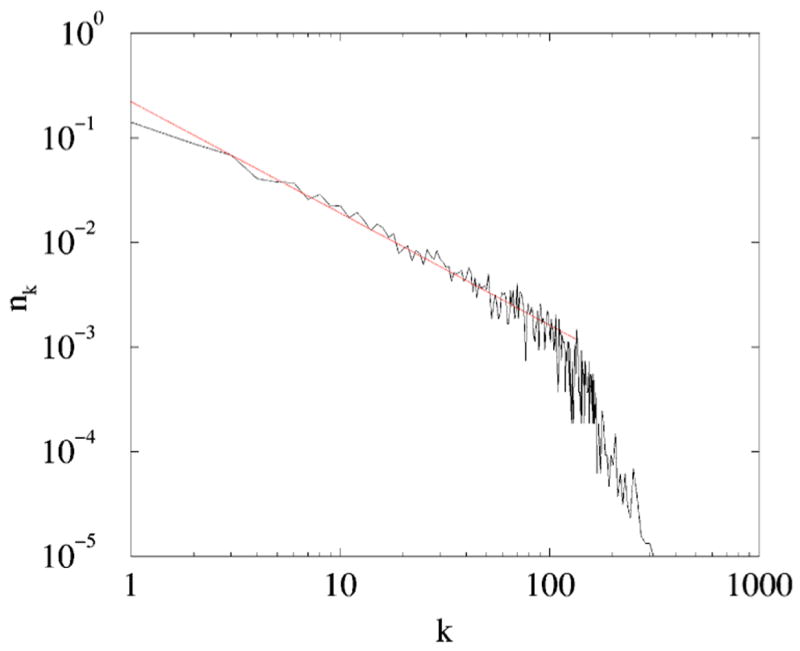
(Color online) Using a multitude of direct and indirect methods, von Mering et al. [31] predicted 78928 links between 5397 yeast proteins which produces a network with the average degree 〈d〉≈ 29.2. A power-law fit to this degree distribution has the exponent γ≈ 1.1.
It has been suggested that randomly introduced links (mutations) must complement the inherited ones to ensure the self-averaging and existence of smooth degree distribution [7, 8]. While a lack of random linking does affect the topological structure of the resulting network, we have observed that the features that are strongly dependent on the link number like the self-averaging, growth law, and degree distribution are rather insensitive to whether random links are introduced or not. This is so because usually the number of random links is significantly less than the number of inherited ones. We performed a number of simulation runs where links between a target node and its image were added at each duplication step with a probability Pd. Introduction of such links is the most direct way to prevent partitioning of the network into a bipartite graph (see [8]). In other words, without such links the target and duplicated nodes are never directly connected to each other. We observed that for reasonable values of Pd < 0.1 (in the observed yeast, fly, and human protein-protein networks Pd never exceeds this value) the results reported here remain unaffected. Apparently, without randomly introduced links, the network characteristics establish themselves independently in every subset of vertices duplicated from each originally existing node. We leave more systematic study of the effects of noninherited links as well as of the more symmetric divergence scenarios (when links may be lost both on the target and duplicated node) for the future [32].
Many unanswered questions remain even in the realm of the present model. For instance, little is known about the behavior of the system in the borderline cases of σ=1/2 and σ=e−1. One also wants to understand better the tail of the degree distribution in the region σ≥ e−1 where L(N) follows unusual scaling laws. It will be also interesting to study possible implications of these results for the probabilistic urn models [21].
Acknowledgments
The authors are thankful to S. Maslov, S. Redner, and M. Karttunen for stimulating discussions. This work was supported by 1 R01 GM068954-01 grant from NIGMS.
References
- 1.Ohno S. Evolution by Gene Duplication. Springer-Verlag; New York: 1970. [Google Scholar]
- 2.Li W-H. Molecular Evolution. Sinauer; Sunderland, MA: 1999. [Google Scholar]
- 3.Patthy L. Protein Evolution. Blackwell Publishers; Portland, OR: 1999. [Google Scholar]
- 4.Taylor JS, Raes J. Annu Rev Genet. 2004;9:615. doi: 10.1146/annurev.genet.38.072902.092831. [DOI] [PubMed] [Google Scholar]
- 5.Wagner A. Proc R Soc London, Ser B. 2003;270:457. [Google Scholar]
- 6.Conant GC, Wagner A. Genome Res. 2003;13:2052. doi: 10.1101/gr.1252603. [DOI] [PMC free article] [PubMed] [Google Scholar]
- 7.Solé RV, Pastor-Satorras R, Smith ED, Kepler T. Adv Complex Syst. 2002;5:43. [Google Scholar]
- 8.Kim J, Krapivsky PL, Kahng B, Redner S. Phys Rev E. 2002;66:055101. doi: 10.1103/PhysRevE.66.055101. [DOI] [PubMed] [Google Scholar]
- 9.Chung F, Lu L, Dewey TG, Galas DJ. J Comput Biol. 2003;10:677. doi: 10.1089/106652703322539024. [DOI] [PubMed] [Google Scholar]
- 10.Pastor-Satorras R, Smith E, Solé RV. J Theor Biol. 2003;222:199. doi: 10.1016/s0022-5193(03)00028-6. [DOI] [PubMed] [Google Scholar]
- 11.Dokholyan NV, Shakhnovich B, Shakhnovich EI. Proc Natl Acad Sci USA. 2002;99:14132. doi: 10.1073/pnas.202497999. [DOI] [PMC free article] [PubMed] [Google Scholar]
- 12.Vázquez A, Flammini A, Maritan A, Vespignani A. ComPlexUs. 2003;1:38. [Google Scholar]
- 13.Bauer M, Bernard D. J Stat Phys. 2003;111:703. [Google Scholar]
- 14.Coulomb C, Bauer M. Eur Phys J B. 2003;35:377. [Google Scholar]
- 15.Krapivsky PL, Derrida B. Physica A. 2004;340:714. [Google Scholar]
- 16.http://www.ariadnegenomics.com/.
- 17.Novichkova S, Egorov S, Daraselia N. Bioinformatics. 2003;19:1699. doi: 10.1093/bioinformatics/btg207. [DOI] [PubMed] [Google Scholar]
- 18.http://www.ariadnegenomics.com/products/pathway.html.
- 19.Raval A. Phys Rev E. 2003;68:066119. doi: 10.1103/PhysRevE.68.066119. [DOI] [PubMed] [Google Scholar]
- 20.Eggenberger F, Pólya G. Z Angew Math Mech. 1923;3:279. [Google Scholar]
- 21.Johnson NL, Kotz S. Urn Models and their Applications. Wiley; New York: 1977. [Google Scholar]
- 22.Sigmund K. Games of Life. Oxford University Press; Oxford: 1993. [Google Scholar]
- 23.Bagchi A, Pal AK. SIAM J Algebraic Discrete Methods. 1985;6:394. [Google Scholar]
- 24.Aldous D, Flannery B, Palacios JL. Prob Eng Infor Sci. 1988;2:293. [Google Scholar]
- 25.Kotz S, Mahmoud H, Robert P. Stat Probab Lett. 2000;49:163. [Google Scholar]
- 26.P Flajolet, J. Gabarró, and H. Pekari, arXiv math.PR/0407098
- 27.Simon HA. Biometrika. 1955;42:425. ibid. 3, 80 (1960) [Google Scholar]
- 28.We used the identity .
- 29.The growth law L~N ln N agrees with (11) if the convergence of ν to 2σ is logarithmically slow: 2σ-ν (N)~ (ln N)− 1.
- 30.Krapivsky PL, Redner S. Phys Rev E. 2005;71:036118. doi: 10.1103/PhysRevE.71.036118. [DOI] [PubMed] [Google Scholar]
- 31.von Mering C, et al. Nature (London) 2002;417:399. doi: 10.1038/nature750. [DOI] [PubMed] [Google Scholar]
- 32.I. Ispolatov, P. L. Krapivsky, I. Mazo, and A. Yuryev, q-bio.MN/0502005.