

Abstract
St. John’s Wort (SJW), an over-the-counter antidepressant, contains hypericin, which absorbs light in the UV and visible ranges. In vivo studies have determined that hypericin is phototoxic to skin and our previous in vitro studies with lens tissues have determined that it is potentially phototoxic to the human lens. To determine if hypericin might also be phototoxic to the human retina, we exposed human retinal pigment epithelial cells to 10−7 to 10−5 M hypericin. Fluorescence emission detected from the cells (λexc = 488 nm; λem = 505 nm) confirmed hypericin uptake by human RPE. Neither hypericin exposure alone nor visible light exposure alone reduced cell viability. However when irradiated with 0.7 J/cm2 of visible light (λ> 400 nm) there was loss of cell viability as measured by MTS and LDH assays. The presence of hypericin in irradiated hRPE cells significantly changed the redox equilibrium of glutathione and a decrease in the activity of glutathione reductase. Increased lipid peroxidation as measured by the TBARS assay correlated to hypericin concentration in hRPE cells and visible light radiation. Thus, ingested SJW is potentially phototoxic to retina and could contribute to retinal or early macular degeneration.
INTRODUCTION
Hypericin is a biologically active component of St. John’s Wort (SJW), an over-the-counter dietary supplement that has antidepressant properties (1, 2). The Hypericum perforatum extract has also been associated with side effects and interactions with other drugs (3). The usual oral dose of SJW (1000 mg) produces a mean level of serum hypericin of 43 ng/ml, which is equivalent to a concentration of approximately 0.1 μM (4). When ingested or given by intravitreal injection for the photodynamic treatment of retinal neovascularization, hypericin accumulates in the retina at a concentration of 1–100 μM (5). Hypericin is known to be a very efficient photosensitizer when irradiated with either UV or visible light (6); both St. John’s Wort and hypericin induce photosensitized erythema in the skin (7, 8). The other potential target for phototoxic damage induced by hypericin is the eye (9).
Visible light (above 400 nm) is transmitted through the human lens to the retina (10). If this transmitted light interacts with an accumulated photosensitizer, it can damage both the human lens and the retina (9). Hypericin is capable of crossing the blood-retinal barrier (5), and has been shown to induce apoptosis in retinal pigment epithelial (RPE) (11) and human lens epithelial cells (12). We have previously determined that hypericin is taken up by the intact lens (13) and RPE cells (14), binds to (15) and damages lens proteins (16), and distorts the transmission of light through the lens (17). We report here a mechanism for the oxidative damage induced in human retinal pigment epithelial (hRPE) cells by hypericin in the presence of visible light.
MATERIALS AND METHODS
Reagents
1-Chloro-2,4-dinitrobenzene, potassium chromate, potassium iodide, and 2-vinylpyridine were purchased from Aldrich (Milwaukee, WI, USA); glutathione reductase from baker’s yeast from Fluka (Milwaukee, WI, USA); gentamicin and trypsin from GIBCO (Grand Island, NY, USA); sodium hydroxide and water from J.T. Baker (Phillipsburg, NJ, USA); hydrochloric acid (~37%), anhydrous sodium carbonate, and trichloroacetic acid from Mallinckrodt (Paris, KY, USA); and bovine albumin (fraction V), butylated hydroxytoluene, sterile dimethyl sulfoxide, 5,5′-dithiobis-(2-nitrobenzoic acid), EDTA, glutathione in both the reduced and oxidized forms, hypericin, NADPH, sodium nitrite, 5-sulfosalicylic acid, 2-thiobarbituric acid, triethanolamine, and Triton X-100 from Sigma (St. Louis, MO, USA). All reagents used for experiments were at least analytical grade.
Cell cultures
The hRPE cells used in the present study were isolated from a donor eye (a 62 year old male, cause of death: trauma) using the method of Hu et al. (18). The cells consisted of one cell line of a pure culture of cells in active growth status. The hRPE cells were distinguished from neighbor cells by immunocytochemical methods: hRPE cells displayed S-100 and cytokeratin, whereas uveal melanocytes displayed S-100 antigen but not cytokeratin, and fibroblasts displayed neither of these proteins (19).
The hRPE were cultured in Falcon flasks (75 cm2) with Ham’s F12K and DMEM/F-12 (2:1, v/v) nutrient mixture supplemented with 10% fetal bovine serum, 2 mM L-glutamine, and 50 μg/ml gentamicin. The confluent cells were detached by 0.125% trypsin solution, diluted by a factor of 3.6–13.2, and plated for subculture. The cells were cultured in 35 mm glass bottom microwell dishes (MatTek Culturware, Ashland, MA, USA) for confocal microscopy, 96-well plates (Corning Incorporated, Corning, NY, USA) for experiments where mitochondrial activity and lactate dehydrogenase (LDH) leakage were measured, and in 10 cm Petri dishes (Becton Dickinson Labware, Franklin Lakes, NJ, USA) before mitochondrial and nuclear DNA assays, determination of glutathione and TBARS concentrations, and measurement of glutathione S-transferase (GST) and glutathione reductase (GR) activity. Cells were in the 13th – 22nd passage.
Cell incubation with hypericin
Hypericin was dissolved in dimethyl sulfoxide (DMSO) and diluted with medium to the required concentrations immediately before addition to the cell culture. DMSO concentration was 0.1% in all cell culture plates including control samples. Cells were incubated in the dark at 37°C in a 5% CO2 / 95% air atmosphere in medium without added chromophore (control cells) or containing 0.1 to 10 μM hypericin for 1–1½ hours prior to light exposure. Cells were resuspended in phosphate buffered saline (PBS) (pH 7.4, Ca2+ and Mg2+ free) or with PBS containing 10 mM glucose (PBS/Gluc).
Light exposure
The hRPE cells were exposed to light directly in the covered plates in which they were grown. The light source was 2 cool white visible light bulbs (Philips F40AX50, 40 W, 5000 K, Advantage X, Sommerset, NJ, USA), with the light passed through a liquid filter [aqueous solution of NaNO2 (50 g/l), K2CrO4 (0.2 g/l) and Na2CO3 (1 g/l)] transmitting light of wavelengths longer than 400 nm. The volume of the filter liquid in a 600 ml Falcon flask was carefully measured to get a vertical pathlength of exactly 1 cm in the horizontal position of the flask. Cells were irradiated for 1, 3, 5, and 10 min at a fluence rate of 10.6–12 W/m2, which was monitored with an YSI-Kettering radiometer (model 65A, YSI, Yellow Springs, OH, USA), equipped with a visible light photodiode. The maximal visible light dose was 0.72 J/cm2, which is lower than the daily dose that reaches the human retina (20). Visible light dosages had no effect on the viability of the retinal cells. Control samples were kept in the dark under the same conditions.
Confocal microscopy
hRPE cells were grown on glass cover slips that formed the floor of a teflon microscope chamber. The cells were incubated in medium containing 0.5 or 1 μM hypericin for 1h and were suspended in PBS/Gluc. Accumulation of hypericin in the RPE cells and the effect of light (I = 12 W/m2) on the cells preincubated with the chromophore were observed using a Zeiss inverted confocal laser scanning microscope (Model 510 with multiphoton capabilities). To acquire images, the chamber containing the hRPE cells was mounted on the stage of the microscope and viewed through a 40× water immersion objective (NA 1.2). Excitation was provided by the 488 nm line of an Ar ion laser. A 505 nm long-pass emission filter was used. Low laser intensity was used to avoid photobleaching. With the photomultiplier gain set to give an average cellular fluorescence intensity of 50 (full scale, 255), hRPE autofluorescence due to endogenous lipofuscin was barely detectable.
Mitochondrial activity and cell membrane damage tests
After incubation of the cells with hypericin (0.1–10 μM) for 1½ hours in medium, they were overlaid by PBS/Gluc and exposed to light. Then the buffer was replaced with medium and the cells were incubated in the dark at 37°C in a 5% CO2 / 95% air atmosphere for 0.5–16 h, after which the MTS (3-(4,5-dimethylthiazol-2-yl)-5-(3-carboxymethoxyphenyl)-2-(4-sulfophenyl)-2H-tetrazolium, inner salt) and LDH assays were carried out. Mitochondrial activity was determined using MTS (Cell Titer 96® AQueous Non-Radioactive Cell Proliferation Assay, Promega Corp., Madison, WI, USA). Membrane damage was determined by LDH leakage, which was measured using CytoTox 96® Non-Radioactive Cytotoxicity Assay (Promega Corp., Madison, WI, USA).
Mitochondrial and nuclear DNA assays
Directly after visible light exposure, irradiated cells and their dark controls were scraped out of plates with a cell lifter, suspended in PBS, and transferred to 15 ml plastic vials. Samples were centrifuged at 200g for 5 min at 4°C. Supernatants were removed and cell precipitates were stored at −70°C until the assay.
Frozen cell pellets were later thawed and immediately transferred to 2 ml lysis buffer (Genomic-tips kit; Qiagen) supplemented with 4 μl RNase A (100 mg/ml; Qiagen) and 100 μl proteinase K (>600 mAU/ml; Qiagen). Samples were vortexed for 5 seconds and incubated at 50ºC for 2 hours. Samples were then vortexed again for 10 seconds and loaded immediately onto pre-equilibrated Genomic-tip 20/G (Qiagen) columns. Subsequent purification of genomic DNA was carried out according to the Genomic-tips (Qiagen) protocol. The integrity of the extracted DNA was assessed by 1% agarose gel electrophoresis (30 V, 16 hours).
Genomic DNA was quantitated using PicoGreen dye (Molecular Probes) as described by Santos et al. (21), and 15 ng of each sample was used as a template for PCR reactions. PCR amplifications were performed as described by Santos et al. (21). In this assay, damage is detected as a decrease in amplification of the large genomic regions: lesions in a damaged template that significantly inhibit the progression of the polymerase will result in less PCR product, when the PCR reaction is performed quantitatively. A small mitochondrial target is also amplified to correct for any variation in mitochondrial genome copy number. Because the target is very small, the possible presence of lesions will not have a significant effect on amplification. Damage to nuclear DNA was measured using primers 48510 and 62007 to amplify a noncoding region 5′ of the β-globin gene (13.75 kb), and damage to the mitochondrial genome was measured using primers 14841 and 5999 (large target; 8.9 kb) and 14841 and 14620 (small target; 221 bp). PCR reaction mixtures and cycling conditions were essentially as described in Santos et al. (21); cycles of amplification were: β-globin, 26 cycles; large mitochondrial target, 18 cycles; small mitochondrial target, 19 cycles. PCR products were quantified with PicoGreen dye and a fluorescence plate reader, and lesion frequency was calculated by application of the Poisson distribution (22).
Preparation of cell samples for glutathione and TBARS assays
After about 1½ hours dark incubation, the medium containing hypericin was removed. The cells in each plate were flushed twice with PBS and suspended in 5 ml of the buffer. Directly after light exposure, an aliquot of 325 μl of PBS supernatant was taken from each dish and transferred to separate tubes that each contained 325 μl of a 5% solution of 5-sulfosalicylic acid (SSA). The tube contents were mixed vigorously and placed on ice for protein precipitation. After 5 min incubation the samples were centrifuged at 10000g for 5 min at 4°C. Two 250 μl volumes of each supernatant were transferred to separate tubes for an assay of extracellular total glutathione (GSx) and its oxidized form (GSSG), respectively, and placed on dry ice. The remaining volume of PBS was removed and 0.5 ml HCl (10 mM) was added to each plate. The cells were scraped out of each plate, transferred to separate tubes and each was diluted with the HCl solution to 1 ml. A 600 μl portion of each cell suspension was transferred to empty tubes for the TBARS assay (23) and placed on dry ice. The remaining cell suspensions were sonicated (Ultrasonic Homogenizer 4710 Series, Cole-Parmer instruments Co., Chicago, IL, USA) for 10 s and centrifuged at 10000g for 5 min at 4°C. Fifty microliters of each supernatant were transferred to separate empty tubes for a protein assay and frozen. To prepare samples for intracellular glutathione determination, 325 μl of each cell supernatant were transferred to separate tubes that each contained 325 μl of 5% SSA. The samples were treated in the same way as the sample assigned for external glutathione determination. All samples were stored in a −70°C freezer until the assays.
Determination of extracellular and intracellular glutathione
Both extra- and intracellular concentrations of GSx and GSSG were determined using the assay previously described by He et al. (24). The samples assigned for glutathione determination were thawed. A 200 μl aliquot of each previously prepared cell supernatant was placed in each of two empty tubes. Similarly, a 200 μl aliquot of each cell sample was transferred to separate empty tubes. Another 100 μl of each cell sample was added to 100 μl of a mixture of 5 mM HCl and 2.5% SSA. All samples were placed on ice. In the meantime standard solutions of the reduced form of glutathione (GSH) and GSSG were prepared. Then, 11 μl of 4 M triethanolamine solution were added to each tube to neutralize pH of the samples and mixed vigorously. To conjugate GSH, 4 μl of 2-vinylpyridine was added to each sample that was used for GSSG determination, mixed vigorously, and incubated at room temperature for an hour. A 96-well plate was prepared by pipetting 50 μl of standard or sample per well. Immediately, 100 μl of freshly prepared assay cocktail [12.45 ml of 0.1 M phosphate buffer (pH 7.5) containing 10 mM EDTA, 0.4 ml of 10 mM NADPH, 0.5 ml of 6 mM 5,5′-dithiobis-(2-nitrobenzoic acid) (DTNB), and 20 units of glutathione reductase (GR)] were added to each well. The plate was stored in the dark for 15 min and absorbance at 405 nm was measured in a GENios plate reader (Tecan US SPECTRAFluor Plus, Research Triangle Park, NC). The concentration of GSH was calculated as GSH = GSx – 2·GSSG. The cellular redox state of intracellular glutathione was expressed as the ratio GSH/GSSG.
TBARS assay
The modified thiobarbituric acid reactive substances (TBARS) assay was used for lipid peroxidation monitoring (25). Samples assigned for the TBARS assay were thawed. Twenty microliters of 4.4 mM butylated hydroxytoluene followed by 10.2 μl of 10 M NaOH were added to each cell suspension. The samples were shaken at 60°C for 30 min. After cooling down, 170 μl of a mixture of 38% trichloroacetic acid and 2% KI were added to each sample, which was then mixed and placed on ice for 10 min. Then the samples were centrifuged at 7000g for 10 min at 4°C. A 350 μl aliquot of each supernatant was transferred to a new tube containing the same volume of 0.66% 2-thiobarbituric acid. The samples were mixed and incubated at 95°C for 30 min, then allowed to cool to room temperature. Absorbance was then registered at 534 nm (εMDA = 157000 M−1cm−1) in a Hewlett Packard diode array 8453 spectrophotometer (Hewlett Packard GmbH, Waldbronn, Germany) using water as a reference.
Preparation of cell samples for determination of glutathione enzyme activity
After 1½ h of dark incubation with 10 μM hypericin, medium was removed from the plates. The cells in each plate were washed twice with PBS and 8 ml of the buffer was added. Cells were then exposed to light or kept in the dark. For immediate analysis (t=0) the supernatant was poured off; cells were scraped out directly after light exposure and suspended in 1 ml of ice-cold 0.1 M phosphate buffer (pH 7.0) containing 2 mM EDTA. To determine changes in enzyme activity over time, the PBS buffer used during irradiation was replaced with 4 ml of medium and cells were incubated in the dark at 37°C in a 5% CO2 / 95% air atmosphere for 0.5–4 h. Then after the incubation medium was removed, cells were washed twice with PBS, scraped out and suspended in the buffer as described above. Each cell suspension was homogenized using an Ultrasonic Homogenizer (Cole-Parmer, 4710 series) 3 times for 10 s each. Then all cell samples were centrifuged at 10000 g for 15 min at 4°C. The cell supernatants were transferred to empty tubes and frozen until assay.
Glutathione S-transferase (GST) activity determination
The assay was performed in a 96-well plate. First 150 μl of 0.1 M phosphate buffer (pH 6.5) containing 0.1% Triton-X were transferred to each well. Then 20 μl of aqueous solution of 10 mM GSH and the same volume of a cell sample were added. The reaction was initiated by injection of 10 μl of 10 mM 1-chloro-2,4-dinitrobenzene (CDNB) in ethanol to each well. Absorbance change with time was recorded in the GENios plate reader at 340 nm. GST activity expressed as the rate constant of formation of GSH and CDNB product was calculated using ε340 = 9600 M−1cm−1 and normalized to protein content.
Glutathione reductase activity determination
This assay was also performed in a 96-well plate. Ninety microliters of 75 mM phosphate buffer (pH 7.4) containing 1 mM EDTA (buffer-EDTA) were transferred to each well in the plate. Then 20 μl of 10 mM GSSG in buffer-EDTA were added, followed by 20 μl of a cell sample, and 50 μl of 10 mM DTNB in buffer-EDTA. Reaction was initiated by addition of 20 μl of 1 mM NADPH in buffer-EDTA to each well. The change in absorbance with time was recorded in the GENios plate reader at 415 nm. GR activity expressed as the rate constant of GSH and DTNB adduct formation was calculated using ε415 = 13900 M−1cm−1 and normalized to protein content.
Protein determination
Protein concentration was determined using bicinchoninic acid (BCA), Protein Assay Kit (Pierce, Rockford, IL, USA). The assays were carried out in 96-well plates. Absorbance of the samples was measured at 560 nm in the GENios plate reader. Bovine albumin was used as a standard.
Statistical analysis
Data are presented as average ± SD of three to six experiments.
RESULTS
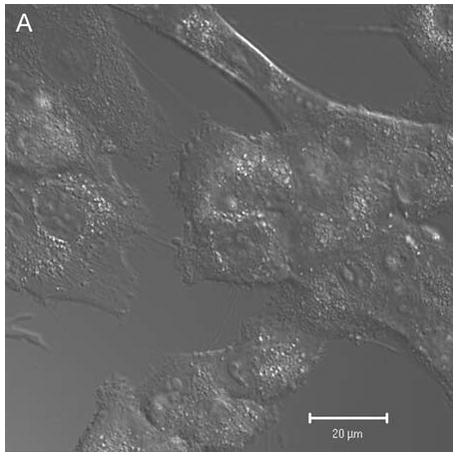
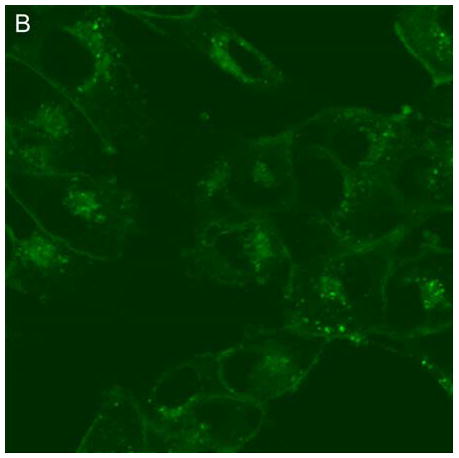
Confocal microscopy (ex 488 nm / em 505 nm) confirmed the uptake of hypericin in human retinal pigment epithelial cells and its accumulation within both surface and interior membranes. Hypericin was detected mainly in the Golgi apparatus and to some extent in cytoplasmic vesicles and the nuclear membrane. There was no evidence of hypericin uptake into the nucleus of the hRPE (Fig 1).
Figure 1.
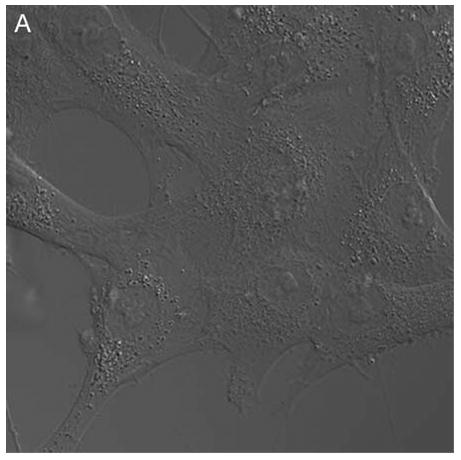
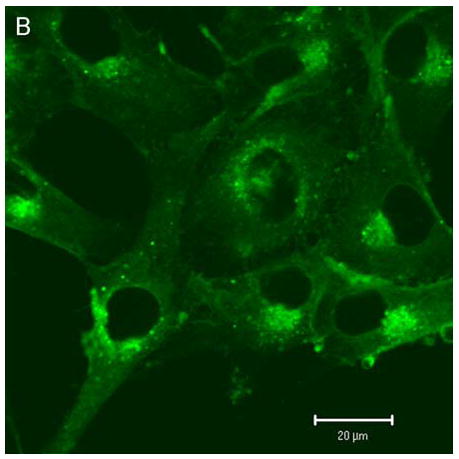
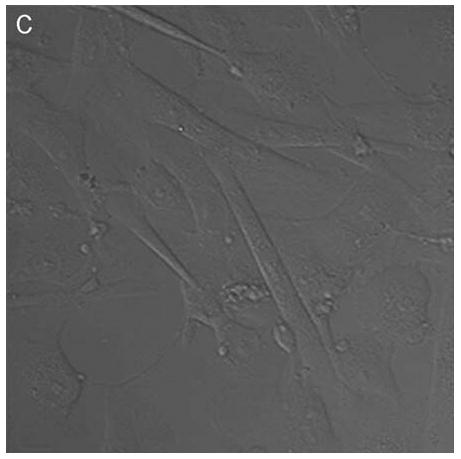
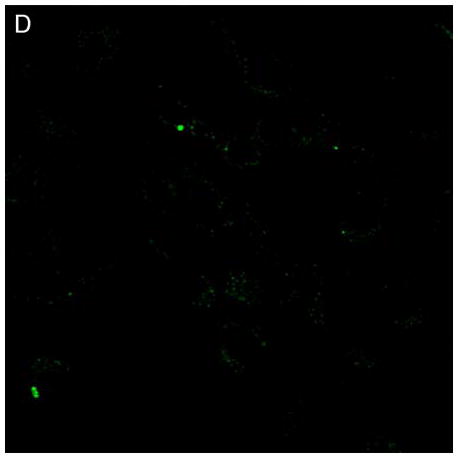
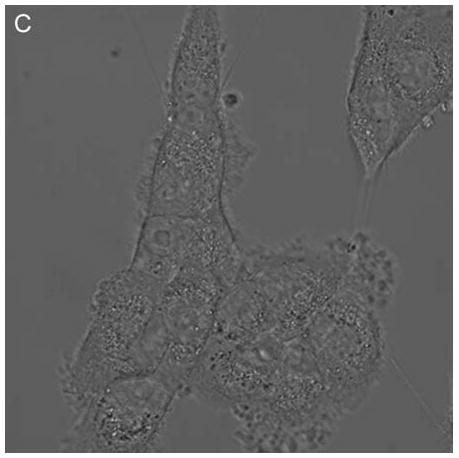
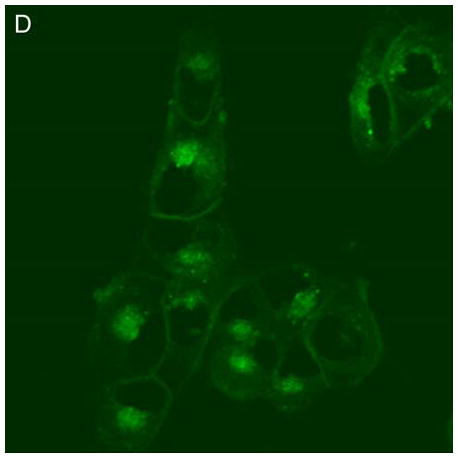
Hypericin is taken up by human RPE cells and localizes predominantly in the Golgi apparatus. Confocal images of human RPE cells that were preincubated for 1 h in medium containing 1 μM hypericin and 0.1% DMSO (A and B) or 0.1% DMSO (C and D), then washed and overlaid with in PBS/Gluc. Images A and C show cells observed by transmitted light and B and D by fluorescence emission at λem = 505 nm (λex = 488 nm) from the cells.
In control cells not incubated with hypericin, exposure of up to 10 min of visible light had no effect on cell density or morphology. A one-hour dark incubation of hRPE cells in the presence of 1 μM hypericin also had no effect on cell density or morphology (Fig. 1). The cells remained attached to the plate and retained their characteristic appearance. There was no detectable damage to the hRPE cells after a one-hour incubation with 0.5 μM hypericin (Fig. 2A, B) followed by 1 min exposure to visible light (Fig. 2C, D). However, a 3 min exposure caused some morphological changes (Fig. 2E, F) in the hRPE cells and after 10 min of illumination most cells were round and some were partially fragmented (Fig. 2G, H). Ten-minute irradiation of the cells had no effect on fluorescence intensity of hypericin and the chromophore binding to intracellular structures of hRPE cells (Fig. 2B, D, F, H).
Figure 2.
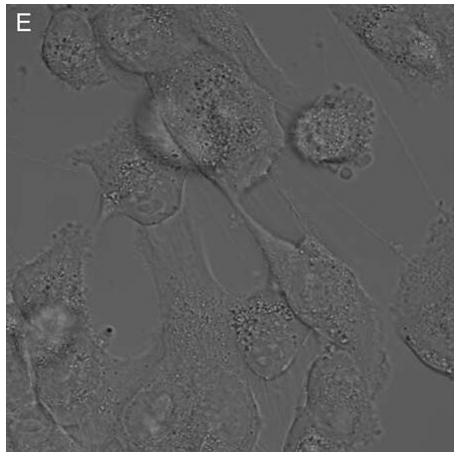
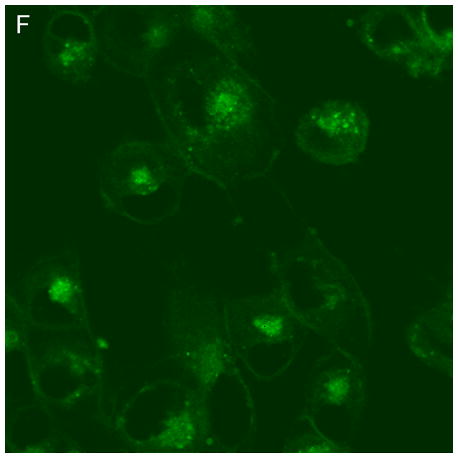
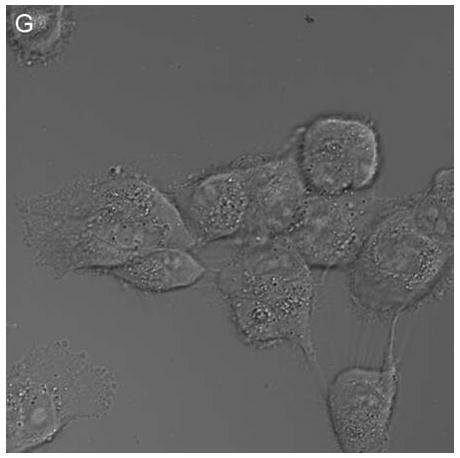
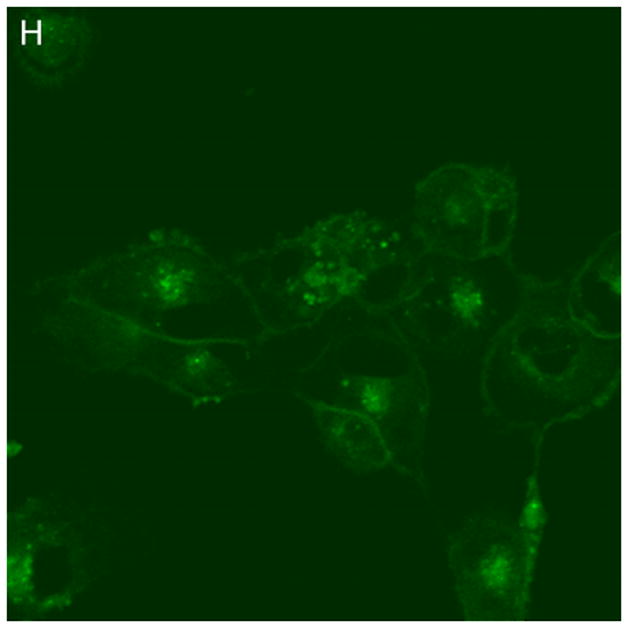
Visible light damages hypericin-exposed human RPE cells. After incubation in 0.5 μM hypericin, the cells were washed and overlaid with PBS/Gluc, and exposed to visible light (λ > 400 nm) for A and B) 0 min (dark control), C and D) 1 min, E and F) 3 min, and G and H) 10 min at a fluence rate of 12 W/m2. Images A, C, E, and G were recorded in transmitted light and images B, D, F, and H show fluorescence emission at λem = 505 nm (λex = 488 nm) from the cells.
When hRPE cells were treated with 0.1–10 μM hypericin and irradiated with visible light for 10 min, there was a dose dependent increase in the production of thiobarbituric acid reactive substances (TBARS) (Fig. 3), showing that lipid peroxidation had taken place.
Figure 3.
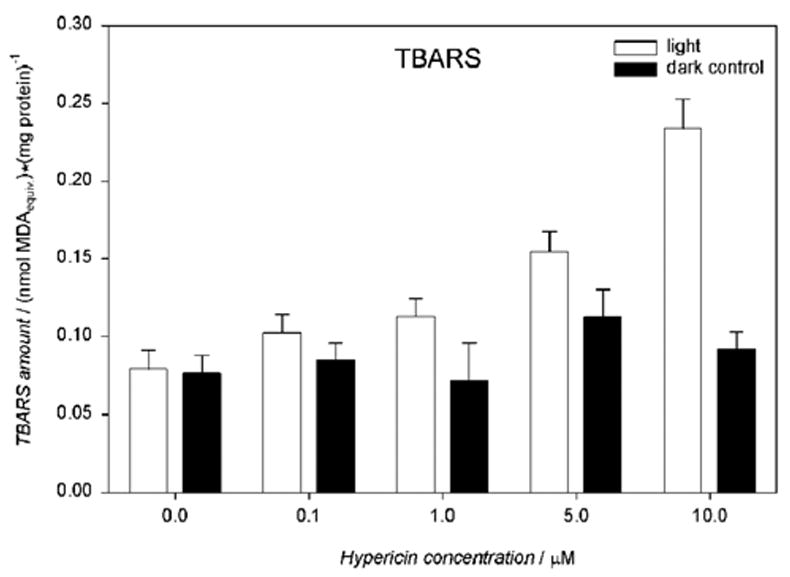
Visible light induces production of TBARS in hypericin-exposed human RPE cells. The cells were incubated in medium containing hypericin, washed twice and overlaid with PBS, exposed to light (λ > 400 nm, I = 10.8 W/m2) for 10 min, scraped off directly after irradiation and frozen until the assay. The TBARS concentration was expressed as malondialdehyde (MDA) equivalents and normalized to protein amount in the cells. Results are the average ± SD of three experiments.
Exposure to 1–10 μM hypericin and irradiation with visible light for 1–10 min caused a drug and light dose-dependent lactate dehydrogenase (LDH) leakage from the hRPE cells (Fig. 4).
Figure 4.
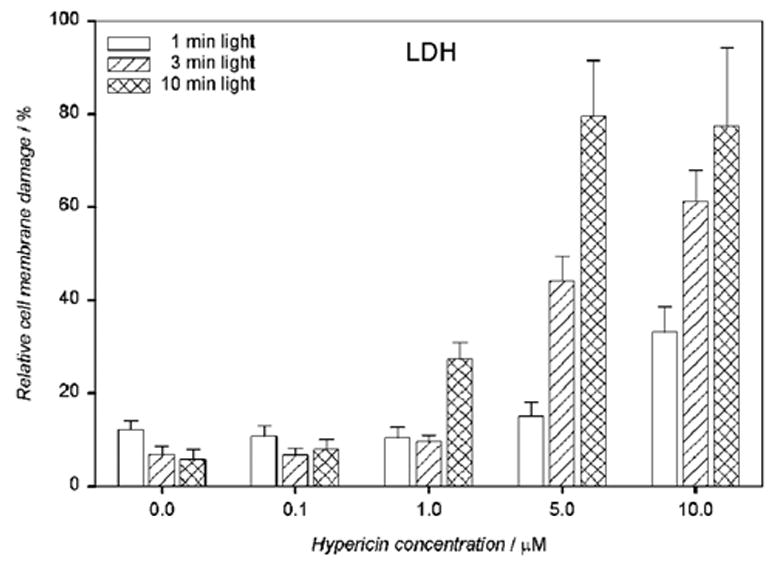
Visible light enhances cell membrane damage of human RPE cells containing hypericin as detected by LDH assay. The cells were incubated in the dark in medium containing 0.1–10 μM hypericin. Then they were washed twice and overlaid with PBS/Gluc, exposed to light (λ > 400 nm) at a fluence rate of 11.9 W/m2, and the buffer was replaced with medium. The cells were incubated in the dark at 37°C in a 5% CO2 / 95% air atmosphere for 16 hours before the LDH assay. Percentage cell membrane damage was normalized to the cells treated in the same way and lysed directly before the assay. Results are the average ± SD of six experiments.
When the hRPE cells were incubated at the highest dosages of hypercin (10 μM) and irradiated for 10 min, lactate dehydrogenase (LDH) leakage from the cells was observed after just 30 minutes (Fig. 5) and continued to increase during the 4 hours it was measured. Such increasing leakage indicates severe cell membrane damage.
Figure 5.
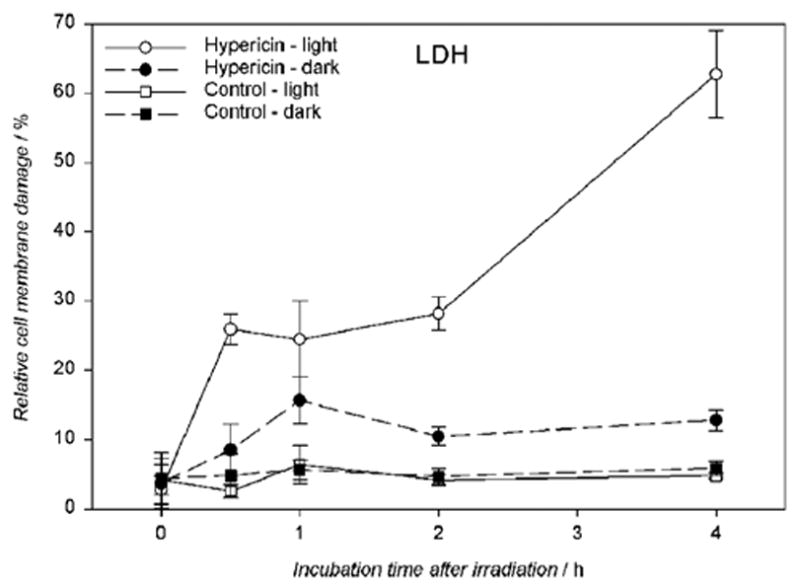
Visible light (λ > 400 nm) induces cell membrane damage in hypericin-exposed human RPE cells. The cells were incubated in the dark in medium containing 10 μM hypericin, washed twice and overlaid with PBS/Gluc, and irradiated for 10 min at a fluence rate of 11.6 W/m2. After light exposure the cells were assayed immediately for LDH or reincubated in medium in the dark at 37°C in a 5% CO2 / 95% air atmosphere for 0.5–4 hours before the LDH assay. Damage to the cell membrane is expressed as a percentage determined from membrane damage of treated cells divided by the total damage induced by lysis. Results are the average ± SD of six experiments.
Cells incubated with hypericin (0.1–10 μM) and irradiated for 10 min with visible light exhibited significantly decreased intracellular total glutathione (GSx), as determined immediately after irradiation (Fig. 6A). Increasing concentrations of hypericin in the light-exposed cells led to a decrease in intracellular reduced glutathione (52.7 – 25.9 nmol/mg protein) (Fig. 6B) with a concomitant increase in its oxidized form (1.3 – 3.1 nmol/mg protein) (Fig. 6C) and decreased redox status (Fig. 6D). When cells were incubated with hypericin (0.1–10 μM) in the dark, there was no change in intracellular total glutathione (GSx) levels (Fig. 6A).
Figure 6.
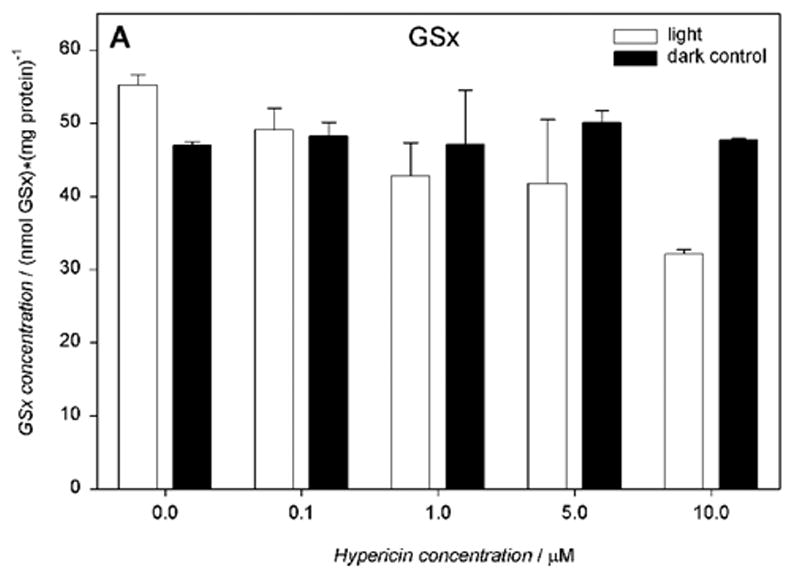
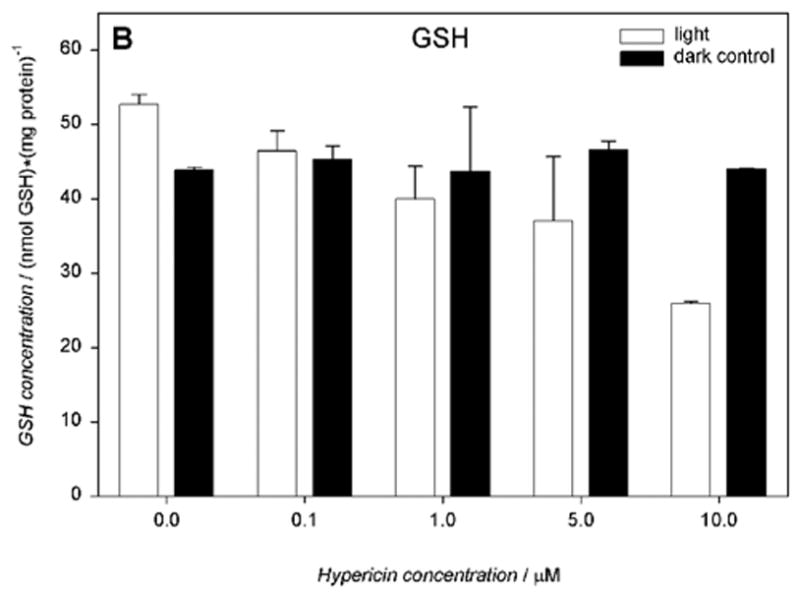
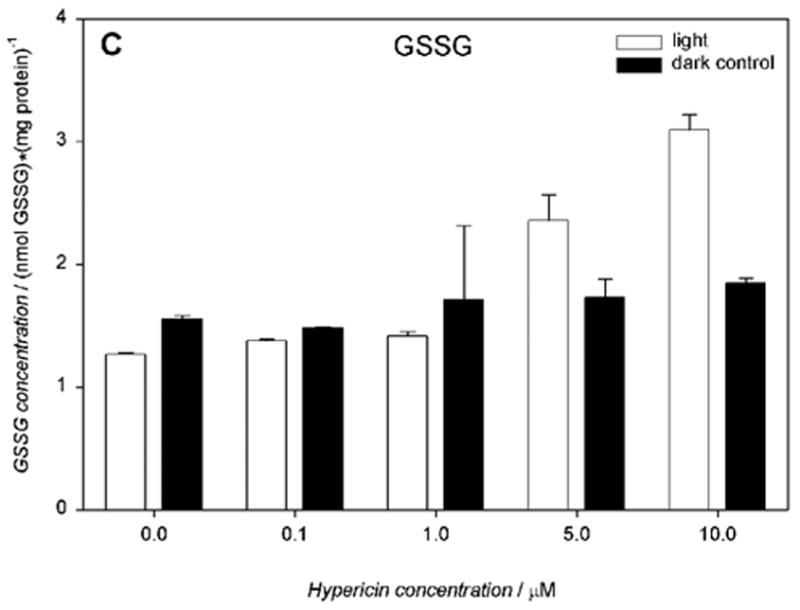
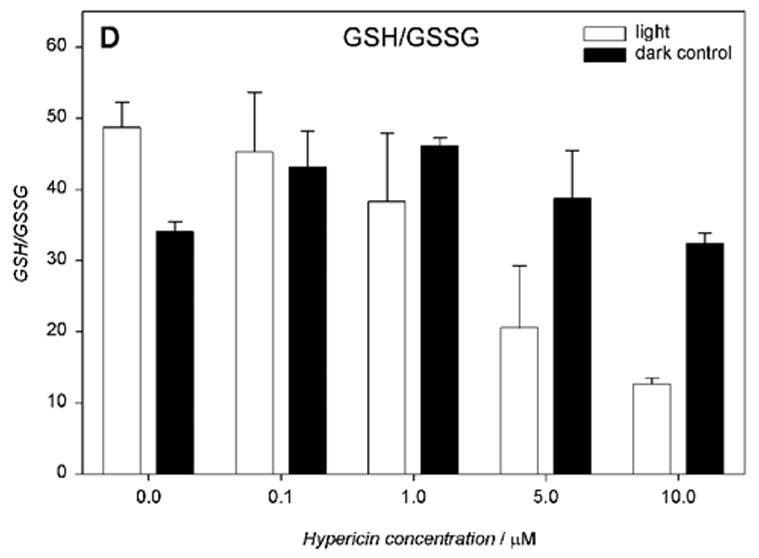
Visible light depletes and oxidizes intracellular glutathione: A) total (GSx), B) reduced (GSH), and C) oxidized (GSSG) form, and D) the redox state in human RPE cells. The cells were incubated with hypericin, washed twice and overlaid with PBS, exposed to light (λ > 400 nm, I = 10.8 W/m2) for 10 min, scraped off immediately after irradiation, and prepared for the assay. Glutathione concentration was normalized to protein content. Results are the average ± SD of six experiments.
Without hypericin, cells irradiated with visible light for 10 min underwent a slight increase in total glutathione levels (55.2 nmol/mg protein). The total glutathione levels in hRPE cells incubated in medium or suspended in PBS buffer in the dark were comparable (51.8 nmol/mg protein), with approximately 94% in the reduced form (data not shown).
Glutathione S-transferase activity (GST) was determined for hRPE cells incubated with 10 μM hypericin, irradiated for 10 min and measured at time points of 0 to 4 hours. There was no significant change in the GST activity between the treated and untreated hRPE cells (Fig.7A). However, when glutathione reductase (GR) activity was measured under the same conditions there was a distinct decrease in GR activity after 2 hour post-light-exposure incubation in medium (Fig.7B).
Figure 7.
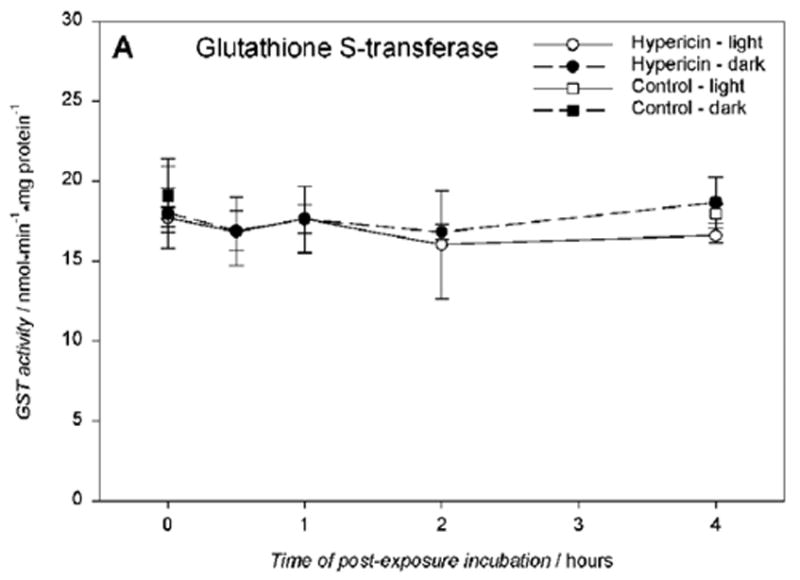
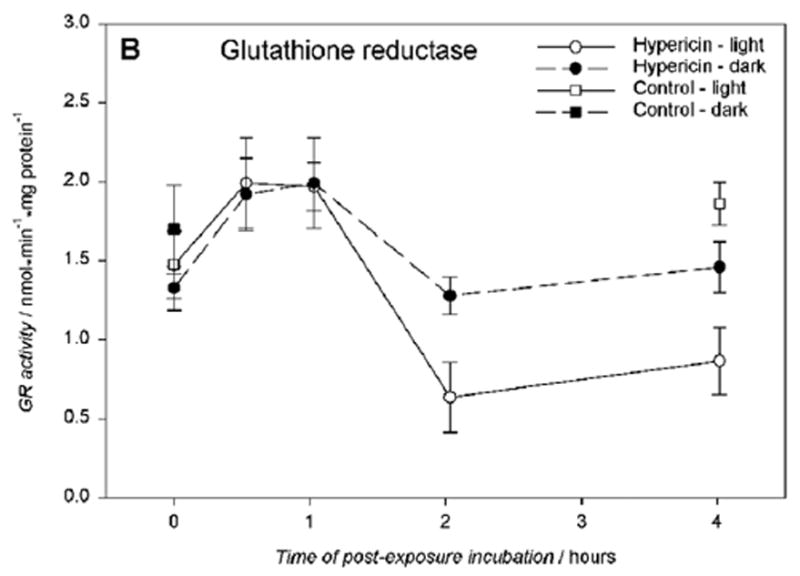
Glutathione S-transferase activity A) is unaffected, and glutathione reductase activity B) is reduced in hRPE cells exposed to 10 μM hypericin after 10 min visible light exposure. The cells were incubated in the dark in medium containing hypericin, washed twice and overlaid with PBS, and exposed to light (λ > 400 nm) at a fluence rate of 11.6 W/m2. Then the cells were scraped off directly after irradiation or reincubated in medium in the dark at 37°C in a 5% CO2 / 95% air atmosphere for 0.5–4 hours, scraped off, and frozen until the assays. The enzyme activities were normalized to protein content in the cells. Results are the average ± SD of five experiments.
Exposure to hypericin (1–10 μM) and then to visible light (1 – 10 min) caused a drug and light dose dependent sharp decline in mitochondrial function, as assayed by MTS reduction after overnight incubation in medium (Fig. 8).
Figure 8.
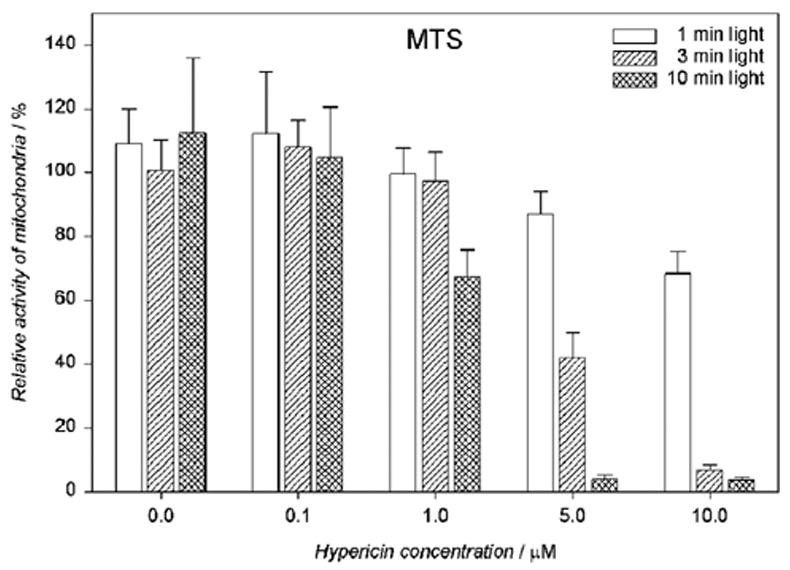
Mitochondrial activity is reduced in a dose-dependent fashion in human RPE cells exposed to hypericin and irradiated with visible light (λ > 400 nm). The cells were incubated in the dark in medium containing hypericin. Then they were washed twice and overlaid with PBS/Gluc, irradiated at a fluence rate of 11.9 W/m2, and the buffer was replaced with medium. The cells were incubated in the dark at 37°C in a 5% CO2 / 95% air atmosphere for 16 hours before the MTS assay. Percentage activities of mitochondria were normalized to control cells treated with hypericin but not irradiated. Results are the average ± SD of six experiments.
Mitochondrial activity also changed over time. When the hRPE cells were incubated with 10 μM hypericin, irradiated with visible light for 10 min, and re-incubated in medium for up to 4 hours there was a time dependent decrease in the MTS reduction rate (Fig. 9) that mimicked the lactate dehydrogenase (LDH) leakage from the cells (Fig. 5).
Figure 9.
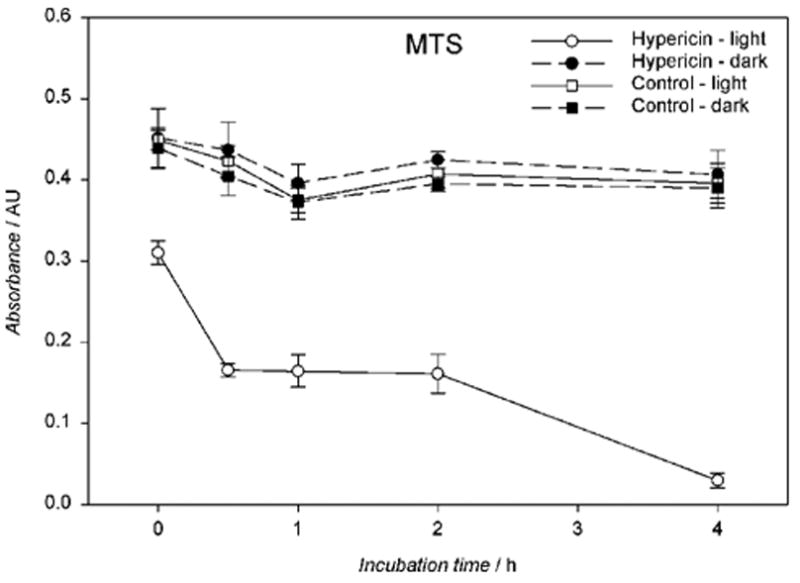
Visible light reduces mitochondrial activity in a time-dependent fashion in hypericin-exposed human RPE cells. The cells were incubated in the dark in medium containing 10 μM hypericin, washed twice and overlaid with PBS/Gluc, and exposed to light (λ > 400 nm) for 10 min at a fluence rate of 11.6 W/m2. After irradiation the cells assayed immediately for MTS or reincubated in medium in the dark at 37°C in a 5% CO2 / 95% air atmosphere for 0.5–4 hours before the MTS assay. Results are the average ± SD of six experiments.
Exposure of hRPE cells to visible light and/or hypericin did not result in a detectable increase in either mitochondrial or nuclear DNA lesions compared to untreated cells. This was assessed with the QPCR assay, which uses quantitative PCR to examine the formation and repair of induced DNA damage in an 8.9-kb mitochondrial fragment and a 13.7-kb fragment flanking the β-globin gene (26) (data not shown).
DISCUSSION
We have demonstrated that exposure of human retinal pigment epithelial cells to hypericin and visible light leads to an increase in polyunsaturated fatty acid oxidation and damage to the cell cytoplasmic membrane. Photoactivation of hypericin has also been found to induce either apoptosis or necrosis in HeLa cells (27) and lipid peroxidation in other cell lines (28–30). With age, increased lipid peroxidation exacerbates redox imbalance, leading to various chronic degenerative processes including vascular dysfunction (31). Lipid peroxidation is an important risk factor in the induction of retinal and choroidal neovascularization (wet macular degeneration) and diabetic retinopathy (32). The products of lipid peroxidation, particularly HNE (33) and AGE (34), are known to increase expression and secretion (35, 36) of the angiogenesis growth factor VEGF by RPE cells.
The results of research performed on human glioma cells in vitro showed that photoactivation of hypericin leads to a depletion of intracellular glutathione (37). In these studies, we found that the photooxidation of hRPE by hypericin induced an intracellular decrease in reduced glutathione (GSH) with a concomitant increase in its oxidized form (GSSG) and this was associated with lipid peroxidation (Fig. 10).
Figure 10.
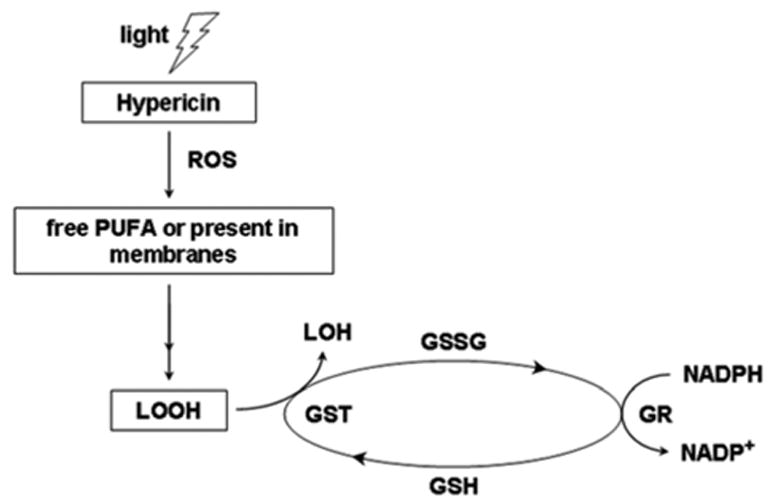
The scheme of lipid hydroperoxide (LOOH) detoxification by glutathione enzymes. Lipid hydroperoxides are normally reduced directly by glutathione S-transferase (GST) and indirectly by glutathione reductase (GR). However, photoactivation of hypericin in human retinal pigment epithelial (hRPE) cells down-regulated GR, leading to a lower level of reduced form of glutathione (GSH) and increased level of both the oxidized form of glutathione (GSSG) and lipid hydroperixides.
Any decrease in intracellular GSH induces oxidative stress in the hRPE cells (38). A decline of GSH in plasma or tissues has been associated with macular degeneration and diabetic retinopathy (39, 40). Glutathione S-transferase (GST) is involved in detoxification of lipid hydroperoxides (41). In vitro studies of human nasopharyngeal cancer cells determined that photoactivation by hypericin down-regulates GST (42). However, we did not find a similar down-regulation of GST induced by photoactivation of hypericin with hRPE cells. Glutathione reductase reduces oxidized glutathione (GSSG) to its reduced form GSH. In this case, photoactivation of hypericin has been found to down-regulate GR in hRPE cells. This may be one explanation for the reduced level of total GSH and the increased level of oxidized glutathione.
Although DNA fragmentation was previously observed in RPE cells exposed to 2.5–5 μM hypericin, then irradiated for an hour, and incubated in medium containing 1% FBS (11), the pattern was typical of apoptosis. However, in our studies despite a reduction in mitochondrial activity, exposure of hRPE cells to visible light and/or hypericin did not result in a detectable increase in either mitochondrial or nuclear DNA lesions compared with untreated cells. Visible light exposure of retinal pigment epithelial (11) and lens epithelial cells (12) pretreated with hypericin does induce apoptosis but probably through a lipid oxidation mechanism (43) rather than direct DNA damage.
In conclusion, we have determined that the photoactive component of St. John’s Wort, hypericin, induces oxidative stress and lipid peroxidation in human retinal pigment epithelial cells in vitro. There have been reports of the use of hypericin in conjunction with light therapy for treatment of depression (44). Hypericin is currently used as a diagnostic dye (45) and in photodynamic therapy for cancer (46) and ocular disorders (47). Because the level of hypericin reaching the RPE cells may be as high as 10 – 20 μM (47), these treatments may lead to oxidative damage in the eye which could lead to transient or permanent blindness. Because the maximal light doses utilized in this study were lower than the daily dose that reaches the human retina, the current findings herein suggest that further studies need to be pursued intensively to more fully characterize the in vivo RPE cellular responses to hypericin and light exposure. Therefore at the moment, when this drug is taken, the eye must be protected from bright sunlight or intense artificial UV and visible light to avoid transient or permanent damage to the eye (9).
Acknowledgments
This research was supported by the Intramural Research Program of the NIH, National Institute of Environmental Health Sciences. We wish to thank Ann Motten of NIEHS, NIH Research Triangle Park, North Carolina for help in preparation of this manuscript.
Footnotes
A part of the paper was presented at the Association for Research in Vision and Ophthalmology (ARVO) Annual Meeting on May 1st–5th, 2005 in Fort Lauderdale, FL and at the 3rd Annual NIEHS Science Award Day on October 31st, 2005 in Research Triangle Park, NC
References
- 1.Vitiello B. Hypericum perforatum extracts as potential antidepressants. J Pharm Pharmacol. 1999;51:513–517. doi: 10.1211/0022357991772781. [DOI] [PubMed] [Google Scholar]
- 2.Whiskey E, Werneke U, Taylor D. A systematic review and meta-analysis of Hypericum perforatum in depression: a comprehensive clinical review. Int Clin Psychopharmacol. 2001;16:239–252. doi: 10.1097/00004850-200109000-00001. [DOI] [PubMed] [Google Scholar]
- 3.Final report on the safety assessment of Hypericum perforatum extract and Hypericum perforatum oil. Int J Toxicol. 2001;20:31–39. doi: 10.1080/10915810160233749. [DOI] [PubMed] [Google Scholar]
- 4.Schempp CM, Winghofer B, Langheinrich M, Schopf E, Simon JC. Hypericin levels in human serum and interstitial skin blister fluid after oral single-dose and steady-state administration of Hypericum perforatum extract (St. John’s wort) Skin Pharmacol Appl Skin Physiol. 1999;12:299–304. doi: 10.1159/000066256. [DOI] [PubMed] [Google Scholar]
- 5.Higuchi AH, Yamada H, Yamada E, Matsumura M. Inhibitory effect of hypericin on retinal and choroidal neovascularization. Invest Ophtalmol Vis Sci. 2003;44:E-Abstract 554. [Google Scholar]
- 6.Ehrenberg B, Anderson JL, Foote CS. Kinetics and yield of singlet oxygen photosensitized by hypericin in organic and biological media. Photochem Photobiol. 1998;68:135–140. [PubMed] [Google Scholar]
- 7.Gulick RM, McAuliffe V, Holden-Wiltse J, Crumpacker C, Liebes L, Stein DS, Meehan P, Hussey S, Forcht J, Valentine FT. Phase I studies of hypericin, the active compound in St. John’s Wort, as an antiretroviral agent in HIV-infected adults. AIDS Clinical Trials Group Protocols 150 and 258. Ann Intern Med. 1999;130:510–514. doi: 10.7326/0003-4819-130-6-199903160-00015. [DOI] [PubMed] [Google Scholar]
- 8.Cotterill JA. Severe phototoxic reaction to laser treatment in a patient taking St John’s Wort. J Cosmet Laser Ther. 2001;3:159–160. doi: 10.1080/147641701753414988. [DOI] [PubMed] [Google Scholar]
- 9.Roberts JE. Screening for ocular phototoxicity. Int J Toxicol. 2002;21:491–500. doi: 10.1080/10915810290169918. [DOI] [PubMed] [Google Scholar]
- 10.Barker FM, Brainard GC, Dayhaw-Barker P. Transmission of the human lens as a function of age. Invest Ophthalmol Vis Sci. 1991;32S:1083. [Google Scholar]
- 11.Harris MS, Sakamoto T, Kimura H, He S, Spee C, Gopalakrishna R, Gundimeda U, Yoo JS, Hinton DR, Ryan SJ. Hypericin inhibits cell growth and induces apoptosis in retinal pigment epithelial cells: possible involvement of protein kinase C. Curr Eye Res. 1996;15:255–262. doi: 10.3109/02713689609007619. [DOI] [PubMed] [Google Scholar]
- 12.He YY, Chignell CF, Miller DS, Andley UP, Roberts JE. Phototoxicity in human lens epithelial cells promoted by St. John’s Wort. Photochem Photobiol. 2004;80:583–586. doi: 10.1562/0031-8655(2004)080<0583:PIHLEC>2.0.CO;2. [DOI] [PubMed] [Google Scholar]
- 13.Sgarbossa A, Angelini N, Gioffre D, Youssef T, Lenci F, Roberts JE. The uptake, location and fluorescence of hypericin in bovine intact lens. Curr Eye Res. 2000;21:597–601. [PubMed] [Google Scholar]
- 14.Taroni P, Valentini G, Comelli D, D’Andrea C, Cubeddu R, Hu DN, Roberts JE. Time-resolved microspectrofluorimetry and fluorescence lifetime imaging of hypericin in human retinal pigment epithelial cells. Photochem Photobiol. 2005;81:524–528. doi: 10.1562/2004-11-30-IR-385. [DOI] [PubMed] [Google Scholar]
- 15.Sgarbossa A, Youssef T, Lenci F. Photosensitized structural modifications of the lens protein alpha-crystallin: do all modifications impair chaperone-like activity? Photochem Photobiol. 2003;77:567–571. doi: 10.1562/0031-8655(2003)077<0567:psmotl>2.0.co;2. [DOI] [PubMed] [Google Scholar]
- 16.Schey KL, Patat S, Chignell CF, Datillo M, Wang RH, Roberts JE. Photooxidation of lens alpha-crystallin by hypericin (active ingredient in St. John’s Wort) Photochem Photobiol. 2000;72:200–203. doi: 10.1562/0031-8655(2000)072<0200:polcbh>2.0.co;2. [DOI] [PubMed] [Google Scholar]
- 17.Wahlman J, Hirst M, Roberts JE, Prickett CD, Trevithick JR. Focal length variability and protein leakage as tools for measuring photooxidative damage to the lens. Photochem Photobiol. 2003;78:88–92. doi: 10.1562/0031-8655(2003)078<0088:flvapl>2.0.co;2. [DOI] [PubMed] [Google Scholar]
- 18.Hu DN, Savage HE, Roberts JE. Uveal melanocytes, ocular pigment epithelium, and Mueller cells in culture: in vitro toxicology. Int J Toxicol. 2002;21:465–472. doi: 10.1080/10915810290169891. [DOI] [PubMed] [Google Scholar]
- 19.Hu DN, McCormick SA, Ritch R, Pelton-Henrion K. Studies of human uveal melanocytes in vitro: isolation, purification and cultivation of human uveal melanocytes. Invest Ophthalmol Vis Sci. 1993;34:2210–2219. [PubMed] [Google Scholar]
- 20.Sliney DH. How light reaches the eye and its components. Int J Toxicol. 2002;21:501–509. doi: 10.1080/10915810290169927. [DOI] [PubMed] [Google Scholar]
- 21.Santos JH, Mandavilli BS, Van Houten B. Measuring oxidative mtDNA damage and repair using quantitative PCR. Methods Mol Biol. 2002;197:159–176. doi: 10.1385/1-59259-284-8:159. [DOI] [PubMed] [Google Scholar]
- 22.Ayala-Torres S, Chen Y, Svoboda T, Rosenblatt J, Van Houten B. Analysis of gene-specific DNA damage and repair using quantitative polymerase chain reaction. Methods. 2000;22:135–147. doi: 10.1006/meth.2000.1054. [DOI] [PubMed] [Google Scholar]
- 23.Janero DR. Malondialdehyde and thiobarbituric acid-reactivity as diagnostic indices of lipid peroxidation and peroxidative tissue injury. Free Radic Biol Med. 1990;9:515–540. doi: 10.1016/0891-5849(90)90131-2. [DOI] [PubMed] [Google Scholar]
- 24.He YY, Huang JL, Ramirez DC, Chignell CF. Role of reduced glutathione efflux in apoptosis of immortalized human keratinocytes induced by UVA. J Biol Chem. 2003;278:8058–8064. doi: 10.1074/jbc.M207781200. [DOI] [PubMed] [Google Scholar]
- 25.Hong YL, Yeh SL, Chang CY, Hu ML. Total plasma malondialdehyde levels in 16 Taiwanese college students determined by various thiobarbituric acid tests and an improved high-performance liquid chromatography-based method. Clin Biochem. 2000;33:619–625. doi: 10.1016/s0009-9120(00)00177-6. [DOI] [PubMed] [Google Scholar]
- 26.Yakes FM, Van Houten B. Mitochondrial DNA damage is more extensive and persists longer than nuclear DNA damage in human cells following oxidative stress. Proc Natl Acad Sci U S A. 1997;94:514–519. doi: 10.1073/pnas.94.2.514. [DOI] [PMC free article] [PubMed] [Google Scholar]
- 27.Vantieghem A, Assefa Z, Vandenabeele P, Declercq W, Courtois S, Vandenheede JR, Merlevede W, de Witte P, Agostinis P. Hypericin-induced photosensitization of HeLa cells leads to apoptosis or necrosis: Involvement of cytochrome c and procaspase-3 activation in the mechanism of apoptosis. FEBS Lett. 1998;440:19–24. doi: 10.1016/s0014-5793(98)01416-1. [DOI] [PubMed] [Google Scholar]
- 28.Hadjur C, Richard MJ, Parat MO, Jardon P, Favier A. Photodynamic effects of hypericin on lipid peroxidation and antioxidant status in melanoma cells. Photochem Photobiol. 1996;64:375–381. doi: 10.1111/j.1751-1097.1996.tb02474.x. [DOI] [PubMed] [Google Scholar]
- 29.Andreoni A, Colasanti A, Colasanti P, Mastrocinque M, Riccio P, Roberti G. Laser photosensitization of cells by hypericin. Photochem Photobiol. 1994;59:529–533. doi: 10.1111/j.1751-1097.1994.tb02978.x. [DOI] [PubMed] [Google Scholar]
- 30.Du HY, Olivo M, Tan BK, Bay BH. Hypericin-mediated photodynamic therapy induces lipid peroxidation and necrosis in nasopharyngeal cancer. Int J Oncol. 2003;23:1401–1405. [PubMed] [Google Scholar]
- 31.Lee JY, Je JH, Kim DH, Chung SW, Zou Y, Kim ND, Ae Yoo M, Suck Baik H, Yu BP, Chung HY. Induction of endothelial apoptosis by 4-hydroxyhexenal. Eur J Biochem. 2004;271:1339–1347. doi: 10.1111/j.1432-1033.2004.04042.x. [DOI] [PubMed] [Google Scholar]
- 32.Hardy P, Beauchamp M, Sennlaub F, Gobeil F, Jr, Tremblay L, Mwaikambo B, Lachapelle P, Chemtob S. New insights into the retinal circulation: inflammatory lipid mediators in ischemic retinopathy. Prostaglandins Leukot Essent Fatty Acids. 2005;72:301–325. doi: 10.1016/j.plefa.2005.02.004. [DOI] [PubMed] [Google Scholar]
- 33.Ayalasomayajula SP, Kompella UB. Induction of vascular endothelial growth factor by 4-hydroxynonenal and its prevention by glutathione precursors in retinal pigment epithelial cells. Eur J Pharmacol. 2002;449:213–220. doi: 10.1016/s0014-2999(02)02043-5. [DOI] [PubMed] [Google Scholar]
- 34.Fu MX, Requena JR, Jenkins AJ, Lyons TJ, Baynes JW, Thorpe SR. The advanced glycation end product, Nepsilon-(carboxymethyl)lysine, is a product of both lipid peroxidation and glycoxidation reactions. J Biol Chem. 1996;271:9982–9986. doi: 10.1074/jbc.271.17.9982. [DOI] [PubMed] [Google Scholar]
- 35.Lu M, Kuroki M, Amano S, Tolentino M, Keough K, Kim I, Bucala R, Adamis AP. Advanced glycation end products increase retinal vascular endothelial growth factor expression. J Clin Invest. 1998;101:1219–1224. doi: 10.1172/JCI1277. [DOI] [PMC free article] [PubMed] [Google Scholar]
- 36.Treins C, Giorgetti-Peraldi S, Murdaca J, Van Obberghen E. Regulation of vascular endothelial growth factor expression by advanced glycation end products. J Biol Chem. 2001;276:43836–43841. doi: 10.1074/jbc.M106534200. [DOI] [PubMed] [Google Scholar]
- 37.Miccoli L, Beurdeley-Thomas A, De Pinieux G, Sureau F, Oudard S, Dutrillaux B, Poupon MF. Light-induced photoactivation of hypericin affects the energy metabolism of human glioma cells by inhibiting hexokinase bound to mitochondria. Cancer Res. 1998;58:5777–5786. [PubMed] [Google Scholar]
- 38.Jiang S, Moriarty-Craige SE, Orr M, Cai J, Sternberg P, Jr, Jones DP. Oxidant-induced apoptosis in human retinal pigment epithelial cells: dependence on extracellular redox state. Invest Ophthalmol Vis Sci. 2005;46:1054–1061. doi: 10.1167/iovs.04-0949. [DOI] [PubMed] [Google Scholar]
- 39.Coral K, Raman R, Rathi S, Rajesh M, Sulochana KN, Angayarkanni N, Paul PG, Ramakrishnan S. Plasma homocysteine and total thiol content in patients with exudative age-related macular degeneration. Eye. 2006;20:203–207. doi: 10.1038/sj.eye.6701853. [DOI] [PubMed] [Google Scholar]
- 40.Samiec PS, Drews-Botsch C, Flagg EW, Kurtz JC, Sternberg P, Jr, Reed RL, Jones DP. Glutathione in human plasma: decline in association with aging, age-related macular degeneration, and diabetes. Free Radic Biol Med. 1998;24:699–704. doi: 10.1016/s0891-5849(97)00286-4. [DOI] [PubMed] [Google Scholar]
- 41.Ketterer B, Meyer DJ. Glutathione transferases: a possible role in the detoxication and repair of DNA and lipid hydroperoxides. Mutat Res. 1989;214:33–40. doi: 10.1016/0027-5107(89)90195-4. [DOI] [PubMed] [Google Scholar]
- 42.Du HY, Olivo M, Tan BK, Bay BH. Photoactivation of hypericin down-regulates glutathione S-transferase activity in nasopharyngeal cancer cells. Cancer Lett. 2004;207:175–181. doi: 10.1016/j.canlet.2003.12.024. [DOI] [PubMed] [Google Scholar]
- 43.Poli G, Schaur RJ. 4-Hydroxynonenal in the pathomechanisms of oxidative stress. IUBMB Life. 2000;50:315–321. doi: 10.1080/713803726. [DOI] [PubMed] [Google Scholar]
- 44.Wheatley D. Hypericum in seasonal affective disorder (SAD) Curr Med Res Opin. 1999;15:33–37. doi: 10.1185/03007999909115171. [DOI] [PubMed] [Google Scholar]
- 45.Zaak D, Karl A, Knuchel R, Stepp H, Hartmann A, Reich O, Bachmann A, Siebels M, Popken G, Stief C. Diagnosis of urothelial carcinoma of the bladder using fluorescence endoscopy. BJU Int. 2005;96:217–222. doi: 10.1111/j.1464-410X.2005.05604.x. [DOI] [PubMed] [Google Scholar]
- 46.Huygens A, Kamuhabwa AR, Van Laethem A, Roskams T, Van Cleynenbreugel B, Van Poppel H, Agostinis P, De Witte PA. Enhancing the photodynamic effect of hypericin in tumour spheroids by fractionated light delivery in combination with hyperoxygenation. Int J Oncol. 2005;26:1691–1697. [PubMed] [Google Scholar]
- 47.Weinberger D, Ron Y, Lusky M, Gaaton D, Orenstein A, Blank M, Mandel M, Livnat T, Barliya T, Lavie G. Competitive quenching: a possible novel approach in protecting RPE cells from damage during PDT. Curr Eye Res. 2005;30:269–277. doi: 10.1080/02713680590927597. [DOI] [PubMed] [Google Scholar]