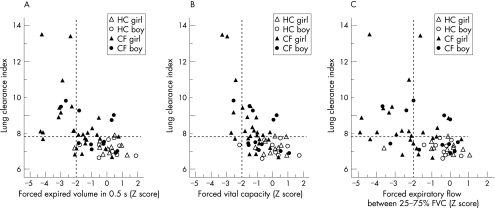
Figure 2 Relationship between lung clearance index (LCI) and (A) FEV0.5 Z score, (B) FVC Z score and (C) FEF25–75 Z score according to disease status and sex. The dashed horizontal line represents the upper range of normality for LCI in healthy infants.1 The dashed vertical line represents the lower 95% limit of normality (ie, only 2.5% of healthy controls have Z scores below this level) for FEV0.5, FVC and FEF25–75. Any results to the left of this line are unusually low. FEFV Z scores were calculated from published reference equations.26 Infants in the right lower quadrant had normal results from both tests. This included all but one of the healthy controls who had an unusually low FEF25–75. Those in the left upper quadrant had abnormal results from both tests. Those in the right upper quadrant had abnormally high LCI but normal forced expiratory parameters, whereas those in the lower left quadrant had LCI within normal limits but diminished FEV or FEF parameters. Diminished flows in the presence of a normal LCI were predominantly observed among girls, and those with recent cough (see also fig E3 available online at http://thorax.bmj.com/supplemental. HC, healthy control; CF, cystic fibrosis.

An official website of the United States government
Here's how you know
Official websites use .gov
A
.gov website belongs to an official
government organization in the United States.
Secure .gov websites use HTTPS
A lock (
) or https:// means you've safely
connected to the .gov website. Share sensitive
information only on official, secure websites.
