Abstract
To investigate the physiological function of syntaxin 4 in the regulation of GLUT4 vesicle trafficking, we used homologous recombination to generate syntaxin 4–knockout mice. Homozygotic disruption of the syntaxin 4 gene results in early embryonic lethality, whereas heterozygous knockout mice, Syn4+/–, had normal viability with no significant impairment in growth, development, or reproduction. However, the Syn4+/– mice manifested impaired glucose tolerance with a 50% reduction in whole-body glucose uptake. This defect was attributed to a 50% reduction in skeletal muscle glucose transport determined by 2-deoxyglucose uptake during hyperinsulinemic-euglycemic clamp procedures. In parallel, insulin-stimulated GLUT4 translocation in skeletal muscle was also significantly reduced in these mice. In contrast, Syn4+/– mice displayed normal insulin-stimulated glucose uptake and metabolism in adipose tissue and liver. Together, these data demonstrate that syntaxin 4 plays a critical physiological role in insulin-stimulated glucose uptake in skeletal muscle. Furthermore, reduction in syntaxin 4 protein levels in this tissue can account for the impairment in whole-body insulin-stimulated glucose metabolism in this animal model.
Introduction
It is well known that skeletal muscle and adipose tissue are the major in vivo sites responsible for insulin-stimulated glucose disposal (1–4). In these tissues, the clearance of circulating glucose is dependent on the insulin-stimulated translocation of the GLUT4 glucose transporter protein isoform to the cell surface (5–10). In the basal non–insulin-stimulated state, the majority of the GLUT4 proteins reside in poorly defined intracellular compartments sequestered away from the general membrane recycling system (11–16). However, insulin stimulation generates a complex series of signaling events that ultimately results in a rapid redistribution of these sequestered GLUT4 proteins to the plasma membrane, thereby increasing the rate of glucose uptake. Disruption of any step of this process results in an impairment of GLUT4 translocation and hence insulin resistance, which is an important factor contributing to the development of type 2 diabetes (17–20).
The mechanism of GLUT4 translocation shares several important features with the exocytosis of synaptic vesicles during neurotransmitter release (21–23). In particular, the insulin-stimulated plasma membrane docking and fusion of GLUT4 vesicles appears to require specific interactions between the plasma membrane t-SNARE proteins syntaxin 4 and SNAP23 with the GLUT4 vesicle v-SNARE protein VAMP2 (24–31). For example, previous studies have demonstrated that introduction of either syntaxin 4–specific Ab’s or blocking peptides inhibited insulin-stimulated GLUT4 translocation (26–28, 32). This inhibition was apparently specific because the introduction of a dominant-interfering form of syntaxin 4, but not syntaxin 3, prevented GLUT4 translocation (25). Furthermore, the dominant-interfering function of this truncated syntaxin 4 protein required the presence of the VAMP2-binding site of syntaxin 4. Taken together, these data provide strong evidence that syntaxin 4 is part of the protein machinery required for insulin-stimulated GLUT4 translocation in cultured adipocytes.
In contrast to cultured adipocytes, there have been no in vivo studies on the functional role of syntaxin 4 in skeletal muscle. Therefore, to examine the physiological function of syntaxin 4 in GLUT4 translocation, we used homologous recombination to generate mice with a disruption of the syntaxin 4 gene. In this study, we demonstrate that heterozygotic syntaxin 4–knockout mice, syn4+/–, develop impaired whole-body insulin-stimulated glucose disposal. The in vivo glucose transport activity in skeletal muscle was decreased by 50% compared with that of wild-type animals, suggesting that syntaxin 4 protein levels play an essential role in insulin-stimulated glucose transport and GLUT4 translocation in skeletal muscle.
Methods
Isolation of murine syntaxin 4 genomic clone.
The full-length 1.6-kb rat syntaxin 4 cDNA containing the 0.9-kb open reading frame (kindly provided by Richard Scheller, Stanford University, Palo Alto, California, USA) was sequenced to confirm the identity of the clone and to obtain the 5′- and 3′-untranslated sequences not present in the databases. A panel of PCR oligonucleotide primers were designed encompassing the entire syntaxin 4 cDNA (designated A–H). PCR amplification of mouse liver DNA using the D/H primer pair (D primer: 5′-TAGCGCTAGAGAATCAGAAG; H primer: 5′-CAAACAGGACATTGGAAACT) yielded a product of 467 bp, slightly larger than the 311-bp D/H product from the cDNA, indicating the presence of intronic sequences. The genomic D/H product was subcloned, sequenced, and its identity as part of the mouse syntaxin 4 gene confirmed by basic local alignment search tool (BLAST) analysis. The D and H primers were then sent to Genome Systems Inc. (St. Louis, Missouri, USA), where a PCR-based screen of a murine 129/Sv/J library yielded an approximately120-kb bacterial artificial chromosome (BAC) clone containing the syntaxin 4 gene. Seventeen kilobases of the syntaxin 4 genomic sequence from the clone were analyzed and found to contain the entire syntaxin 4 gene, comprising 11 exons and spanning approximately 7 kb of genomic sequence.
Generation of the syntaxin 4 targeting vector.
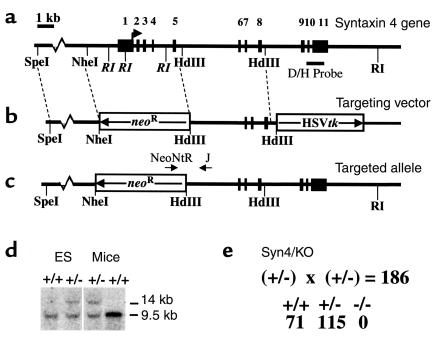
The syntaxin 4 targeting vector, pSYN4-KO, was constructed using the positive-negative selection cassettes derived from the vectors pPolII long neo bpA and pXhoMC1TK, containing the neoR and HSVtk genes, respectively. The 3-kb HindIII-HindIII 3′ arm of homology was inserted into the HindIII site of pPolII long neo bpA just 5′ to the neoR cassette. The 2.8-kb SpeI-NheI 5′ arm of homology was then inserted into the SpeI site 3′ to the neoR cassette. To allow screening of targeted embryonic stem (ES) cell clones using EcoRI, it was then necessary to mutate the single EcoRI site in the neoR cassette by insertion of an RI/Spe/RI adapter made by annealing phosphorylated primers with sequences 5′-AATTGACTAGTC and 5′-AATTGACTAGTC. The vector was then cut with SalI and the XhoI-XhoI pXhoMC1TK fragment containing the HSVtk cassette was inserted just 3′ to the 3′ arm of homology. The orientation of all inserts was confirmed by restriction analysis and sequencing. The mutant gene lacked 3.3 kb, which included the 5′-UTR, exons 1, 2, 3, 4, 5 and introns 1, 2, 3, 4 (Figure 1), thereby deleting the first 126 amino acids of syntaxin 4.
Figure 1.
Generation of heterozygous syntaxin 4–knockout mouse by homologous recombination in ES cells. (a) Schematic representation of the syntaxin 4 genomic structure: Exons 1–11 are represented by the numbered, filled boxes. The relative position of the diagnostic probe is also indicated as are the translational start and stop sites at exons 1 and 10, respectively. (b) Schematic representation of the syntaxin 4 targeting vector. The 2.8-kb SpeI-NheI fragment (5′-homology) and the 3.0-kb HindIII-HindIII fragment (3′-homology) that allowed homologous recombination with the genomic locus are indicated as is the neoR gene, which replaced exons 1–5. The thymidine kinase gene is labeled HSVtk. (c) Schematic representation of the targeted syntaxin 4 allele. (d) Southern blot analysis of ES and mouse liver DNA digested with EcoRI (RI) and probed with the diagnostic D/H probe indicated. The wild-type allele generates a 9.5-kb EcoRI fragment, whereas the targeted allele produces a 14-kb EcoRI fragment. (e) Homozygotic disruption of the syntaxin 4 gene causes embryonic lethality. The total number of heterozygotic crosses (186 births) resulting in the three genotypes are indicated.
Generation of syntaxin 4–knockout mice.
The targeting construct was linearized with NotI and introduced into 2 × 10⁷ pluripotent mouse ES cells (clone R1) by electroporation (Bio-Rad Gene Pulser; Bio-Rad Laboratories Inc., Hercules, California, USA). ES cell clones that were G418/gancyclovir–resistant were isolated, amplified, and screened for targeting fidelity by using Southern blot analysis. Five targeted clones were obtained from 96 analyzed. The five clones were subsequently reconfirmed by Southern blot analysis, and the single targeting event was also confirmed by hybridizing the EcoRI-digested DNA with a neoR probe. Cells from two targeted clones (V19 and V52) were microinjected into C57BL/6J blastocysts and implanted into pseudopregnant recipients. Chimeric animals resulting from the microinjections were bred to C57BL/6J mice, and agouti pups were screened for germline transmission of the mutant allele. The genotypes from these matings and all subsequent matings were determined by PCR on DNA from tail-biopsy specimens. The following oligonucleotide primers were used: Neo-NTR (primer 1), 5′-GAGCAGCCGATTGTCTGTTG; syntaxin 4-C (primer 2), 5′-CACAAGAATGAAGAAAACCC; syntaxin 4-J (primer 3), 5′-CAAGGATGTGCTCTGGAAGG. Southern blot analysis was periodically performed to confirm the fidelity of the PCR. We have obtained identical results from both targeted lines (V19 and V52). Analysis thus far has been carried out on the hybrid C57BL/6-129/Sv/J background. All mice were housed in the animal care unit of the University of Iowa College of Medicine according to animal care guidelines. The clamp studies (described below), were approved by the Yale University Animal Use and Care Committee.
Western blot analysis.
Tissue detergent extracts were prepared by dissection and homogenization in lysis buffer (25 mM HEPES, pH 7.4, 1% Nonidet P-40 (NP-40), 137 mM NaCl, 1 mM PMSF, 10 μg/ml aprotinin, 1 μg/ml pepstatin, 5 μg/ml leupeptin) using a Polytron PT-10 homogenizer (Brinkman Instruments, Westbury, New York, USA). The samples were then centrifuged at 2,000 g for 5 minutes, the resulting supernatant was then recentrifuged at 14,000 g for 20 minutes at 4°C, and the protein content of the supernatant was determined. These detergent-extracted supernatants were resolved by SDS-PAGE on 3–15% linear-gradient gels, subjected to immunoblotting using enhanced chemiluminescence (Amersham Pharmacia Biotech, Piscataway, New Jersey, USA) and quantified using the NIH image software. The rabbit polyclonal GLUT4 and Munc18c Ab’s and the sheep polyclonal syntaxin 4 and VAMP2 Ab’s were obtained as described previously (25, 33). The rabbit polyclonal IRAP/vp165/gp160 Ab was kindly provided by Steven Waters (Metabolex Inc., Hayward, California, USA). The rabbit polyclonal SNAP23 Ab was purchased from Synaptic Systems (Gottingen, Germany).
Metabolic measurements.
Fed and fasted (12 hours) blood glucose measurements were determined with a glucometer (DeCentech Inc., St. Paul, Minnesota, USA). Serum insulin was determined by ELISA, using mouse insulin as a standard (ALPCO Ltd., Windham, New Hampshire, USA). Serum triglyceride, nonesterified free fatty acid, and cholesterol concentrations were determined by colorimetric assay (WAKO Chemicals USA Inc., Richmond, Virginia, USA).
Glucose tolerance tests.
Glucose tolerance tests (GTTs) were performed on mice fasted for 12 hours. D-glucose (20% solution in PBS, 2 g/kg of body weight) was injected intraperitoneally into the animals, and blood glucose values were measured at 0, 30, 60, 90, and 120 minutes after the injection.
Hyperinsulinemic-euglycemic clamp procedure.
A 120-minute hyperinsulinemic-euglycemic clamp procedure was conducted with a prime continuous infusion of human insulin (Humulin; Eli Lilly and Co., Indianapolis, Indiana, USA) at a rate of 15 pmol/kg/min to raise plasma insulin concentration to approximately 850 pM. Blood samples (20 μl) were collected at 30-minute intervals for the immediate measurement of plasma glucose concentration, and 20% glucose was infused at variable rates to maintain plasma glucose at approximately 6.3 mM. Insulin-stimulated whole-body glucose flux was estimated using a prime continuous infusion of HPLC-purified [3-3H]glucose (10 μCi bolus, 0.1 μCi/min; NEN Life Science Products Inc., Boston, Massachusetts, USA) throughout the clamp procedure. To estimate insulin-stimulated glucose-transport activity and metabolism in skeletal muscle and fat, 2-deoxy-D-[1-14C]glucose (2-[14C]DG1; NEN Life Science Products Inc.) was administered as a bolus (10 μCi) 45 minutes before the end of clamp procedure. Blood samples (20 μl) were taken at 77, 80, 85, 90, 100, 110, and 120 minutes after the start of the clamp procedure to determine plasma [3H]glucose, 2-[14C]DG, and 3H2O concentrations. Additional blood samples (10 μl) were collected before the start and at the end of the clamp procedure for measurement of plasma insulin concentrations. All infusions were done using microdialysis pumps (CMA/Microdialysis, North Chelmsford, Massachusetts, USA). At the end of the clamp procedure, animals were sacrificed by a sodium pentobarbital injection. Within 5 minutes, four muscles (soleus, gastrocnemius, tibialis anterior, and quadriceps) from both hind limbs, visceral adipose tissue, and liver were taken. Each tissue, once exposed, was dissected out within 2 seconds, frozen immediately using liquid N2-cooled aluminum blocks, and stored at –70°C for later analysis. In separate experiments, the basal rates of glucose turnover were measured by continuously infusing [3-3H]glucose (0.02 μCi/min) for 120 minutes, and blood samples (20 μl) were taken at 10-minute intervals during the last 30 minutes for the determination of plasma [3H]glucose concentration.
Calculations.
Rates of whole-body glucose uptake and basal glucose turnover were determined as the ratio of the [3H]glucose infusion rate (disintegrations per minute) to the specific activity of plasma glucose (disintegrations per minute per micromole) during the final 30 minutes of respective experiments. Hepatic glucose output (HGO) during the clamp procedure was determined by subtracting the glucose infusion rate from the whole-body glucose uptake. Whole-body glycolysis was calculated from the rate of increase in plasma 3H2O concentration, determined by linear regression of the measurements at 80, 90, 100, 110, and 120 minutes. Whole-body glycogen synthesis was estimated by subtracting whole-body glycolysis from whole-body glucose uptake, assuming that glycolysis and glycogen synthesis account for the majority of insulin-stimulated glucose uptake. Glucose transport activity in skeletal muscle and fat was calculated from plasma 2-[14C]DG profile.
Subcellular fractionation of skeletal muscle.
The subcellular fractionation of skeletal muscle was performed as described previously by Zhou et al. (34). Briefly, after an overnight fast, the mice were either left untreated or given an intraperitoneal injection of 21 U of Humulin R per kilogram of body weight. After 30 minutes, the mice were sacrificed, and the quadriceps and gastrocnemius muscles were dissected and trimmed of fat and connective tissues. The muscles were put in a homogenization buffer containing 20 mM HEPES, pH 7.4, 250 mM sucrose, 1 mM EDTA, 1 mM PMSF, 10 μg/ml aprotinin, 1 μg/ml pepstatin, 5 μg/ml leupeptin, and 5 mM benzamidine, and homogenized with a Polytron PT-10 homogenizer three times in 10-second bursts. The samples were then centrifuged at 2,000 g for 5 minutes, and the supernatant was recentrifuged at 9,000 g for 20 minutes at 4°C. The resulting pellet (P1) was resuspended in PBS containing protease inhibitors. The supernatant from the P1 fraction was then centrifuged at 180,000 g for 90 minutes, and the pellet was resuspended in PBS plus protease inhibitors. Equal amounts of protein (1 mg) from each pellet were loaded onto a 4.5-ml 10–30% continuous sucrose gradient and centrifuged at 216,000 g for 55 minutes in an SW50.1 rotor (Beckman-Coulter Inc., Palo Alto, California, USA). The sucrose gradient was fractionated into 500-μl aliquots, and equal volumes (100 μl) of the fractions were resolved by SDS-PAGE and subjected to immunoblotting as described above.
Glucose uptake in isolated primary adipocytes.
The transport of glucose was determined using 2-deoxyglucose (2DG) as described previously (35). Briefly, adipocytes were isolated from epididymal fat pads by collagenase digestion (2 mg/ml) at 37°C with constant agitation in Krebs-Ringer buffer (KRBH) containing 15 mM sodium bicarbonate, 10 mM HEPES, 2 mM sodium pyruvate, 200 nM adenosine, and BSA (2.5% wt/vol). The cells were then incubated with or without 100 nM insulin for 30 minutes and 2DG (final concentration 0.1 mM; ICN Radiochemicals Inc., Costa Mesa, California, USA) was then added for 10 minutes. The reaction was terminated by a 30-second spin over dinonylphthalate oil, and the incorporated radioactivity in the cells was counted. Nonspecific uptake and trapping in the extracellular space was determined by the measuring the uptake in the presence of cytochalasin B.
Results
Generation of syntaxin 4–knockout mice.
To assess the physiological function of syntaxin 4, we constructed a targeting vector that replaces 3.3 kb of the syntaxin 4 genomic sequence, including the ATG-coding exon, with a neoR cassette oriented in the opposite direction as the endogenous syntaxin 4 gene (Figure 1, a–c). Of the 96 neomycin-resistant ES cell clones analyzed, five demonstrated the appropriate recombination as confirmed by Southern blot analysis (shown for one clone in Figure 1d). Two of these clones were used to generate chimeric founder mice. Heterozygotic mice from the F1 generation were identified by PCR analysis (data not shown) and were crossed in order to obtain syntaxin 4–deficient mice. However, of the 186 offspring analyzed, 71 were wild-type and 115 were heterozygous, syn4+/–, mice, suggesting that homozygotic disruption of the syntaxin 4 gene, syn4–/–, resulted in embryonic lethality. Subsequent analysis of embryonic development revealed that the syn4–/– embryos die before embryonic day 7.5.
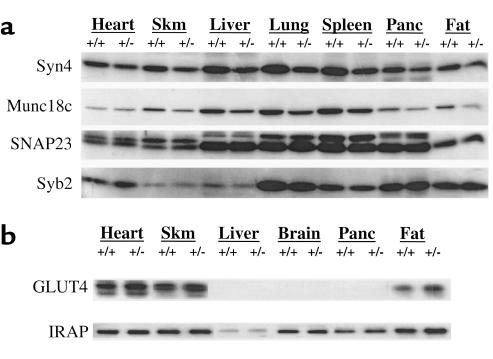
The relative expression levels of syntaxin 4 protein were next determined by immunoblotting of various mouse tissues (Figure 2). In all the tissues examined, the syntaxin 4 protein was reduced by 36% ± 4.4 in the syn4+/– mice compared with the wild-type syn4+/+ littermate controls (Figure 2a). Interestingly, the syntaxin 4–binding regulatory protein, Munc18c, also displayed a 42% ± 2.9 decrease in all tissues, with the exception of the heart (Figure 2a). Although we do not know the molecular basis for reduction of Munc18c protein in the syn4+/– mice, these data suggest the presence of a coordinate regulatory mechanism. However, the parallel decrease in syntaxin 4 and Munc18c was not shared by the other syntaxin 4–binding SNARE protein, SNAP23, and synaptobrevin 2 (syb2), also known as VAMP2 (Figure 2a). SNAP23 associates with syntaxin 4 as part of the plasma membrane–t-SNARE complex, and synaptobrevin 2 is a GLUT4 vesicle v-SNARE protein (27, 28, 36–38). As expected, GLUT4 displayed its normal tissue-specific expression pattern being restricted to heart, skeletal muscle, and fat (Figure 2b). Similar to SNAP23 and synaptobrevin 2, there was no significant difference in the levels of GLUT4 protein expression in the syn4+/– mice compared with the control syn4+/+ mice. Finally, the insulin-responsive aminopeptidase (IRAP) is an ubiquitously expressed protein (39–41). In the heart, skeletal muscle, and fat, IRAP is localized to the same intracellular compartments as the GLUT4 protein and undergoes an identical pattern of insulin-stimulated translocation (39–44). In any case, the expression of IRAP was not significantly affected in syn4+/– mice in these tissues (Figure 2b). Thus, the syn4+/– mice appear to have a selective and coordinate decrease of the syntaxin 4 and Munc18c proteins without any change on other SNARE or GLUT4 vesicle-containing proteins.
Figure 2.
The syn4+/– mice have reduced tissue expression of syntaxin 4 and Munc18c proteins. Tissue extracts from heart, hindquarter skeletal muscle (Skm), liver, brain, lung, spleen, pancreas (Panc), and epididymal adipose depots (Fat) were isolated from the syn4+/– and control syn4+/+ mice as described in Methods. The samples were resolved by SDS-PAGE and immunoblotted with Ab’s for (a) syntaxin 4 (syn4), Munc18c, SNAP23, and synaptobrevin 2 (Syb2), or (b) GLUT4 and IRAP. These are representative immunoblots performed independently four times with four separate pairs of syn4+/+ and syn4+/– mice.
Impaired clearance of circulating glucose in the heterozygous syntaxin 4–knockout mice.
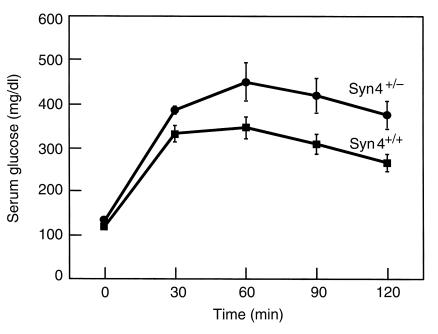
Previous studies have indicated an important involvement of syntaxin 4 in the docking/fusion of GLUT4-containing vesicles in adipose and muscle cell lines in culture (24–29, 45). Therefore, we next determined the ability of these mice to respond to a glucose challenge (Figure 3). After a single intraperitoneal bolus injection of glucose, circulating glucose levels maximally increased at 60 minutes and slowly declined over the next 90 minutes. Compared with the wild-type littermate controls, the syn4+/– mice displayed a considerably greater glucose excursion. These data directly demonstrate that the syn4+/– mice have a reduced ability to clear glucose from the peripheral circulation. Consistent with this finding, fasting serum insulin levels in the syn4+/– mice are higher than those in the wild-type controls (64 ± 9 pM vs. 43 ± 9 pM). However, other metabolic parameters assessed, including serum triglyceride, free fatty acids, and cholesterol were not significantly different between the wild-type and syn4+/– mice in either the fed or fasted state (data not shown).
Figure 3.
GTT on the heterozygous syntaxin 4–mutant mice. D-glucose (20% solution, 2 g/kg of body weight) was injected intraperitoneally into 16-week-old mice fasted for 12 hours. Blood glucose was measured at 0, 30, 60, 90, and 120 minutes after injection using a glucometer as described under Methods. Data shown are the average ± SD from 12 syn4+/– and 12 syn4+/+ littermate controls.
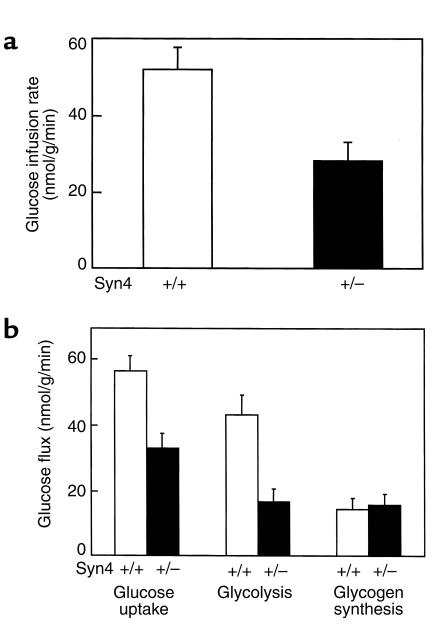
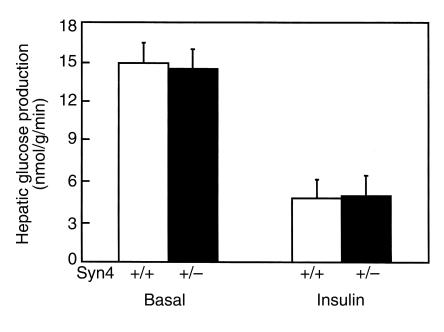
The decreased clearance of plasma glucose could result from either an impairment of insulin secretion, increased hepatic glucose output, or peripheral tissue insulin resistance. To gain detailed insight into glucose metabolism in syn4+/– mice, we next examined the metabolism of glucose during a hyperinsulinemic-euglycemic clamp procedure (Figure 4). The glucose infusion rate necessary to maintain euglycemia (110 mg/dl) in the presence of a constant infusion of insulin (2.5 mU/kg/min) was nearly twofold lower in syn4+/– mice than in the wild-type littermate controls (Figure 4a). Accordingly, the insulin-stimulated whole-body glucose-disposal rate was decreased by nearly 50% in syn4+/– mice (Figure 4b). This was accompanied by significant decreases in whole-body glycolysis (Figure 4b). In contrast, whole-body glycogen synthesis (Figure 4b) and hepatic glucose output (Figure 5) were unaffected in these mice. Since whole-body glycogen synthesis in mice primarily reflects liver glycogen synthesis, these data strongly suggest that the decreased whole-body glucose clearance was not due to altered liver function.
Figure 4.
Whole-body metabolic parameters during hyperinsulinemic-euglycemic clamp procedures in awake mice. (a) Steady-state glucose infusion rate, obtained from averaged rates of 90–120 minutes of hyperinsulinemic-euglycemic clamp procedures in the wild-type (open bar) and heterozygous syntaxin 4–knockout mice (filled bar). (b) Insulin-stimulated whole-body glucose transport, glycolysis, and glycogen synthesis in vivo in the wild-type mice (open bars) and heterozygous syntaxin 4–knockout mice (filled bars). Data shown are the average ± SD of three independent experiments; P < 0.05 versus wild-type mice by unpaired Student’s t test.
Figure 5.
HGP during hyperinsulinemic-euglycemic clamp procedure in awake mice. Basal and insulin-stimulated rates of HGP in the wild-type (open bars) and heterozygous syntaxin 4–knockout mice (filled bars). Data shown are the average ± SD of three independent experiments, P < 0.05 versus wild-type mice.
Impaired skeletal muscle glucose transport in the heterozygous syntaxin 4–knockout mice.
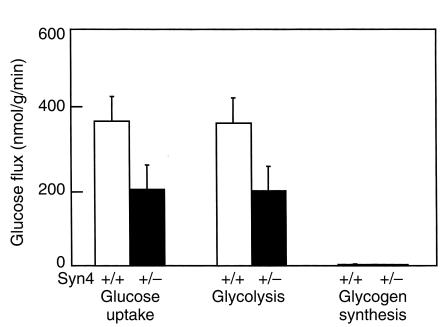
Having eliminated a defect in liver function, we next examined the ability of muscle and adipose tissue to undergo insulin-stimulated glucose uptake. Analysis of 2DG uptake into skeletal muscle during the clamp procedure demonstrated a 50% decrease in the syn4+/– mice compared with the control mice (Figure 6). Since glucose uptake under these conditions is rate limiting for glycolysis, there was a corresponding twofold decrease in muscle glycolytic rate. Despite the very low rate of muscle glycogen synthesis, there was also an apparent decrease in the rate of skeletal muscle glycogen synthesis.
Figure 6.
Skeletal muscle glucose transport and metabolism during hyperinsulinemic-euglycemic clamp procedures in awake mice. Insulin-stimulated glucose transport, glycolysis, and glycogen synthesis in skeletal muscle (gastrocnemius) in the wild-type mice (open bars) and heterozygous syntaxin 4–knockout mice (filled bars). Data shown are the average ± SD of three independent experiments, P < 0.05 versus wild-type mice.
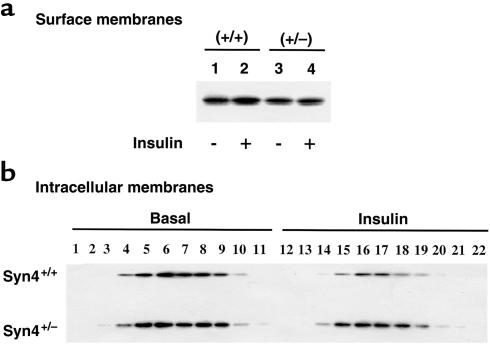
The primary mechanism for insulin-stimulated glucose uptake in skeletal muscle is the translocation of intracellular sequestered GLUT4 protein to the cell-surface membrane. This can be assessed by subcellular fractionation of mouse hindquarter skeletal muscle followed by GLUT4 immunoblotting (34, 46–49). In wild type syn4+/+ mice, insulin stimulated a small increase in the amount of surface membrane–distributed GLUT4 protein (Figure 7a, lanes 1 and 2). In contrast, there was no discernible change in the amount of GLUT4 protein in the syn4+/– mice (Figure 7a, lanes 3 and 4). Although the insulin-stimulated translocation of GLUT4 is difficult to detect in mouse skeletal muscle due to contamination of the cell-surface membrane fraction, the decrease in the intracellular fractions are readily observed in the syn4+/+ mice (Figure 7b). Consistent with the lack of insulin-stimulated appearance of GLUT4 at the cell-surface membrane fraction in the syn4+/– mice, there was also a marked reduction in the ability of insulin to decrease the intracellular content of GLUT4 protein (Figure 7b). Thus, these data demonstrated that the syn4+/– mice have reduced insulin-stimulated glucose uptake due to a reduction in the cell-surface translocation of the GLUT4 protein.
Figure 7.
Insulin stimulation results in the skeletal muscle surface-membrane translocation of GLUT4 in wild-type syn4+/+ but not heterozygotic syn4+/– mice. Syn4+/+ and syn4+/– mice were fasted overnight and either left untreated or stimulated with insulin as described in Methods. The hindquarter skeletal muscle was dissected and subjected to differential and sucrose velocity centrifugation as described under Methods. The surface-membrane fraction (a), as well as the intracellular-membrane fractions (b), were immunoblotted with the GLUT4 Ab. These are representative immunoblots performed from three different independent pairs of wild-type syn4+/+ and knockout syn4+/– mice.
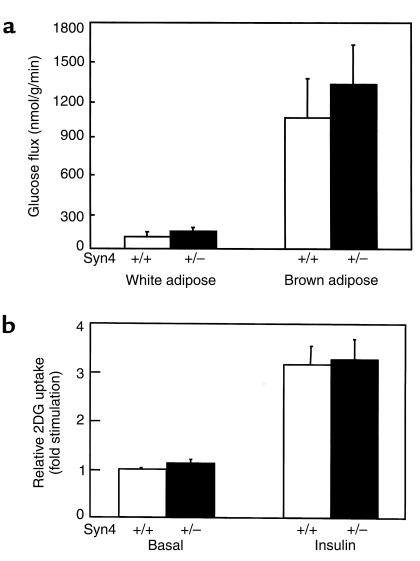
In contrast to the inhibition of glucose uptake and GLUT4 translocation in skeletal muscle, there was no significant difference in glucose uptake into either white or brown adipose tissue during the euglycemic clamp procedure (Figure 8a). This was confirmed in measurements of insulin-stimulated glucose transport in isolated primary adipocytes from syn4+/– mice (Figure 8b). As observed for the in vivo glucose transport, insulin-stimulated glucose uptake in isolated primary adipocytes was not significantly different in syn4+/– and wild-type cells. Together these data indicated that the insulin resistance observed in vivo specifically reflects decreased insulin-stimulated glucose uptake into skeletal muscle of the syn4+/– mice.
Figure 8.
Glucose transport in adipose tissues and isolated primary adipocytes. (a) In vivo glucose transport in white and brown adipose tissues during hyperinsulinemic-euglycemic clamp procedures. (b) 2DG uptake in isolated primary white adipocytes from 12-week-old wild-type mice (open bars) or heterozygous syntaxin 4–knockout mice (filled bars). Data shown are the average ± SD of three independent experiments.
Discussion
It is well established that insulin stimulation enhances glucose uptake primarily in striated muscle and adipose tissue by recruiting the intracellular compartmentalized GLUT4 protein to the cell-surface membrane (1–4). Previous in vitro studies have suggested that syntaxin 4 functions as a plasma membrane t-SNARE during insulin-stimulated GLUT4 translocation (24–29, 45). However, to examine the function of syntaxin 4 in a physiological context, we generated syntaxin 4–knockout mice by homologous recombination. Our data clearly demonstrated that heterozygous syntaxin 4–mutant mice have an approximate 40% loss of syntaxin 4 protein and develop insulin resistance, as manifested by significant decreases in rates of whole-body glucose disposal and glycolysis. The reduction in syntaxin 4 protein levels correlated directly with a decrease in insulin-stimulated skeletal muscle glucose uptake without any significant effect on the basal rate of glucose transport. Importantly, the decrease in insulin-stimulated skeletal muscle glucose uptake occurred in parallel with a reduction in GLUT4 translocation. Thus, the inability of insulin to induce GLUT4 translocation in skeletal muscle of the syn4+/– mice was directly reflected in an impairment of glucose uptake and glucose disposal.
The insulin resistance observed in these mice was specific to skeletal muscle because liver glucose metabolism and adipose tissue glucose uptake was unaffected. In hindsight, the apparent lack of effect in liver was not surprising, because syntaxin 4 appears to function primarily in the regulation of GLUT4 translocation. Furthermore, since liver does not express the GLUT4 protein and is not a regulator site for insulin-stimulated glucose uptake, syntaxin 4 probably plays other roles in this tissue unrelated to glucose metabolism.
In contrast, several reports have confirmed that in adipocytes (primary isolated or in tissue culture), syntaxin 4 functions as a specific t-SNARE for GLUT4 translocation (24–27, 29, 45). We were therefore very surprised that we did not detect any significant change in adipose tissue glucose uptake. However, this may be due to the fact that syntaxin 4 is abundantly expressed in the plasma membrane of adipocytes (data not shown). As such, the amount of cell-surface syntaxin 4 in adipocytes may provide a sufficient reservoir so that even with a 40% reduction there is still an excess of syntaxin 4 protein. Recently, a similar phenomenon has been observed in the case of the specific syntaxin 4–binding protein Munc18c (50). In this case, overexpression of Munc18c inhibited insulin-stimulated GLUT4 translocation to the transverse tubules but not the sarcolemma membrane of skeletal muscle. This was apparently due to a relatively higher level of syntaxin 4 at the sarcolemma compared with the transverse tubules. Under these conditions, the overexpressed Munc18c protein was able to saturate the transverse-tubule syntaxin 4 protein, but not the sarcolemma syntaxin 4. Thus, we would expect that the skeletal muscle transverse-tubule membrane would be more sensitive to perturbation of SNARE protein stoichiometry than either the sarcolemma membrane or the plasma membrane in adipocytes. This hypothesis is also consistent with the transverse-tubule membrane accounting for a greater extent of insulin-stimulated GLUT4 translocation and glucose uptake than the sarcolemma membrane in skeletal muscle (46, 51).
In summary, our generation and characterization of the syn4+/– mice clearly support a critical role of syntaxin 4 in insulin-stimulated glucose transport. The syn4+/– mice represent the first mouse model for the study of SNARE proteins in GLUT4 translocation and glucose transport. Although homozygotic disruption of the syntaxin 4 gene results in early embryonic lethality, rescuing of these animals using a regulated promoter driving syntaxin 4 expression or the development of a tissue-specific knockout will allow more detailed analysis of t-SNARE function in the regulation of GLUT4 translocation in vivo.
Acknowledgments
We would like to thank Ahmir Kahn and Diana Boeglin for their excellent technical assistance. This work was supported by research grants DK-25295 and DK-55811 from the NIH.
Footnotes
Chunmei Yang and Kenneth J. Coker’s present address is: Lexicon Genetics Inc., The Woodlands, Texas, USA.
Chunmei Yang and Kenneth J. Coker contributed equally to this work.
References
- 1.Mueckler M. Facilitative glucose transporters. Eur J Biochem. 1994;219:713–725. doi: 10.1111/j.1432-1033.1994.tb18550.x. [DOI] [PubMed] [Google Scholar]
- 2.Zorzano A, Fandos C, Palacin M. Role of plasma membrane transporters in muscle metabolism. Biochem J. 2000;349:667–688. doi: 10.1042/bj3490667. [DOI] [PMC free article] [PubMed] [Google Scholar]
- 3.Goodyear LJ, Kahn BB. Exercise, glucose transport, and insulin sensitivity. Annu Rev Med. 1998;49:235–261. doi: 10.1146/annurev.med.49.1.235. [DOI] [PubMed] [Google Scholar]
- 4.Galuska D, Ryder J, Kawano Y, Charron MJ, Zierath JR. Insulin signaling and glucose transport in insulin resistant skeletal muscle. Special reference to GLUT4 transgenic and GLUT4 knockout mice. Adv Exp Med Biol. 1998;441:73–85. doi: 10.1007/978-1-4899-1928-1_7. [DOI] [PubMed] [Google Scholar]
- 5.Charron MJ, Brosius FC, III, Alper SL, Lodish HF. A glucose transport protein expressed predominately in insulin-responsive tissues. Proc Natl Acad Sci USA. 1989;86:2535–2539. doi: 10.1073/pnas.86.8.2535. [DOI] [PMC free article] [PubMed] [Google Scholar]
- 6.Birnbaum MJ. Identification of a novel gene encoding an insulin-responsive glucose transporter protein. Cell. 1989;57:305–315. doi: 10.1016/0092-8674(89)90968-9. [DOI] [PubMed] [Google Scholar]
- 7.James DE, Brown R, Navarro J, Pilch PF. Insulin-regulatable tissues express a unique insulin-sensitive glucose transport protein. Nature. 1988;333:183–185. doi: 10.1038/333183a0. [DOI] [PubMed] [Google Scholar]
- 8.James DE, Strube M, Mueckler M. Molecular cloning and characterization of an insulin-regulatable glucose transporter. Nature. 1989;338:83–87. doi: 10.1038/338083a0. [DOI] [PubMed] [Google Scholar]
- 9.Kaestner KH, et al. Sequences, tissue distribution, and differential expression of mRNA for a putative insulin-responsive glucose transporter in mouse 3T3-L1 adipocytes. Proc Natl Acad Sci USA. 1989;86:3150–3154. doi: 10.1073/pnas.86.9.3150. [DOI] [PMC free article] [PubMed] [Google Scholar]
- 10.Fukumoto H, et al. Cloning and characterization of the major insulin-responsive glucose transporter expressed in human skeletal muscle and other insulin-responsive tissues. J Biol Chem. 1989;264:7776–7779. [PubMed] [Google Scholar]
- 11.Rodnick KJ, et al. Immunocytochemical and biochemical studies of GLUT4 in rat skeletal muscle. J Biol Chem. 1992;267:6278–6285. [PubMed] [Google Scholar]
- 12.Jhun BH, Rampal AL, Liu H, Lachaal M, Jung CY. Effects of insulin on steady state kinetics of GLUT4 subcellular distribution in rat adipocytes. J Biol Chem. 1992;268:17710–17715. [PubMed] [Google Scholar]
- 13.Slot JW, Geuze HJ, Gigengack S, Lienhard GE, James DE. Immuno-localization of the insulin regulatable glucose transporter in brown adipose tissue of the rat. J Cell Biol. 1991;113:123–135. doi: 10.1083/jcb.113.1.123. [DOI] [PMC free article] [PubMed] [Google Scholar]
- 14.Slot JW, Geuze HJ, Gigengack S, James DE, Lienhard GE. Translocation of the glucose transporter GLUT4 in cardiac myocytes of the rat. Proc Natl Acad Sci USA. 1991;88:7815–7819. doi: 10.1073/pnas.88.17.7815. [DOI] [PMC free article] [PubMed] [Google Scholar]
- 15.Satoh S, et al. Use of bismannose photolabel to elucidate insulin-regulated GLUT4 subcellular trafficking kinetics in rat adipose cells. Evidence that exocytosis is a critical site of hormone action. J Biol Chem. 1993;268:17820–17829. [PubMed] [Google Scholar]
- 16.Yang J, Holman GD. Comparison of GLUT4 and GLUT1 subcellular trafficking in basal and insulin-stimulated 3T3-L1 cells. J Biol Chem. 1993;268:4600–4603. [PubMed] [Google Scholar]
- 17.Kahn BB. Facilitative glucose transporters: regulatory mechanisms and dysregulation in diabetes. J Clin Invest. 1992;89:1367–1374. doi: 10.1172/JCI115724. [DOI] [PMC free article] [PubMed] [Google Scholar]
- 18.Mueckler M. The molecular biology of glucose transport: relevance to insulin resistance and non-insulin-dependent diabetes mellitus. J Diabetes Complications. 1993;7:130–141. doi: 10.1016/1056-8727(93)90038-z. [DOI] [PubMed] [Google Scholar]
- 19.Garvey WT, Hardin D, Juhaszova M, Dominguez JH. Effects of diabetes on myocardial glucose transport system in rats: implications for diabetic cardiomyopathy. Am J Physiol. 1993;264:H837–H844. doi: 10.1152/ajpheart.1993.264.3.H837. [DOI] [PubMed] [Google Scholar]
- 20.James DE, Piper RC. Insulin resistance, diabetes, and the insulin-regulated trafficking of GLUT-4. J Cell Biol. 1994;126:1123–1126. doi: 10.1083/jcb.126.5.1123. [DOI] [PMC free article] [PubMed] [Google Scholar]
- 21.Rea S, James DE. Moving GLUT4: the biogenesis and trafficking of GLUT4 storage vesicles. Diabetes. 1997;46:1667–1677. doi: 10.2337/diab.46.11.1667. [DOI] [PubMed] [Google Scholar]
- 22.Pessin JE, Thurmond DC, Elmendorf JS, Coker KJ, Okada S. Molecular basis of insulin-stimulated GLUT4 vesicle trafficking. Location! location! location! J Biol Chem. 1999;274:2593–2596. doi: 10.1074/jbc.274.5.2593. [DOI] [PubMed] [Google Scholar]
- 23.St-Denis SF, Cushman SW. Role of SNARE’s in the Glut4 translocation response to insulin in adipose cells and muscle. J Basic Clin Physiol Pharmacol. 1998;9:153–165. doi: 10.1515/jbcpp.1998.9.2-4.153. [DOI] [PubMed] [Google Scholar]
- 24.Cheatham B, et al. Insulin-stimulated translocation of GLUT4 glucose transporters requires SNARE-complex proteins. Proc Natl Acad Sci USA. 1996;93:15169–15173. doi: 10.1073/pnas.93.26.15169. [DOI] [PMC free article] [PubMed] [Google Scholar]
- 25.Olson AL, Knight JB, Pessin JE. Syntaxin 4, VAMP2, and/or VAMP3/cellubrevin are functional target membrane and vesicle SNAP receptors for insulin-stimulated GLUT4 translocation in adipocytes. Mol Cell Biol. 1997;17:2425–2435. doi: 10.1128/mcb.17.5.2425. [DOI] [PMC free article] [PubMed] [Google Scholar]
- 26.Volchuk A, et al. Syntaxin 4 in 3T3-L1 adipocytes: regulation by insulin and participation in insulin-dependent glucose transport. Mol Biol Cell. 1996;7:1075–1082. doi: 10.1091/mbc.7.7.1075. [DOI] [PMC free article] [PubMed] [Google Scholar]
- 27.Martin LB, Shewan A, Millar CA, Gould GW, James DE. Vesicle-associated membrane protein 2 plays a specific role in the insulin-dependent trafficking of the facilitative glucose transporter GLUT4 in 3T3-L1 adipocytes. J Biol Chem. 1998;273:1444–1452. doi: 10.1074/jbc.273.3.1444. [DOI] [PubMed] [Google Scholar]
- 28.Rea S, et al. Syndet, an adipocyte target SNARE involved in the insulin-induced translocation of GLUT4 to the cell surface. J Biol Chem. 1998;273:18784–18792. doi: 10.1074/jbc.273.30.18784. [DOI] [PubMed] [Google Scholar]
- 29.Macaulay SL, et al. Functional studies in 3T3L1 cells support a role for SNARE proteins in insulin stimulation of GLUT4 translocation. Biochem J. 1997;324:217–224. doi: 10.1042/bj3240217. [DOI] [PMC free article] [PubMed] [Google Scholar]
- 30.Kawanishi M, et al. Role of SNAP23 in insulin-induced translocation of GLUT4 in 3T3-L1 adipocytes. Mediation of complex formation between syntaxin4 and VAMP2. J Biol Chem. 2000;275:8240–8247. doi: 10.1074/jbc.275.11.8240. [DOI] [PubMed] [Google Scholar]
- 31.Randhawa V, et al. VAMP2, but not VAMP3/cellubrevin, mediates insulin-dependent incorporation of GLUT4 into the plasma membrane of L6 myoblasts. Mol Biol Cell. 2000;11:2403–2407. doi: 10.1091/mbc.11.7.2403. [DOI] [PMC free article] [PubMed] [Google Scholar]
- 32.Tellam JT, et al. Characterization of Munc-18c and syntaxin-4 in 3T3-L1 adipocytes. Putative role in insulin-dependent movement of GLUT-4. J Biol Chem. 1997;272:6179–6186. doi: 10.1074/jbc.272.10.6179. [DOI] [PubMed] [Google Scholar]
- 33.Thurmond DC, et al. Regulation of insulin-stimulated GLUT4 translocation by munc18c in 3T3L1 adipocytes. J Biol Chem. 1998;273:33876–33883. doi: 10.1074/jbc.273.50.33876. [DOI] [PubMed] [Google Scholar]
- 34.Zhou M, et al. Insulin-dependent protein trafficking in skeletal muscle cells. Am J Physiol. 1998;275:E187–E196. doi: 10.1152/ajpendo.1998.275.2.E187. [DOI] [PubMed] [Google Scholar]
- 35.Enrique-Tarancon G, et al. Role of semicarbazide-sensitive amine oxidase on glucose transport and GLUT4 recruitment to the cell surface in adipose cells. J Biol Chem. 1998;273:8025–8032. doi: 10.1074/jbc.273.14.8025. [DOI] [PubMed] [Google Scholar]
- 36.Ralston E, Beushausen S, Ploug T. Expression of the synaptic vesicle proteins VAMPs/synaptobrevins 1 and 2 in non-neural tissues. J Biol Chem. 1994;269:15403–15406. [PubMed] [Google Scholar]
- 37.Jagadish MN, et al. Insulin-responsive tissues contain the core complex protein SNAP-25 (synaptosomal-associated protein 25) A and B isoforms in addition to syntaxin 4 and synaptobrevins 1 and 2. Biochem J. 1996;317:945–954. doi: 10.1042/bj3170945. [DOI] [PMC free article] [PubMed] [Google Scholar]
- 38.Martin S, et al. The glucose transporter (GLUT-4) and vesicle-associated membrane protein-2 (VAMP-2) are segregated from recycling endosomes in insulin-sensitive cells. J Cell Biol. 1996;134:625–635. doi: 10.1083/jcb.134.3.625. [DOI] [PMC free article] [PubMed] [Google Scholar]
- 39.Kandror KV, Pilch PF. gp160, a tissue-specific marker for insulin-activated glucose transport. Proc Natl Acad Sci USA. 1994;91:8017–8021. doi: 10.1073/pnas.91.17.8017. [DOI] [PMC free article] [PubMed] [Google Scholar]
- 40.Kandror K, Pilch PF. Identification and isolation of glycoproteins that translocate to the cell surface from GLUT4-enriched vesicles in an insulin-dependent fashion. J Biol Chem. 1994;269:138–142. [PubMed] [Google Scholar]
- 41.Keller SR, Scott HM, Mastick CC, Aebersold R, Lienhard GE. Cloning and characterization of a novel insulin-regulated membrane aminopeptidase from Glut4 vesicles. J Biol Chem. 1995;270:23612–23618. doi: 10.1074/jbc.270.40.23612. [DOI] [PubMed] [Google Scholar]
- 42.Kandror KV, Yu L, Pilch PF. The major protein of GLUT4-containing vesicles, gp160, has aminopeptidase activity. J Biol Chem. 1994;269:30777–30780. [PubMed] [Google Scholar]
- 43.Martin S, et al. The glucose transporter GLUT4 and the aminopeptidase vp165 colocalise in tubulo-vesicular elements in adipocytes and cardiomyocytes. J Cell Sci. 1997;110:2281–2291. doi: 10.1242/jcs.110.18.2281. [DOI] [PubMed] [Google Scholar]
- 44.Ross SA, Herbst JJ, Keller SR, Lienhard GE. Trafficking kinetics of the insulin-regulated membrane aminopeptidase in 3T3-L1 adipocytes. Biochem Biophys Res Commun. 1997;239:247–251. doi: 10.1006/bbrc.1997.7459. [DOI] [PubMed] [Google Scholar]
- 45.Timmers KI, et al. Identification of SNAP receptors in rat adipose cell membrane fractions and in SNARE complexes co-immunoprecipitated with epitope-tagged N-ethylmaleimide-sensitive fusion protein. Biochem J. 1996;320:429–436. doi: 10.1042/bj3200429. [DOI] [PMC free article] [PubMed] [Google Scholar]
- 46.Marette A, Burdett E, Douen A, Vranic M, Klip A. Insulin induces the translocation of GLUT4 from a unique intracellular organelle to transverse tubules in rat skeletal muscle. Diabetes. 1992;41:1562–1569. doi: 10.2337/diab.41.12.1562. [DOI] [PubMed] [Google Scholar]
- 47.Ploug T, van Deurs B, Ai H, Cushman SW, Ralston E. Analysis of GLUT4 distribution in whole skeletal muscle fibers: identification of distinct storage compartments that are recruited by insulin and muscle contractions. J Cell Biol. 1998;142:1429–1446. doi: 10.1083/jcb.142.6.1429. [DOI] [PMC free article] [PubMed] [Google Scholar]
- 48.Munoz P, Rosemblatt M, Testar X, Palacin M, Zorzano A. Isolation and characterization of distinct domains of sarcolemma and T-tubules from rat skeletal muscle. Biochem J. 1995;307:273–280. doi: 10.1042/bj3070273. [DOI] [PMC free article] [PubMed] [Google Scholar]
- 49.Goodyear LJ, Hirshman MF, Valyou PM, Horton ES. Glucose transporter number, function, and subcellular distribution in rat skeletal muscle after exercise training. Diabetes. 1992;41:1091–1099. doi: 10.2337/diab.41.9.1091. [DOI] [PubMed] [Google Scholar]
- 50.Khan AH, et al. Munc18c regulates insulin-stimulated GLUT4 translocation to the transverse tubules in skeletal muscle. J Biol Chem. 2001;276:4063–4069. doi: 10.1074/jbc.M007419200. [DOI] [PMC free article] [PubMed] [Google Scholar]
- 51.Munoz P, et al. The T-tubule is a cell-surface target for insulin-regulated recycling of membrane proteins in skeletal muscle. Biochem J. 1995;312:393–400. doi: 10.1042/bj3120393. [DOI] [PMC free article] [PubMed] [Google Scholar]


