Abstract
In newborns and small mammals, cold-induced adaptive (or nonshivering) thermogenesis is produced primarily in brown adipose tissue (BAT). Heat production is stimulated by the sympathetic nervous system, but it has an absolute requirement for thyroid hormone. We used the thyroid hormone receptor-β–selective (TR-β–selective) ligand, GC-1, to determine by a pharmacological approach whether adaptive thermogenesis was TR isoform–specific. Hypothyroid mice were treated for 10 days with varying doses of T3 or GC-1. The level of uncoupling protein 1 (UCP1), the key thermogenic protein in BAT, was restored by either T3 or GC-1 treatment. However, whereas interscapular BAT in T3-treated mice showed a 3.0°C elevation upon infusion of norepinephrine, indicating normal thermogenesis, the temperature did not increase (<0.5°C) in GC-1–treated mice. When exposed to cold (4°C), GC-1–treated mice also failed to maintain core body temperature and had reduced stimulation of BAT UCP1 mRNA, indicating impaired adrenergic responsiveness. Brown adipocytes isolated from hypothyroid mice replaced with T3, but not from those replaced with GC-1, had normal cAMP production in response to adrenergic stimulation in vitro. We conclude that two distinct thyroid-dependent pathways, stimulation of UCP1 and augmentation of adrenergic responsiveness, are mediated by different TR isoforms in the same tissue.
Introduction
Heat is an obligatory by-product of energy expenditure. In a fully relaxed subject kept at room temperature, energy expenditure equals the resting metabolic rate; the resulting heat produced is referred to as obligatory thermogenesis. The metabolic rate, however, can be increased as a homeostatic response to lowering the ambient temperature or in response to food intake; the resulting heat produced is referred to as adaptive (or facultative) thermogenesis (1). Adaptive thermogenesis is regulated by hypothalamic centers that integrate environmental and visceral cues and signal target tissues, especially brown adipose tissue (BAT), through the sympathetic nervous system (2).
Thyroid hormone plays a fundamental role in obligatory and adaptive thermogenesis (1). Thyroid hormone increases obligatory thermogenesis by accelerating ATP turnover and expenditure (2). Hypothyroid rats have normal diet-induced thermogenesis, but almost no cold-induced (nonshivering) thermogenesis, which depends on the synergism between the sympathetic nervous system and thyroid hormone (3). Hypothyroid rats do not survive cold exposure (4) and completely fail to increase BAT thermal production in response to norepinephrine (NE) infusion (5). In normal rats, NE infusion results in a twofold increase in energy expenditure in an hour (6). Tissues in hypothyroid animals have reduced responsiveness to adrenergic stimulation, owing to alterations at several levels of adrenergic signal transduction (7–9).
BAT is the primary site of facultative thermogenesis in small mammals (including human newborns). The thermogenic capacity of BAT is primarily due to expression of the mitochondrial uncoupling protein (UCP1), which can dissipate the proton gradient across the inner mitochondrial membrane (10). Mice lacking UCP1 are cold intolerant, demonstrating the important role of UCP1 and BAT in adaptive thermogenesis (11). The BAT thermogenic response is initiated by NE but must have thyroid hormone present (5, 12). Within a few hours of cold exposure, the triiodothyronine (T3) concentration in brown adipocytes increases three- to fourfold, resulting in higher T3 receptor occupancy (13–15). T3 is produced locally in BAT from thyroxine (T4) by the action of the type 2 5′-deiodinase (D2) enzyme (16).
The interactions between thyroid hormone and the sympathetic nervous system are via the α-1 and β-3 adrenergic receptors (2). cAMP-dependent signals stimulate UCP1 gene transcription severalfold in euthyroid brown adipocytes. Response elements for thyroid hormone receptor (TRE) and cAMP (CRE) have been identified in the UCP1 5′-flanking region (17–19). Additionally, the adrenergic system itself is subject to regulation by thyroid hormone. cAMP generation is greatly reduced in isolated brown adipocytes obtained from hypothyroid animals, as a result of modifications at the receptor, Gi protein, and adenylyl cyclase levels (7–9). Therefore, thyroid hormone amplifies adrenergic signal transduction and interacts with cAMP-dependent transcription factors to increase expression of specific genes.
Thyroid hormones act through nuclear receptors (TRs), which are ligand-dependent transcription factors encoded by two different genes in mammals, TRα and TRβ (20). Gene knockouts in mice of TRα, TRβ, or both have demonstrated essential functions of TR, and some actions that are preferentially mediated by a TR isoform (21, 22). TRβ appears to play an essential role in cochlear development (23) and in thyroid-stimulating hormone (TSH) regulation (24–26). TRα has an important role in mediating the chronotropic and inotropic effects of thyroid hormone in the heart (21, 27). Most actions of thyroid hormone, however, are likely mediated by both receptor isoforms (21).
TRα1-knockout mice have a 0.5°C reduction in body temperature and reduced basal heart rate (28, 29). Similar results were found in TRα/β combined–knockout mice (30–32). These data suggest that TRα1 has an important role in body temperature regulation, although the level at which thyroid hormone is acting is not known. The increased core temperature in response to T3 administration in knockout mice indicates that thyroid hormone–induced obligatory thermogenesis is intact. The “thermoneutral” temperature for mice is approximately 28°C, so that animals housed at room temperature are in fact mildly “cold-exposed.” Hypothermia in TRα-knockout mice at room temperature in these animals, therefore, most likely indicates that adaptive thermogenesis is impaired.
The availability of a TR isoform-selective ligand, GC-1, provides a pharmacological approach to evaluate TR isoform specificity. GC-1 is a newly developed TRβ-specific analog, in which iodine atoms are replaced by methyl or isopropyl substitution, the biphenyl ether linkage is replaced by a carbon linkage, and the alanine side chain is replaced by an oxyacetic acid side chain (33). GC-1 has an affinity for TRβ equal to that of T3 and a tenfold reduced affinity for TRα compared with T3. GC-1 has recently been shown to lower serum cholesterol and triglycerides equal to or greater than T3, but without significant stimulation of heart rate or cardiac-specific gene expression (27).
Methods
Animals and drugs.
All studies performed were approved by the Animal Research Committee, Veterans Affairs Greater Los Angeles Healthcare System. All drugs and reagents, unless otherwise specified, were purchased from Sigma Chemical Co. (St. Louis, Missouri, USA). Male C57 mice were obtained from Harlan Sprague Dawley (Indianapolis, Indiana, USA). Mice were kept in cages with no more than five animals per cage; chow and tap water were available ad libitum; and the mice were kept at 23 ± 1°C and light cycles of 12 hours. All mice were 70–80 days old at the beginning of the experiments and weighed 22–28 g. Hypothyroidism was induced by feeding a low-iodine diet supplemented with 0.15% propylthiouracil (PTU) purchased from Harlan Teklad Co. (Indianapolis, Indiana, USA), for 8–10 days. Four groups of mice were then treated daily for 10 days with intraperitoneal injections of 0 (vehicle only) or of 7, 14, or 28 ng/g/day T3. These amounts correspond to approximately two, four, and eight times the physiological replacement dose. Another four groups of mice were treated with 0, 3.6, 7.2, and 14.4 ng/g/day GC-1. The GC-1 doses are equimolar to T3 doses. After treatment, the interscapular brown adipose tissue (IBAT) thermogenic response to NE infusion was measured.
IBAT thermal response to NE infusion.
In these studies, we have adapted a protocol described for rats, with minor modifications (5). All animals were anesthetized with a mixture of urethane (560 mg/kg intraperitoneally) and chloralose (38 mg/kg intraperitoneally) the morning of the experiment. Mice were kept on a warm (30°C) pad through the course of the experiment. A polyethylene (P-50) cannula was inserted into the left jugular vein and later used for NE infusion. IBAT temperatures were measured using a precalibrated thermistor probe YSI 427 (Yellow Springs Instrument Co., Yellow Springs, Ohio, USA) secured under the brown fat pad. Core temperature was measured with a colonic probe YSI 423 (Yellow Springs Instrument Co.). The probes were connected to a high-precision thermometer (YSI Precision 4000A Thermometer; Yellow Springs Instrument Co.). Core temperature and IBAT temperature were monitored during a period of 10 minutes to obtain a stable baseline, and then NE infusion was started. NE infusion (1,075 pmol/min) was performed with an infusion pump (Harvard Model 2274; Harvard Apparatus, Holliston, Massachusetts, USA) at a rate of 0.459 μl/min for 30 minutes. Raw data were plotted over time and expressed in term of maximum ΔIBAT temperature (°C). Heart rate was also monitored electrocardiographically during NE infusion.
Tissue sampling and processing.
The whole IBAT pad, approximately 1 g of liver and of heart from individual mice were processed for mitochondrial isolation. Tissue samples were homogenized with a motor-driven homogenizer in 2 ml of ice-cold 0.32 M sucrose, 2 mM EDTA, and 5 mM 2-mercaptoethanol, in 10 mM Tris buffer (pH 7.2). The homogenate was centrifuged at 10,000 g for 10 minutes. The top fat layer of BAT homogenate was discarded, and the pellets were resuspended in 2 ml of buffer and centrifuged at 10,000 g for 10 minutes to sediment the mitochondria. The mitochondrial pellet was resuspended in 100 ml of buffer and kept frozen at –70°C. Protein measurement was done by the Bradford method (34).
Western blot analysis.
Protein (20 μg per lane) was size fractionated on a 10% SDS-PAGE gel and electrophoretically transferred onto a nitrocellulose membrane (Immobilon; Millipore Co., Bedford, Massachusetts, USA) using 0.17 M Tris base, 0.17 M glycine, and 15% methanol (pH 8.3) as transfer buffer. The membrane was then incubated overnight with Tris buffer and 0.5 % blocking solution, containing anti-UCP1 antibody, 1:1,000 (Calbiochem-Novabiochem, San Diego, California, USA) and processed further using a chemiluminescence Western blotting kit (Roche Molecular Biochemicals, Indianapolis, Indiana, USA), according to the manufacturer’s protocol. Signal intensity was measured by densitometry using the NIH Image software (NIH Scientific Computing Resource Center, Bethesda, Maryland, USA).
α-Glycerol phosphate dehydrogenase assay.
α-Glycerol phosphate dehydrogenase (α-GPD) was assayed as described previously (35, 36), at 35°C in 65 mM sodium phosphate buffer (pH 7.4) containing 1 mM KCN, 50 mM α -glycerophosphate, 1.7 mM iodonitrotetrazolium violet, and 50–100 μg of mitochondrial protein. Product formation was monitored spectrophotometrically at 550 nm. The results were expressed as increments in optical density units per minute per milligram of mitochondrial protein.
RIA.
Total T4 levels were measured in 25 μl serum samples in duplicate determinations by a mouse-specific RIA (ImmunoChem-coated tube-T4 iodine I125 RIA kit; ICN Pharmaceuticals, Costa Mesa, California, USA).
RNA isolation and Northern blot analysis.
Total RNA was extracted from the various tissues using TRIzol (Life Technologies Inc., Rockville, Maryland, USA), according to the manufacturer’s instructions, and quantified by spectrophotometry. RNA (30–40 μg per lane) was electrophoresed under denaturing conditions in a 2.2% agarose-formaldehyde gel. The RNA was then transferred from the gel to a nylon membrane (Gene Screen Plus; DuPont, Boston, Massachusetts, USA) by upward capillary transfer for 24 hours using 10× SSPE (20× SSPE 3M NaCl, 0.2 M NaH2PO4-H20, and 0.02 M EDTA-Na2) as the transfer solution. The membrane was prehybridized in a minimum volume (50 μl/cm2) of prehybridization solution (5× SSPE, 50% formamide, 5× Denhardt’s solution, 1% SDS, and 100 μg/ml denatured salmon sperm [Life Technologies Inc.]) at 42°C for 4 hours in a hybridization oven (Bellco Glass Inc., Vineland, New Jersey, USA). The prehybridization solution was removed, and the same volume of fresh hybridization solution (identical to prehybridization solution except nonhomologous DNA is omitted) plus 32P-labeled probes were added. Approximately 1.2 ng of purified cDNA (the specific activity was about 1.7 × 10⁻⁹ cpm/μg cDNA) was added per milliliter of hybridization solution. Full-length cDNA probes for mouse UCP1, malic enzyme, and GAPDH were utilized. The hybridization was performed for 24 hours. Hybridized filters were then washed (15 minutes with 2× SSPE at room temperature; 45 minutes with 2× SSPE + 2% SDS at 65°C; and 15 minutes with 0.1% SSPE at room temperature) and autoradiographed at –70°C for 24–72 hours. Signal intensity was determined by PhosphorImager (Molecular Dynamics, Sunnyvale, California, USA).
Isolation and cAMP generation in brown adipocytes.
Freshly dispersed brown adipocytes were isolated as described previously (37), after some modifications (38). Cell integrity was confirmed by Trypan blue exclusion in the absence of BSA. Cells were counted and diluted to approximately 500,000 cells/ml. Diluted cells were incubated for 1 hour in the presence of 500 μM IBMX (a phosphodiesterase inhibitor) and 0.3 U/ml adenosine deaminase. Dose-response curves for NE, β-3 adrenergic receptor agonist CL316,234 (gift from K. Steiner, Wyeth-Ayerst Research, Princeton, New Jersey, USA) or forskolin were generated as described along with the experiment. All additions were diluted in the incubation medium (DMEM/F12). Incubation was terminated by adding 0.5 ml perchloric acid to a final concentration of 6.0%. cAMP production was measured by solid-phase RIA using an NENAE kit, according to the instructions of the manufacturer. Adenylyl cyclase activity was expressed as picomoles of cAMP per hour per 105 cells.
Statistical analysis.
Results are expressed as mean ± SD. Multiple comparisons were performed by one-way ANOVA followed by the Student-Newman-Keuls test.
Results
IBAT thermal response during NE infusion.
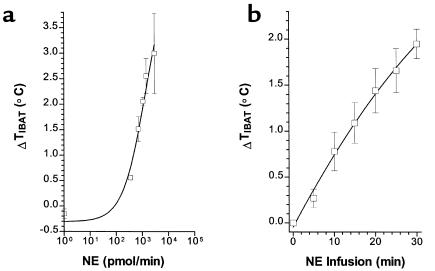
Increased IBAT temperature in response to catecholamine infusion has been previously demonstrated in rats (5), but has not been reported in mice. This dynamic measurement determines the thermogenic response of brown fat to catecholamines as a consequence of thyroid hormone status. Euthyroid mice were used to determine whether IBAT thermal production responded to infused NE in a dose- and time-dependent fashion (Figure 1). At baseline, the core and IBAT temperature in euthyroid mice were not significantly different (36.4 ± 0.2 and 36.5 ± 0.3°C, respectively). The infusion of saline into anesthetized mice resulted in no significant change (–0.2 ± 0.1°C) in IBAT temperature at the end of the 30-minute infusion period. The infusion of NE in doses up to a maximum of 2.9 × 10³ pmol/min, for a 30-minute period, increased IBAT temperature to a maximum of 3°C (Figure 1a). Significant elevations above control were seen at all doses. A significant increase in IBAT temperature was seen after only 5 minutes of infusion and increased progressively with infusion periods up to 30 minutes (Figure 1b). NE, therefore, stimulates IBAT thermal response in a time- and dose-dependent fashion in mice, similar to the levels previously reported in rats (5). Stimulation at higher doses of NE, or for periods significantly longer than 30 minutes, were not consistently tolerated by the mice. Core temperature also rose in response to NE infusion, but the maximum increase in core temperature lagged behind and was lower (maximal response 2°C), compared with IBAT thermogenesis.
Figure 1.
IBAT thermal response (ΔTIBAT) to NE infusion in euthyroid control mice. (a) Dose-response curve of maximal ΔTIBAT°C versus NE during 30-minute infusion. (b) Time course of ΔTIBAT °C during infusion of 5 × 10³ pmol/min NE. Values are the mean ± SD of three to four mice.
IBAT thermal response during NE infusion in GC-1– versus T3–replaced mice.
Mice were initially made hypothyroid by treatment with a low-iodine/PTU diet. After 10 days of this diet, serum T4 was markedly reduced compared with euthyroid age-matched controls (0.10 ± 0.03 vs. 1.2 ± 0.10 μg/dl). Mice were then divided into three groups: one to receive daily intraperitoneal doses of T3 (7, 14, or 28 ng/g/day) for 10 days; one to receive equimolar doses of GC-1 (3.6, 7.2, and 14.4 ng/g/day) for 10 days; and a saline vehicle control group. These doses correspond to two, four, and eight times the physiological replacement dose, as shown in a recent study of T3 and GC-1 actions on the heart and lipid metabolism (27). Previous studies have shown that a high level of TR saturation, corresponding to levels of two to four times the physiological dose, is required in brown fat to restore normal thermal production (14). Cold exposure normally increases BAT T3 levels three- to fourfold, primarily owing to stimulation of the D2 enzyme.
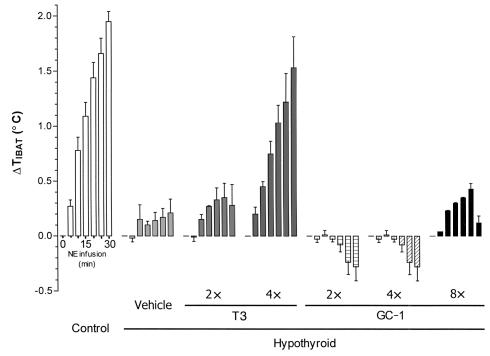
On the basis of the IBAT thermal response in euthyroid mice (Figure 1), we used an NE dose of 1,076 pmol/min of NE for 30 minutes to achieve an intermediate increase in IBAT temperature (2 ± 0.2°C). The IBAT thermal response was approximately 90% reduced in hypothyroid mice compared with euthyroid mice (Figure 2). The infusion of saline did not change the temperature of the animals. In hypothyroid mice, even after 30 minutes of NE infusion, the IBAT temperature increased only about 0.2°C. Replacement with four times the physiological dose of T3, but not two times the T3 dose, restored the thermal response to the level of the euthyroid group (1.5 ± 0.5 vs. 2.0 ± 0.2°C). Animals treated with the eight times the T3 dose did not survive the NE infusion, apparently as a result of adrenergic hypersensitivity.
Figure 2.
IBAT thermogenic response (ΔTIBAT) during NE infusion in euthyroid and hypothyroid mice treated with T3 or GC-1. The data represent the maximal response every 5 minutes over a period of 30 minutes of NE infusion. Euthyroid (control) mice were compared with hypothyroid mice treated with vehicle, T3, or GC-1. The hypothyroid animals were kept on a low-iodine diet with propylthiouracil for 8 days and then received daily intraperitoneal injections of T3 for 10 days at 0 (vehicle only), or 7, 14, or 28 ng/g/day, corresponding to approximately two, four, and eight times the physiological replacement dose. Another five groups of mice were treated with 0, 3.6, 7.2, 14.4, and 28.8 ng/g/day GC-1. The GC-1 doses are equimolar to T3 doses. At the end of the treatment period, the IBAT thermal response to NE was measured. Values are the mean ± SD of three to four mice.
Animals treated with GC-1 at an equimolar dose to T3 or higher failed to significantly increase the IBAT thermal production in response to NE at any of the doses tested (Figure 2). The GC-1–treated animals had IBAT temperature levels similar to those seen in the hypothyroid animals at all doses (–0.2 ± 0.3°C [at two times the dose], 0.3 ± 0.4 °C [at four times the dose], –0.1 ± 0.0°C [at eight times the dose], and –0.1 ± 0.7°C [at 16 times the dose]). These findings show a clear deficit of IBAT thermal production in response to NE infusion in mice replaced with GC-1 compared with those replaced with T3.
UCP1 levels in IBAT.
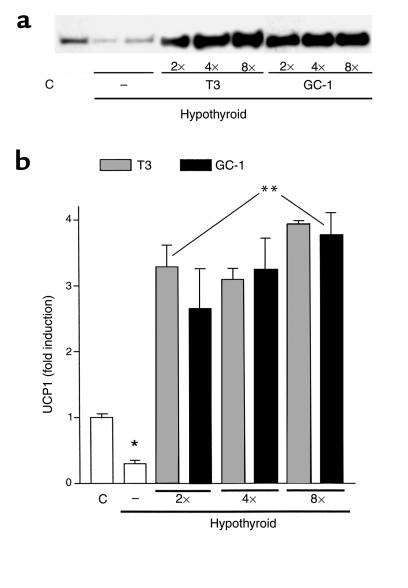
The absence of an IBAT thermogenic response to NE infusion in mice treated with GC-1 was thought most likely to be due to reduced thyroid hormone stimulation of UCP1 in brown fat. Previous studies have demonstrated all TR isoforms in BAT, with a modest increase in TRβ mRNA in response to T3 treatment (39, 40). We therefore compared the levels of brown fat UCP1 protein in T3– and GC-1–treated animals. UCP1 protein levels, as determined by Western blot analysis, were approximately 60% decreased in hypothyroid mice (Figure 3, a and b). Treatment with T3 increased UCP1 levels to values that were approximately threefold higher than those found in euthyroid controls. Remarkably, at every treatment dose, GC-1 administration promoted a similar increase in UCP1 levels to that seen with T3. T3 increased the levels of UCP1 protein approximately ten times compared with hypothyroid and approximately 3.5 times when compared with euthyroid. GC-1 treatment showed similar increases in UCP1 protein as T3, increasing to the same magnitude in all the doses used (two times GC-1, approximately 8.3 times; four times GC-1, approximately 10.8 times; and eight times GC-1, approximately 12.6 times, all compared with hypothyroid animals). GC-1, therefore, stimulates a normal amount of UCP1 expression but did not result in NE-induced heat production.
Figure 3.
Mitochondrial UCP1 protein from IBAT of euthyroid control (C) or hypothyroid mice treated with T3, GC-1, or vehicle (–). (a) Western blot of mitochondrial protein using anti-UCP1 antibody. (b) Blots were analyzed by densitometry, and the results are shown. Values are the mean ± SD of three to four mice. The animals were treated as described in the legend to Figure 2. Equivalent protein loading was confirmed by Coomassie blue stain of gel. *P < 0.05 vs. control animals; **P < 0.05 vs. hypothyroid animals, by one-way ANOVA.
Tissue markers of thyroid hormone action.
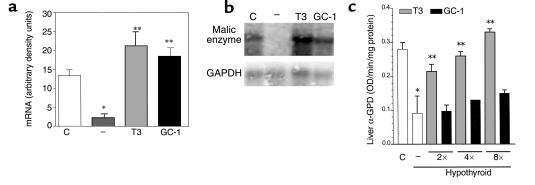
The action of GC-1 on the expression of malic enzyme mRNA in the liver was also determined (Figure 4, a and b). Hypothyroid mice had markedly reduced levels, as has been reported previously (41). Malic enzyme mRNA levels were 5.8-fold higher in euthyroid control mice compared with hypothyroid mice. Treatment with T3 or GC-1 increased malic enzyme mRNA levels 9.3- and eightfold, respectively, compared with levels in hypothyroid animals. This magnitude of induction is consistent with an approximately tenfold increase in rat liver malic enzyme mRNA reported in response to T3 (41). These findings show liver sensitivity to GC-1 to a similar magnitude as the T3 response.
Figure 4.
Markers of T3 or GC-1 actions in the liver. (a) Malic enzyme mRNA was quantitated in euthyroid control animals (C), and hypothyroid animals treated with vehicle (–), T3, or GC-1. (b) Representative Northern blot of malic enzyme mRNA from liver. GAPDH mRNA expression was used for normalization. Densitometric analysis of mRNA expression is shown in arbitrary units (malic enzyme mRNA/GAPDH mRNA). (c) Liver α-GPD was measured in the mitochondrial fraction. The animals were treated as described in the legend to Figure 2. Values are the mean ± SD of three to four mice. *P < 0.05 vs. control animals; **P < 0.05 vs. hypothyroid animals, by one-way ANOVA.
The effects of thyroid status and GC-1 treatment were also determined on the activity of the thyroid hormone-regulated α-GPD enzyme (Figure 4c). In hypothyroid mice, as expected, the α-GPD activity in the liver was 67% lower when compared with euthyroid animals. Mice treated with T3 at two or four times the physiological doses had normal levels of α-GPD activity. Mice treated with GC-1 had increased α-GPD activity, increasing approximately 30% and 35% respectively, compared with hypothyroid animals, but not as high as that seen with T3 treatment.
Thyroid hormone action on the heart.
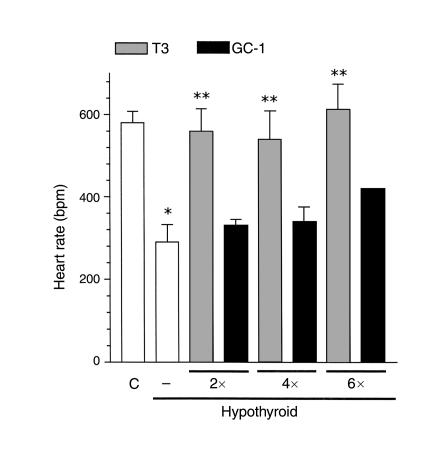
GC-1 has previously been shown in rats to have less chronotropic and inotropic effects on the heart, compared with T3 (27). The mean heart rate was measured in anesthetized mice (Figure 5). The hypothyroid animals had a lower heart rate when compared with euthyroid mice (289 ± 35 beats per minute vs. 580 ± 28 beats per minute). Treatment with T3 increased the heart rate to normal values (559 ± 54 beats per minute), but the equimolar dose of GC-1 did not significantly increase heart rate (339 ± 21 beats per minute). When the hypothyroid animals were treated with two and four times the T3 doses, the mean heart rate was normalized. Treatment with GC-1 increased the basal heart rate when compared with hypothyroid animals, but it did not correct to euthyroid levels.
Figure 5.
Heart rate in T3- versus GC-1–replaced hypothyroid animals. Resting heart rate was measured in anesthetized animals after a 10-minute stabilization period. The animals were treated as described in the legend to Figure 2. Values are the mean ± SD of three to four mice. *P < 0.05 vs. control animals; **P < 0.05 vs. hypothyroid animals, by one-way ANOVA.
In the heart, α-GPD activity was reduced 30% in hypothyroid animals. T3 treatment normalized the α-GPD activity. GC-1 treatment failed to correct α-GPD activity at two and four times the doses, but normalized with the higher eight times the dose. These results are consistent with previous reports of reduced action of GC-1 on the heart (27).
Core temperature response to cold exposure in GC-1– versus T3–replaced mice.
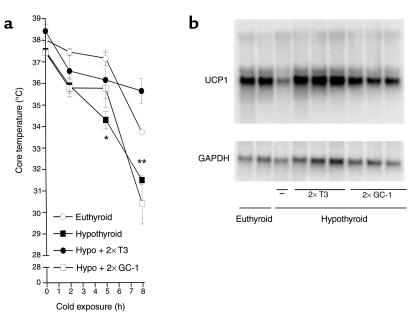
To test whether the poor thermogenic response to NE in GC-1–treated mice could also impair the ability of such mice to sustain core temperature during cold exposure, euthyroid, hypothyroid, and T3– or GC-1–treated (two times the dose) hypothyroid mice were challenged by cold exposure at 4°C (Figure 6a). Euthyroid or hormone-treated animals showed a similar temperature reduction of approximately 2°C during the first 5 hours of cold exposure; however, hypothyroid animals had a significantly lower temperature fall (3.5°C). However, by 8 hours the core temperature in T3-treated mice dropped a total of 2.5°C to approximately 36°C. The core temperature in GC-1–treated mice fell a total of 7.5°C and, in hypothyroid mice, 6.5°C. The response of UCP1 mRNA to cold exposure is primarily mediated by the adrenergic system. The levels of UCP1 mRNA were determined after 8 hours of cold exposure in T3– and GC-1–replaced mice. As expected, hypothyroidism blunted the UCP1 mRNA response to cold stimulation (Figure 6b). T3-treated mice, on the other hand, had normal UCP1 mRNA levels in response to cold exposure, and the levels were not different from those of intact control animals. GC-1–treated mice had an intermediate response between hypothyroid and T3-treated mice, indicating that GC-1 treatment improves, but does not normalize, BAT adrenergic responsiveness.
Figure 6.
Core temperature profile and IBAT UCP1 mRNA in mice kept in a cold environment (4°C) for 8 hours. The hypothyroid mice were treated with vehicle, T3 (7.2 ng/g/day) or GC-1 (3.6 ng/g/day) for 10 days and then transferred to a cold room. Animals were treated as described in the legend to Figure 2. (a) Core temperature response to cold exposure (4°C). Core temperature was measured with a rectal probe at indicated times. (b) Northern blot analysis of UCP1 mRNA from IBAT in euthyroid control and hypothyroid animals treated with vehicle, T3, or GC-1. Values are the mean ± SD of three to four mice. *P < 0.05 vs. control animals; **P < 0.05 vs. hypothyroid animals, by one-way ANOVA.
Adrenergic responsiveness of primary brown adipocytes in vitro.
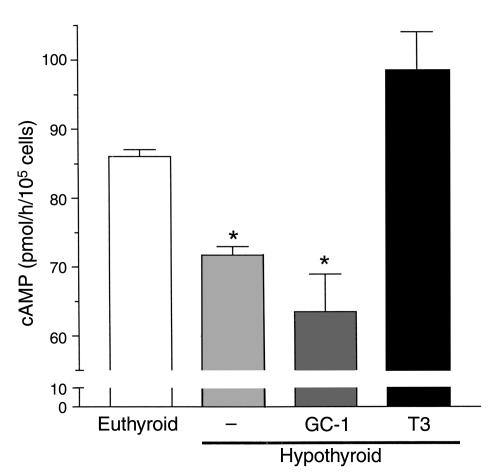
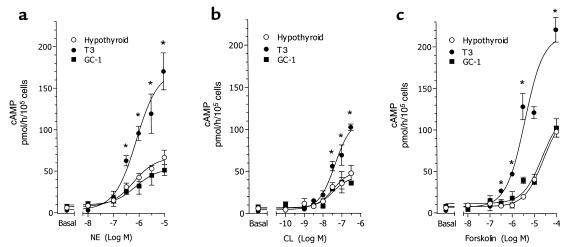
A direct measurement of adrenergic stimulation of isolated brown fat adipocytes was carried out in vitro. Briefly, mice were made hypothyroid and treated with saline or with four times the dose of T3 or of GC-1 for 10 days, as mice were prepared for the in vivo studies. Brown adipocytes were isolated, cultured, and stimulated with NE for 60 minutes. Cells obtained from hypothyroid animals generated approximately 25% less cAMP than controls (P < 0.05) (Figure 7). The NE response was normalized in cells obtained from T3-treated, but not GC-1–treated, animals. Brown adipocytes were incubated with various concentrations of NE, CL316,243 (a selective β3 adrenergic receptor agonist) and forskolin, and the generation of cAMP was measured (Figure 8). A marked dose-response increase in cAMP production was seen in brown adipocytes taken from T3-treated mice, with any of the adrenergic stimuli. In contrast, the response in primary brown adipocytes from GC-1–treated animals was indistinguishable from that of cells from hypothyroid mice (Figure 8). The cAMP response of brown adipocytes from euthyroid controls was similar to that of T3-treated mice (data not shown). Adrenergic sensitivity, therefore, requires the actions of TRα.
Figure 7.
NE-stimulated cAMP accumulation in isolated brown adipocytes of euthyroid control, compared with vehicle (–) and T3- and GC-1–treated hypothyroid mice. Animals received T3 (14.4 ng/g/day) or GC-1 (7.2 ng/g/day) by intraperitoneal injection for 10 days. Cells were isolated as indicated in Methods. NE was added at 10–6 M, and the incubation lasted 1 hour. The media also contained 0.3 U/ml adenosine deaminase and 500 μM IBMX. Values are the mean ± SD of four tubes. *P < 0.05 vs. control cells, by one-way ANOVA.
Figure 8.
Dose-response curve of cAMP accumulation in isolated brown adipocytes of vehicle (hypothyroid) or T3- or GC-1–treated hypothyroid mice. Cells were prepared as described in the legend to Figure 7, and were incubated with the indicated doses of NE (a), the β3 adrenergic receptor selective agonist CL (b), or forskolin (c). Values are the mean ± SD of three tubes. *P < 0.05 vs. hypothyroid and GC-1–treated cells, by one-way ANOVA.
Discussion
The availability of the TRβ-selective agonist, GC-1, provides a unique in vivo model of adaptive thermogenesis. GC-1 treatment of hypothyroid animals restored UCP1 expression, but it did not restore adrenergic sensitivity in BAT or in the heart. Previous studies have suggested, by indirect physiological evidence, that such a disparity between UCP1 expression and thermogenesis could occur (5). We have shown in the same tissue, two distinct thyroid hormone–dependent pathways that are TR isoform selective.
Norepinephrine-induced BAT thermogenesis is clearly impaired in the GC-1–treated hypothyroid mice. This is supported by the absence of a thermal response to NE infusion (Figure 2), the inability of GC-1–treated hypothyroid mice to sustain core temperature when exposed to 4°C (Figure 6a), and impaired accumulation of UCP1 mRNA levels during acute cold exposure (Figure 6b). These are all unexpected findings given that both TRα and β are expressed in brown fat (39, 40). T3 modestly stimulates TRβ mRNA (39, 40), and GC-1 may differentially influence TR isoform content in BAT, contributing to differential responsiveness. The absolute selectivity of action of GC-1 on brown fat adaptive thermogenesis differs from most actions that can be mediated by either TRα or β (21).
A possible explanation for the present findings is impaired GC-1 permeability into brown adipocytes, compared with T3. Although the tissue distribution of GC-1 differs somewhat from that of T3 (27), the normal stimulation of UCP1 protein in GC-1–treated mice in our studies indicates a biologic action of GC-1 in brown adipocytes, at the same magnitude as the response to equimolar T3. The findings with GC-1–treated hypothyroid mice are consistent with reduced basal core temperature in the TRα-knockout and combined TRα/β-knockout animals (28–32). Recent preliminary results in TRα/β compound–knockout animals show reduced BAT thermogenesis despite normal levels of UCP1 mRNA (42).
T3 stimulates UCP1 gene transcription in fetal brown adipocyte primary cultures (19) and also in transient transfection analysis (17). In the latter studies, the UCP1 promoter segment conferred fourfold responsiveness to T3, fourfold to cAMP, or 12-fold to both agents combined. Two thyroid hormone response elements (TREs) that confer T3-mediated transactivation and potentiation of the cAMP effect have been identified (17). In addition, T3 also stabilizes UCP1 mRNA, prolonging its half-life fourfold (19, 43). It is, therefore, not surprising that GC-1 normalizes UCP1 levels similarly to T3. However, GC-1 treatment did not normalize the surge in UCP-1 mRNA observed during cold exposure or cAMP generation in isolated brown adipocytes, indicating deficient thyroid hormone catecholamine synergism.
Although the mechanism for thyroid hormone potentiation of adrenergic action is not established, there are influences of thyroid status on both the adrenergic receptor and on signal transduction. Reduced adrenergic responsiveness in hypothyroidism, for example, is not fully explained by reduced adrenergic receptor number. Although β1 receptors are decreased, β3 receptors are increased in hypothyroid brown adipocytes (9, 44, 45). Interestingly, the adenylyl cyclase response to forskolin, a direct activator of this enzyme, is markedly decreased in hypothyroid brown adipocytes, indicating the involvement of postreceptor mechanisms (9). Furthermore, Gαi protein levels are increased in hypothyroid brown adipocytes (7), adding to the overall inhibition of adrenergic transduction in hypothyroidism. This is particularly important because hypothyroid brown adipocytes have a relative increase in the activity of the V and VI subtypes of adenylyl cyclase, which are the most sensitive to Gαi inhibition (7). Brown fat from hypothyroid rats, however, has predominantly a postreceptor defect, which leads to a marked reduction in cAMP generation in response to catecholamines (7–9, 46). Given that the response to all three adrenergic agents was blunted in GC-1–treated mice (Figure 8), it is likely that the impairment occurs at several levels of adrenergic signal transduction.
TR isoform specificity in the adrenergic signaling pathway likely occurs in other tissues such as the heart. In the present study, as has been reported previously (27), treatment with three different doses of GC-1 did not restore heart rate, which remained approximately one-third below the level seen in T3-treated mice. T3-responsive genes in the heart (47) required nine times doses of GC-1 to normalize (27). Given the important role of adrenergic signaling in heart function, it is expected that the expression of gene products involved in the cardiac adrenergic transduction will also be subnormal in GC-1–treated mice.
The liver was largely sensitive to GC-1 action as reflected in malic enzyme mRNA levels, but was less responsive to stimulation of mitochondrial α-GPD activity (Figure 4). The malic enzyme mRNA result confirms good access of GC-1 to hepatocytes, as well as previous reports of GC-1 lowering plasma cholesterol levels in rats (27). The mitochondrial α-GPD is a standard marker of thyroid status in various tissues (48), and its gene has just recently been cloned and shown to be T3 responsive (49). The reduced response of GC-1 compared with T3 may indicate other factors required for α-GPD enzyme activity.
There have been a variety of approaches to modifying adaptive thermogenesis pharmacologically, especially in treatment of obesity (1). The identification of TR-isoform selective pathways for the stimulation of thermogenesis may provide novel pharmacological targets. The determination of changes in TR crystal structure as a function of selective agonist binding has indicated specific amino acid residues that confer ligand selectivity (50). The sympathoadrenal system and thyroid hormone coordinate a number of critical processes, including homeostasis of the cardiovascular system, adaptive thermogenesis and homeostasis of energy expenditure, and body temperature. The rapid modulation of these systems is disrupted as a consequence of thyroid dysfunction (17). A TRα -selective agonist would be expected to potentiate adaptive thermogenesis, but would also likely have potent cardiac effects. Further work to identify the mechanisms of adrenergic augmentation will be necessary to target these actions specifically. These findings provide an important tool for mechanistic studies of adaptive thermogenesis, as well as potential therapeutic targets for clinical conditions associated with sympathetic nervous system-thyroid hormone interactions.
Acknowledgments
This work was supported by grants from the NIH (DK-43714 to G.A. Brent and DK-52798 to T.S. Scanlan), a fellowship from the CAPES in Brazil (to M.O. Ribeiro), and Veterans Affairs Medical Research Funds (to G.A. Brent).
Footnotes
See the related Commentary beginning on page 35.
References
- 1.Lowell BB, Spiegelman BM. Towards a molecular understanding of adaptive thermogenesis. Nature. 2000;404:652–660. doi: 10.1038/35007527. [DOI] [PubMed] [Google Scholar]
- 2.Silva JE. Thyroid hormone control of thermogenesis and energy balance. Thyroid. 1995;5:481–492. doi: 10.1089/thy.1995.5.481. [DOI] [PubMed] [Google Scholar]
- 3.Curcio C, et al. Development of compensatory thermogenesis in response to overfeeding in hypothyroid rats. Endocrinology. 1999;140:3438–3443. doi: 10.1210/endo.140.8.6906. [DOI] [PubMed] [Google Scholar]
- 4.Sellers EA, You SS. Role of the thyroid in metabolic responses to a cold environment. Am J Physiol. 1950;163:81–91. doi: 10.1152/ajplegacy.1950.163.1.81. [DOI] [PubMed] [Google Scholar]
- 5.Ribeiro MO, et al. Evidence of UCP1-independent regulation of norepinephrine-induced thermogenesis in brown fat. Am J Physiol Endocrinol Metab. 2000;279:E314–E322. doi: 10.1152/ajpendo.2000.279.2.E314. [DOI] [PubMed] [Google Scholar]
- 6.Swanson HE. Interrelations between thyroxine and adrenaline in the regulation of oxygen consumption in the albino rat. Endocrinology. 1956;59:217–225. doi: 10.1210/endo-59-2-217. [DOI] [PubMed] [Google Scholar]
- 7.Carvalho SD, Bianco AC, Silva JE. Effects of hypothyroidism on brown adipose tissue adenylyl cyclase activity. Endocrinology. 1996;137:5519–5529. doi: 10.1210/endo.137.12.8940379. [DOI] [PubMed] [Google Scholar]
- 8.Rubio A, Raasmaja A, Silva JE. Thyroid hormone and norepinephrine signaling in brown adipose tissue. II. Differential effects of thyroid hormone on beta 3-adrenergic receptors in brown and white adipose tissue. Endocrinology. 1995;136:3277–3284. doi: 10.1210/endo.136.8.7628361. [DOI] [PubMed] [Google Scholar]
- 9.Rubio A, Raasmaja A, Maia AL, Kim KR, Silva JE. Effects of thyroid hormone on norepinephrine signaling in brown adipose tissue. I. Beta 1- and beta 2-adrenergic receptors and cyclic adenosine 3′,5′-monophosphate generation. Endocrinology. 1995;136:3267–3276. doi: 10.1210/endo.136.8.7628360. [DOI] [PubMed] [Google Scholar]
- 10.Nichols D, Locke RM. Thermogenic mechanisms in brown fat. Physiol Rev. 1984;64:1–64. doi: 10.1152/physrev.1984.64.1.1. [DOI] [PubMed] [Google Scholar]
- 11.Enerback S, et al. Mice lacking mitochondrial uncoupling protein are cold-sensitive but not obese. Nature. 1997;387:90–94. doi: 10.1038/387090a0. [DOI] [PubMed] [Google Scholar]
- 12.Ikemoto H, Hiroshige T, Itoh S. Oxygen consumption of brown adipose tissue in normal and hypothyroid mice. Jpn J Physiol. 1967;17:516–522. doi: 10.2170/jjphysiol.17.516. [DOI] [PubMed] [Google Scholar]
- 13.Bianco AC, Silva JE. Intracellular conversion of thyroxine to triiodothyronine is required for the optimal thermogenic function of brown adipose tissue. J Clin Invest. 1987;79:295–300. doi: 10.1172/JCI112798. [DOI] [PMC free article] [PubMed] [Google Scholar]
- 14.Bianco AC, Silva JE. Optimal response of key enzymes and uncoupling protein to cold in BAT depends on local T3 generation. Am J Physiol. 1987;253:E255–E263. doi: 10.1152/ajpendo.1987.253.3.E255. [DOI] [PubMed] [Google Scholar]
- 15.Silva JE. Full expression of uncoupling protein gene requires the concurrence of norepinephrine and triiodothyronine. Mol Endocrinol. 1988;2:706–713. doi: 10.1210/mend-2-8-706. [DOI] [PubMed] [Google Scholar]
- 16.Silva JE, Larsen PR. Adrenergic activation of triiodothyronine production in brown adipose tissue. Nature. 1983;305:712–713. doi: 10.1038/305712a0. [DOI] [PubMed] [Google Scholar]
- 17.Rabelo R, Schifman A, Rubio A, Sheng X, Silva JE. Delineation of thyroid hormone-responsive sequences within a critical enhancer in the rat uncoupling protein gene. Endocrinology. 1995;136:1003–1013. doi: 10.1210/endo.136.3.7867554. [DOI] [PubMed] [Google Scholar]
- 18.Rabelo R, Reyes C, Schifman A, Silva JE. Interactions among receptors, thyroid hormone response elements, and ligands in the regulation of the rat uncoupling protein gene expression by thyroid hormone. Endocrinology. 1996;137:3478–3487. doi: 10.1210/endo.137.8.8754777. [DOI] [PubMed] [Google Scholar]
- 19.Guerra C, Roncerno C, Porras A, Fernandez M, Benito M. Triiodothyronine induces the transcription of the uncoupling protein gene and stabilizes its mRNA in fetal rat brown adipocyte cultures. J Biol Chem. 1996;271:2076–2081. doi: 10.1074/jbc.271.4.2076. [DOI] [PubMed] [Google Scholar]
- 20.Brent GA. The molecular basis of thyroid hormone action. N Engl J Med. 1994;331:847–853. doi: 10.1056/NEJM199409293311306. [DOI] [PubMed] [Google Scholar]
- 21.Brent GA. Tissue-specific actions of thyroid hormone: insights from animal models. Reviews in Endocrine and Metabolic Disorders. 2000;1:27–34. doi: 10.1023/a:1010056202122. [DOI] [PubMed] [Google Scholar]
- 22.Hsu J-H, Brent GA. Thyroid hormone receptor gene knockouts. Trends Endocrinol Metab. 1998;9:103–112. doi: 10.1016/s1043-2760(98)00026-5. [DOI] [PubMed] [Google Scholar]
- 23.Forrest D, Erway LC, Ng L, Altschuler R, Curran T. Thyroid hormone receptor β is essential for development of auditory function. Nat Gen. 1996;13:354–357. doi: 10.1038/ng0796-354. [DOI] [PubMed] [Google Scholar]
- 24.Weiss RE, et al. Thyroid hormone action on liver, heart, and energy expenditure in thyroid hormone receptor β-deficient mice. Endocrinology. 1998;139:4945–4952. doi: 10.1210/endo.139.12.6412. [DOI] [PubMed] [Google Scholar]
- 25.Abel ED, et al. Novel insight from transgenic mice into thyroid hormone resistance and the regulation of thyrotropin. J Clin Invest. 1999;103:271–279. doi: 10.1172/JCI5205. [DOI] [PMC free article] [PubMed] [Google Scholar]
- 26.Kaneshige M, et al. Mice with a targeted mutation in the thyroid hormone beta receptor gene exhibit impaired growth and resistance to thyroid hormone. Proc Natl Acad Sci USA. 2000;97:13209–13214. doi: 10.1073/pnas.230285997. [DOI] [PMC free article] [PubMed] [Google Scholar]
- 27.Trost SU, et al. The thyroid hormone receptor-β-selective agonist GC-1 differentially affects plasma lipids and cardiac activity. Endocrinology. 2000;141:3057–3064. doi: 10.1210/endo.141.9.7681. [DOI] [PubMed] [Google Scholar]
- 28.Wikstrom L, et al. Abnormal heart rate and body temperature in mice lacking thyroid hormone receptor α1. EMBO J. 1998;16:4412–4420. doi: 10.1093/emboj/17.2.455. [DOI] [PMC free article] [PubMed] [Google Scholar]
- 29.Johansson C, Vennstrom B, Thoren P. Evidence that decreased heart rate in thyroid hormone receptor- α-1-deficient mice is an intrinsic defect. Am J Physiol. 1998;275:R640–R646. doi: 10.1152/ajpregu.1998.275.2.R640. [DOI] [PubMed] [Google Scholar]
- 30.Johansson C, Gothe S, Forrest D, Vennstrom B, Thoren P. Cardiovascular phenotype and temperature control in mice lacking thyroid hormone receptor-β or both α1 and β. Am J Physiol. 1999;276:H2006–H2012. doi: 10.1152/ajpheart.1999.276.6.H2006. [DOI] [PubMed] [Google Scholar]
- 31.Gothe S, et al. Mice devoid of all known thyroid hormone receptors are viable but exhibit disorders of the pituitary-thyroid axis, growth, and bone maturation. Genes Dev. 1999;13:1329–1341. doi: 10.1101/gad.13.10.1329. [DOI] [PMC free article] [PubMed] [Google Scholar]
- 32.Gauthier K, et al. Different functions for the thyroid hormone receptors TRalpha and TRbeta in the control of thyroid hormone production and post-natal development. EMBO J. 1999;18:623–631. doi: 10.1093/emboj/18.3.623. [DOI] [PMC free article] [PubMed] [Google Scholar]
- 33.Chiellini G, et al. A high-affinity subtype-selective agonist ligand for the thyroid hormone receptor. Chem Biol. 1998;5:299–306. doi: 10.1016/s1074-5521(98)90168-5. [DOI] [PubMed] [Google Scholar]
- 34.Bradford M. A rapid and sensitive method for the quantitation of microgram quantities of protein utilizing the principle of protein-dye binding. Anal Biochem. 1976;72:248–254. doi: 10.1016/0003-2697(76)90527-3. [DOI] [PubMed] [Google Scholar]
- 35.Oppenheimer JH, Silva E, Schwartz HL, Surks MI. Stimulation of hepatic mitochondrial alpha-glycerophosphate dehydrogenase and malic enzyme by L-triiodothyronine. Characteristics of the response with specific nuclear thyroid hormone binding sites fully saturated. J Clin Invest. 1977;59:517–527. doi: 10.1172/JCI108667. [DOI] [PMC free article] [PubMed] [Google Scholar]
- 36.Gardner RS. A sensitive colorimetric assay for mitochondria a-glycerophosphate dehydrogenase. Anal Biochem. 1953;59:400–408. doi: 10.1016/0003-2697(74)90033-5. [DOI] [PubMed] [Google Scholar]
- 37.Fain JN, Reed N, Natori Y. The isolation and metabolism of brown fat cells. J Biol Chem. 1967;242:1887–1894. [PubMed] [Google Scholar]
- 38.Bianco AC, Carvalho SD, Carvalho CR, Rabelo R, Moriscot AS. Thyroxine 5′-deiodination mediates norepinephrine-induced lipogenesis in dispersed brown adipocytes. Endocrinology. 1998;139:571–578. doi: 10.1210/endo.139.2.5737. [DOI] [PubMed] [Google Scholar]
- 39.Hernandez A, Obregon MJ. Presence and mRNA expression of T3 receptors in differentiating rat brown adipocytes. Mol Cell Endocrinol. 1996;121:37–46. doi: 10.1016/0303-7207(96)03849-x. [DOI] [PubMed] [Google Scholar]
- 40.Reyne Y, Nougues J, Cambon B, Viguerie-Bascands N, Casteilla L. Expression of c-erbA alpha, c-erbA beta and Rev-erbA alpha mRNA during the conversion of brown adipose tissue into white adipose tissue. Mol Cell Endocrinol. 1996;116:59–65. doi: 10.1016/0303-7207(95)03696-2. [DOI] [PubMed] [Google Scholar]
- 41.Dozin B, Magnuson MA, Nikodem VM. Tissue-specific regulation of two functional malic enzyme mRNAs by triiodothyronine. Biochemistry. 1985;24:5581–5586. doi: 10.1021/bi00341a044. [DOI] [PubMed] [Google Scholar]
- 42.Vennstrom, B., Golouzobova, V., Gullberg, H., Cannon, B., and Nedergaard, J. 2000. Mice deficient for thyroid hormone receptors are cold sensitive. 12th International Thyroid Congress. Kyoto, Japan. Abstract WS-39.
- 43.Bianco AC, Kieffer JD, Silva JE. Adenosine 3′,5′-monophosphate and thyroid hormone control of uncoupling protein messenger ribonucleic acid in freshly dispersed brown adipocytes. Endocrinology. 1992;130:2625–2633. doi: 10.1210/endo.130.5.1374009. [DOI] [PubMed] [Google Scholar]
- 44.Seydoux J, Giacobino JP, Girardier L. Impaired metabolic response to nerve stimulation in brown adipose tissue of hypothyroid rats. Mol Cell Endocrinol. 1982;25:213–226. doi: 10.1016/0303-7207(82)90054-5. [DOI] [PubMed] [Google Scholar]
- 45.Revelli JP, et al. Changes in beta 1- and beta 2-adrenergic receptor mRNA levels in brown adipose tissue and heart of hypothyroid rats. Biochem J. 1991;277:625–629. doi: 10.1042/bj2770625. [DOI] [PMC free article] [PubMed] [Google Scholar]
- 46.Raasmaja A, Larsen PR. α1-and β-adrenergic agents cause synergistic stimulation of the iodothyronine deiodinase in rat brown adipocytes. Endocrinology. 1989;125:2502–2509. doi: 10.1210/endo-125-5-2502. [DOI] [PubMed] [Google Scholar]
- 47.Pachucki J, Burmeister LA, Larsen PR. Thyroid hormone regulates hyperpolarization-activated cyclic nucleotide-gated channel (HCN2) mRNA in the rat heart. Circ Res. 1999;85:498–503. doi: 10.1161/01.res.85.6.498. [DOI] [PubMed] [Google Scholar]
- 48.Lee YP, Lardy H. Influence of thyroid hormone on L- α glycerophosphate dehydrogenase and other dehydrogenases in various organs of the rat. J Biol Chem. 1965;240:1427–1436. [PubMed] [Google Scholar]
- 49.Gong DW, Bi S, Weintraub BD, Reitman M. Rat mitochondrial glycerol-3-phosphate dehydrogenase gene: multiple promoters, high levels in brown adipose tissue, and tissue-specific regulation by thyroid hormone. DNA Cell Biol. 1998;17:301–309. doi: 10.1089/dna.1998.17.301. [DOI] [PubMed] [Google Scholar]
- 50.Wagner RL, et al. Hormone selectivity in thyroid hormone receptors. Mol Endocrinol. 2001;15:398–410. doi: 10.1210/mend.15.3.0608. [DOI] [PubMed] [Google Scholar]


