Abstract
A female infant of nonconsanguineous Indian parents presented at 4 months with a hypoglycemic convulsion. Further episodes of hypoketotic hypoglycemia were associated with inappropriately elevated plasma insulin concentrations. However, unlike other children with hyperinsulinism, this patient had a persistently elevated blood spot hydroxybutyrylcarnitine concentration when fed, as well as when fasted. Measurement of the activity of L-3-hydroxyacyl-CoA dehydrogenase in cultured skin fibroblasts with acetoacetyl-CoA substrate showed reduced activity. In fibroblast mitochondria, the activity was less than 5% that of controls. Sequencing of the short-chain L-3-hydroxyacyl-CoA dehydrogenase (SCHAD) genomic DNA from the fibroblasts showed a homozygous mutation (C773T) changing proline to leucine at amino acid 258. Analysis of blood from the parents showed they were heterozygous for this mutation. Western blot studies showed undetectable levels of immunoreactive SCHAD protein in the child’s fibroblasts. Expression studies showed that the P258L enzyme had no catalytic activity. We conclude that C773T is a disease-causing SCHAD mutation. This is the first defect in fatty acid β-oxidation that has been associated with hyperinsulinism and raises interesting questions about the ways in which changes in fatty acid and ketone body metabolism modulate insulin secretion by the β cell. The patient’s hyperinsulinism was easily controlled with diazoxide and chlorothiazide.
Introduction
Short-chain L-3-hydroxyacyl-CoA dehydrogenase (SCHAD) catalyzes the penultimate reaction in the mitochondrial fatty acid oxidation spiral, the NAD+-dependent conversion of L-3-hydroxyacyl-CoA to 3-ketoacyl-CoA. The cDNA and genomic sequences for human SCHAD have been elucidated (1, 2). Northern blot analysis of SCHAD mRNA revealed a single transcript; expression was highest in skeletal and cardiac muscle but also present in liver, kidney, and pancreas (1). Earlier work had shown that the islets of Langerhans contain high SCHAD activity (3, 4). This suggests that the enzyme and the regulation of fat oxidation may have an important function in the β cell.
Deficiency of a mitochondrial fatty acid oxidation enzyme typically produces hypoketotic hypoglycemia; some defects also produce hepatomegaly and skeletal and cardiac myopathy (5). Tein et al. reported reduced SCHAD activity in muscle but not fibroblasts of a patient with recurrent myoglobinuria, hypoketotic hypoglycemia, and cardiomyopathy (6). Bennett et al. described reduced SCHAD activity in the fibroblasts of two children with recurrent ketosis and ketotic hypoglycemia (7) and reduced activity in the liver but not the muscle of three sudden infant death victims (8). To date none of these patients with reduced SCHAD activity has been shown to have mutations in the Schad gene (9). One patient presenting with fulminant hepatic failure at 3 years was found to have G118A and C171A mutations in the Schad gene (10). The SCHAD knockout mouse dies if fasted for 10 hours, whereas wild-type mice survive 24 hours (11).
Apart from fatty acid oxidation defects (FAODs), the main cause of hypoketotic hypoglycemia in infancy is hyperinsulinism (HI). Unlike patients with FAOD, at the time of hypoglycemia, infants with HI have a raised plasma insulin and C-peptide, a low plasma concentration of nonesterified fatty acids (NEFAs), and a normal NEFA/D-3-hydroxybutyrate ratio. The patient described below had clear evidence of elevated plasma insulin and C-peptide when she was hypoglycemic. However, on another occasion, the NEFA/D-3-hydroxybutyrate ratio was at the upper limit of normal, which led to an examination of the blood acylcarnitine profile for evidence of an FAOD. This led to the discovery of SCHAD deficiency.
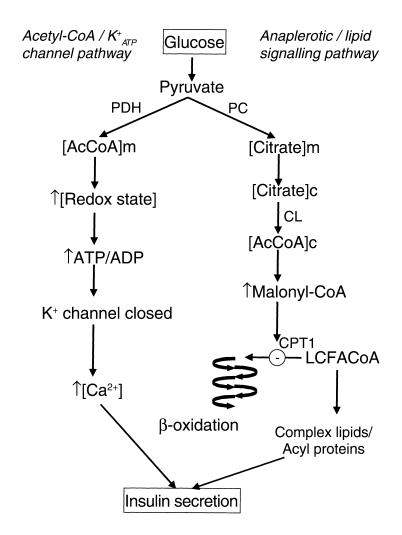
HI can be caused by gain-of-function mutations of glucokinase and glutamate dehydrogenase and defects in the SUR1 or KIR6.2 subunits of the KATP channel in the β cell membrane (12). In these disorders, the pathogenesis of HI can be explained using a simple model of β cell signaling: Increased β cell glucose metabolism leads to increased ATP production from acetyl-CoA and a rise in the ATP/ADP ratio. This closes KATP channels, depolarizing the cell membrane and causing calcium influx through voltage-gated channels, which finally triggers insulin secretion (12, 13). Defects causing HI increase ATP production by increasing glucose or glutamate metabolism, or they cause permanent depolarization. The occurrence of HI in a patient with an FAOD is difficult to explain using this model. Our findings are therefore discussed by reference to the Prentki two-pathway model of β cell signaling (14). This takes account of the fact that a shift from fatty acid oxidation to esterification is a key event in the β cell’s response to glucose. It also recognizes that it is possible to demonstrate the presence of a KATP channel–independent mechanism that augments the β cell’s secretion of insulin in response to high glucose concentrations (14–16).
Methods
The hypoglycemia screen.
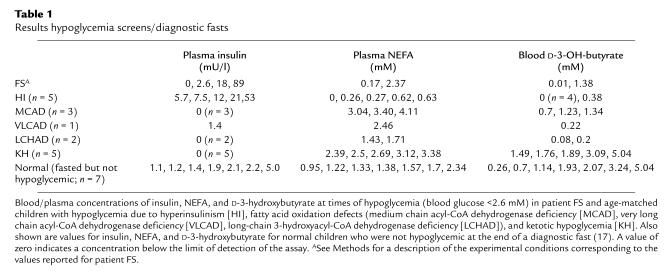
Investigation of hypoglycemia in infancy entails measurement of insulin, NEFA, and D-3-hydroxybutyrate at a time when the blood glucose is less than 2.6 mM (17, 18). Typical results from our unit are shown in Table 1. HI is diagnosed on the basis of plasma insulin greater than or equal to 3 mU/l at the time of hypoglycemia; in seven recent cases, the range was 5.7–53 mU/l. In HI the plasma NEFA concentration at the time of hypoglycemia is low (<0.7 mM), whereas in fasted children who are not hypoglycemic, the plasma NEFA concentration is greater than 0.9 mM, and, in FAOD and ketotic hypoglycemia, the plasma NEFA concentration at the time of hypoglycemia is greater than 1.4 mM. The blood concentration of D-3-hydroxybutyrate at the time of hypoglycemia is less than 1.4 mM in FAOD and less than 0.4 mM in HI.
Table 1.
Results hypoglycemia screens/diagnostic fasts
Case report.
FS is the second child of nonconsanguineous Indian parents. She was born at 38 weeks’ gestation, weighing 3.2 kg. She fed poorly from birth. At 4 months, she had a grand mal convulsion and her blood glucose level was 1.4 mM. Further investigations showed that there were no ketones in her urine after an episode of hypoglycemia and that she had HI (1.3 mM blood glucose, 134 pmol/l (18 mU/l) simultaneous plasma insulin, and 108 pmol/l C-peptide), with normal serum cortisol (381 nmol/l). She was given frequent feeds containing glucose polymer, and her blood glucose remained at 3.0–4.5 mM. However, she had two further convulsions at home; on one occasion her plasma glucose was 2.9 mM and insulin 83 pmol/l (11 mU/l) on arrival in hospital. Nighttime hypoglycemia was managed by the use of uncooked cornstarch.
At 14 months, FS was referred to Great Ormond Street Hospital. She showed evidence of HI, but this was intermittent and unpredictable (Table 1). She required a glucose intake of 8 mg/kg/min to maintain blood glucose levels greater than 2.6 mM; a requirement of more than 6 mg/kg/min indicates HI (18). On one occasion, she tolerated an 18-hour fast without becoming hypoglycemic. On another occasion, after only a 4-hour fast, she had a blood glucose level of 2.5 mM, insulin level of 668 pmol/l (89 mU/l), NEFA of 0.17 mM, and D-3-hydroxybutyrate of 0.01 mM. These results were consistent with HI; however, on other occasions, hypoglycemia occurred without HI. For example, 3 hours after a glucagon provocation (19), she had a blood glucose of 2.1 mM with an insulin level of 1.0 mU/l, NEFA of 2.37 mM, and D-3-hydroxybutyrate of 1.38 mM (NEFA/D-3-hydroxybutyrate ratio at upper end of normal range; ref. 17). Urine organic acid analysis showed mildly raised 3-hydroxybutyrate, 3-hydroxyglutarate, and 3,4-dihydroxybutyrate.
FS was readmitted at 19 months because of recurrent hypoglycemia with fits. She had frequent episodes of hypoglycemia in the hospital. Once when the blood glucose was 2.3 mM, the plasma insulin was 2.6 mU/l, demonstrating a failure to switch off insulin release completely. In view of the high normal NEFA/D-3-hydroxybutyrate ratio recorded on one occasion, a series of blood spot acylcarnitine analyses were undertaken; these all showed raised hydroxybutyrylcarnitine.
In view of the hypoglycemic screens suggesting HI, FS was commenced on diazoxide (5 mg/kg/d) and chlorothiazide (7 mg/kg/d). This led to an improvement in the blood glucose profile, and she could tolerate a 24-hour fast without becoming hypoglycemic. Feeding remained a major problem, eventually requiring a gastrostomy. She was discharged on diazoxide and chlorothiazide. Her glucose control has remained good with no further seizures or episodes of hypoglycemia.
Acylcarnitine analysis by electrospray ionization tandem mass spectrometry.
Blood spots were obtained from FS 1-2 hours after a feed and at times of hypoglycemia. The acylcarnitine profiles were compared with those obtained in random blood spots from 33 normal infants and children and in fasting blood spots from 14 children who were ketotic at the end of a diagnostic fast but whose metabolite and endocrine profile was within our normal range (17). They were also compared with fasting and nonfasting blood spot acylcarnitine profiles from six children with HI.
For analysis of free carnitine and acylcarnitines (as butyl esters), 4.7-mm discs were punched from the Guthrie Card (filter paper containing the blood spot) into 96-well polystyrene microtiter plates. The internal standards added to each sample were D9-carnitine and D3 -acetyl, -propionyl, -octanoyl, and -palmitoyl carnitines. The carnitine species in a blood spot were eluted by sonication with 85% methanol and transferred in solution in methanol to a 96-well polypropylene microtiter plate. The dried sample was dissolved in butanolic HCl and heated to 45° C for 60 minutes. The butanol/HCl was removed with a stream of oxygen-free nitrogen, and the dried sample was reconstituted in 150 μl of 1:1 acetonitrile/water. A 7-μl injection was made into the electrospray ionization source of a Micromass Quattro LC mass spectrometer (Micromass Ltd., Altrincham, United Kingdom). For analysis of butylated carnitine species (0.8 min), the first quadrupole was set to scan from mass/charge ratio (m/z) 200 to 600, and the second mass filter was set to detect fragment ions of m/z 85. Fragment ions of this mass/charge ratio are produced on collision-induced dissociation of the butyl esters of free carnitine and all acylcarnitines; they are believed to originate from the carboxyl group of the carnitine plus carbons 2, 3, and 4.
The size of the hydroxybutyrylcarnitine peak was compared with that of the D3-octanoylcarnitine internal standard (added in an amount equivalent to a concentration of 10 μM in the blood). The blood spot acetylcarnitine concentration was measured by comparison of the peak size with that of the D3-acetylcarnitine standard. Differences between blood spot acetylcarnitine concentrations in FS and ketotic and hyperinsulinemic children were evaluated using the t test.
Measurement of 3-hydroxyacyl-CoA dehydrogenase activity.
Short-, medium-, long-chain and 2-methyl-short-chain 3-hydroxyacyl-CoA dehydrogenase activities were measured in fibroblasts essentially as described by Jackson et al. (20). Fibroblast pellets were resuspended in 25 mM phosphate, 0.2 mM EDTA, and 0.2% vol/vol Triton X-100 (pH 8.0) and incubated on ice for 30 minutes. After centrifugation (11,600 gav for 10 minutes), 3-hydroxyacyl-CoA dehydrogenase activity was measured in the supernatant in the reverse direction by following the disappearance of NADH at 340 nm. The reaction medium consisted of 0.1 M potassium phosphate (pH 7.0)/0.1 mg/ml NADH/0.3 mg/ml BSA (fatty acid free), plus 40 μM ketoacyl-CoA substrate (short chain, acetoacetyl-CoA [Sigma Chemical Company, Poole, United Kingdom]; medium-chain, 3-ketooctanoyl-CoA; long-chain, 3-ketohexadecanoyl-CoA the latter of two substrates being synthesized as described previously [ref. 21]; and 2-methyL-3-hydroxyacyl-CoA dehydrogenase, 2-methyl-acetoacetyl-CoA). 2-Methyl-acetoacetyl-CoA was synthesized from tiglyl-CoA (Sigma) by the sequential actions of crotonase (Sigma) and pig heart 3-hydroxyacyl-CoA dehydrogenase (Sigma) and purified by HPLC. Citrate synthase activity (22) and protein concentration (23) were also measured on the fibroblast supernatant.
Isolation of mitochondria.
Suspensions enriched in mitochondria were prepared from fibroblasts of the patient and a control as described by Hoogeboom (24). Activities of SCHAD and LCHAD were measured in homogenates of freshly prepared mitochondrial suspensions.
Western blotting.
Proteins from fibroblast supernatants prepared as above were separated by SDS-PAGE on a 12% gel, electroblotted overnight, and detected by Western blotting using a rabbit antibody against pig heart SCHAD (from D M Turnbull) and a standard ECL+ protocol (Amersham Pharmacia Biotech Little Chalfont, Bucks, UK). Antibody dilutions were 1:1,000 (primary) and 1:10,000 (secondary). Additional standards of pig heart (Sigma) and bovine liver (Sigma) SCHAD, and rat liver mitochondria were run in parallel.
Immunoprecipitation of SCHAD.
Anti-SCHAD antibody was conjugated to Protein A-acrylic beads (250 μm; Sigma) according to the manufacturers’ instructions. A total of 25 μl of fibroblast supernatant was incubated with 40 μl anti-SCHAD beads for 2 hours at 4°C, after which 1 ml of SCHAD assay buffer was added, the beads removed by centrifugation (11,600 gav for 2 minutes), and HAD assay carried out using acetoacetyl-CoA as described above.
DNA sequence analysis.
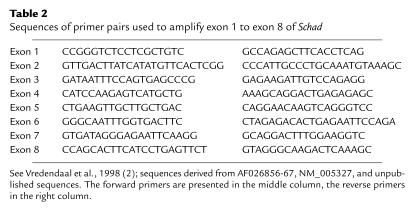
DNA was isolated from fibroblasts from FS and a control. Exon-specific PCR-amplification of Schad sequences was performed with the appropriate primer pair for each exon (Table 2; optimal experimental conditions for primer pairs available on request). PCR products were analyzed on an ABI prism 377 DNA sequencer using the ABI Prism dRhodamine Terminator Cycle Sequencing Ready Reaction kit (PE Applied Biosystems, Foster City, California, USA). Sequence data were analyzed with the Lasergene 99 software program (DNA STAR Inc., Madison, Wisconsin, USA).
Table 2.
Sequences of primer pairs used to amplify exon 1 to exon 8 of Schad
Restriction fragment length analysis.
Genomic DNA of FS, her parents, and 100 controls (50 ethnically matched) was subjected to PCR amplification using exon 7–specific SCHAD primers (Table 2). The PCR products were exposed to Apa1 Roche Molecular Biochemical, Mannheim, Germany) for 2 hours and analyzed on a 2% agarose gel.
In vitro expression of SCHAD.
Total RNA was isolated from fibroblasts of FS and a control. RNA (10 μg) was reverse transcribed using oligo(dT) and MMLV RT (Invitrogen Life Technologies Corporation, Groningen, Netherlards). The complete coding sequence of SCHAD, 81 nucleotides of the 5′UTR, and 33 nucleotides of the 3′UTR were amplified using primers CAGAGTCTGGCTTTCCGCGG and AGGTGTTCTTCTCAGAGCCG, and Advantage cDNA polymerase mix (CLONTECH Laboratories Inc., Palo Alto, California, USA) for 30 cycles. The PCR products were applied to a 1% agarose gel, and the band with the appropriate size was excised, eluted, and reamplified with the same primers for 30 cycles. Amplified cDNAs were cloned in pCR2.1 (Invitrogen), and individual clones were sequenced as described earlier. The faultless wild-type SCHAD sequence was subcloned in pBluescriptSK+ (Stratagene, La Jolla, California, USA). A SCHAD coding sequence containing the mutation detected in patient DNA was composed of a 5′ EcoRI-BstEII fragment from the normal SCHAD coding sequence and a 3′ BstEII-EcoRI fragment from the patient SCHAD coding sequence and subcloned in pBluescriptSK+. To ascertain proper subcloning, the integration sites of the inserts and the inserts of the obtained plasmids were resequenced completely from both sides. Wild-type and mutant proteins were synthesized in a reticulocyte lysate (Promega Corp., Madison, Wisconsin, USA) by coupled in vitro transcription translation from the T7 promoter according to the manufacturer’s instructions. Plasmid containing no insert was used as a control. Enzyme activity was assayed immediately after protein expression, by measuring the disappearance of NADH at 340 nm, using acetoacetyl-CoA (Sigma) as a substrate. Production of SCHAD protein was analyzed by SDS-PAGE followed by Western blotting. Proteins recognized by the antibody were visualized by chemiluminescence (ECL+).
Results
Acylcarnitine analysis (electrospray ionization tandem mass spectrometry).
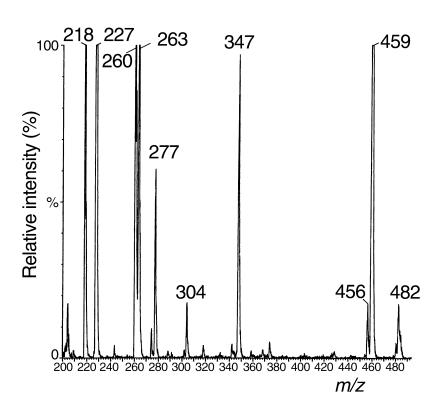
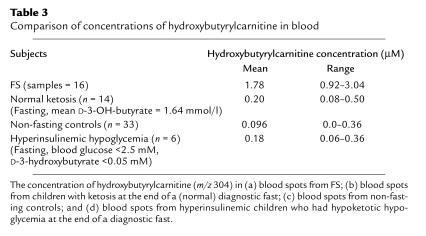
A “precursors of m/z 85” scan obtained on analysis of the patient’s blood spot is shown in Figure 1. The spectrum shows a clear peak of m/z ratio of 304, indicating the presence of hydroxybutyrylcarnitine (butyl ester) or an isomeric compound. The concentration was always more than 0.8 μM, even in nonfasting samples (Table 3). An hydroxybutyrylcarnitine peak could be seen in some normal controls, in some of the normal children who were ketotic at the end of a diagnostic fast, and in some of the hyperinsulinemic children who had hypoketotic hypoglycemia at the end of a fast. However, none of these children had a blood hydroxybutyrylcarnitine concentration greater than 0.5 μM (Table 3). The mean (± 1 SD) acetylcarnitine concentration in blood spots from FS was 27.74 ± 9.8 μM, which was significantly higher (P < 0.0005) than the concentration in blood from normal controls (16.54 ± 3.34) but not significantly different from the blood spot acetylcarnitine concentrations in other hyperinsulinemic children (fasting, hypoglycemic = 26.7± 9.7; nonfasting, normoglycemic = 26.4 ± 9.7). Other carnitine species in blood spots from FS were normal apart from occasional mild elevation of C3, C4, and C18 species (≤ 2 of 16 determinations outside normal range; NS): free carnitine 47–68 (normal range 28.5–109); C3, 0.62–1.64 (<1.27); C4, 0.22–0.74 (<0.72); C5, 0.24–0.58 (<1.22); C6, 0–0.12 (<0.48); C8, 0–0.24 (<0.72); C14:1, 0.04–0.28 (<0.55); C16, 1.04–1.64 (<8.43); C18:2, 0.20–0.82 (<0.64); C18:1, 0.96–2.64 (<2.36); and C18, 0.04– 0.98 (<0.86).
Figure 1.
Analysis of butyl esters of carnitine and acylcarnitine species in a blood spot from FS. Peak identities are: m/z 218, free carnitine; 227, D9-carnitine; 260, acetyl-carnitine; 263, D3-acetylcarnitine; 277, D3-propionylcarnitine; 304, hydroxybutyrylcarnitine; 347, D3-octanoylcarnitine; 456, palmitoylcarnitine ; 459, D3-palmitoylcarnitine; and 482, oleoylcarnitine.
Table 3.
Comparison of concentrations of hydroxybutyrylcarnitine in blood
Activity of L-3-hydroxyacyl-CoA dehydrogenases.
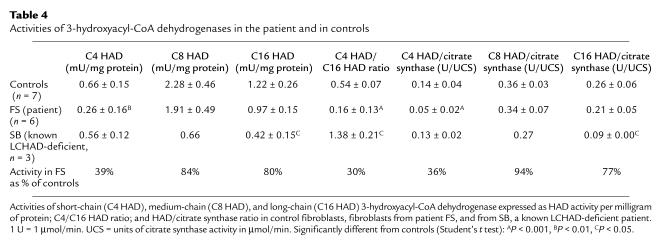
The short-chain HAD activity measured in fibroblasts from FS was significantly lower than that in control fibroblasts whether the activity was expressed per mg protein, as a ratio to LCHAD, or as a ratio to citrate synthase (Table 4). Residual activity in fibroblasts from FS was 35–40% the activity of the controls. Long-chain HAD activity in fibroblasts from the known LCHAD-deficient patient was significantly reduced, but long-chain HAD activity in fibroblasts from FS was not significantly different from that in controls. There was no significant difference in medium-chain HAD activity between FS and controls. When SCHAD and LCHAD activity were measured in a mitochondrial fraction from fibroblasts, the values for FS were 4% and 3% in two separate experiments (SCHAD) and 142% (LCHAD) of the simultaneously assayed control fibroblast mitochondrial fraction.
Table 4.
Activities of 3-hydroxyacyl-CoA dehydrogenases in the patient and in controls
Western blotting.
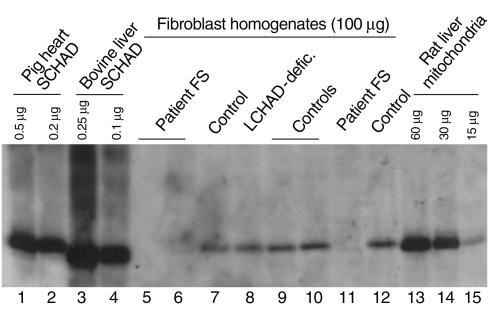
Western blotting of fibroblasts from FS indicated a complete lack of SCHAD immunoreactive protein, whereas SCHAD was readily detectable in both control fibroblasts and fibroblasts from an LCHAD-deficient patient (Figure 2).
Figure 2.
Western blot analysis of SCHAD in fibroblasts. Fibroblast homogenates (100 μg protein) were analyzed by SDS-PAGE, electroblotted, and visualized by reaction with rabbit anti-SCHAD and ECL+. The results were compared with purified pig heart SCHAD, bovine liver SCHAD, and a rat liver mitochondrial preparation (protein loadings shown).
DNA analysis.
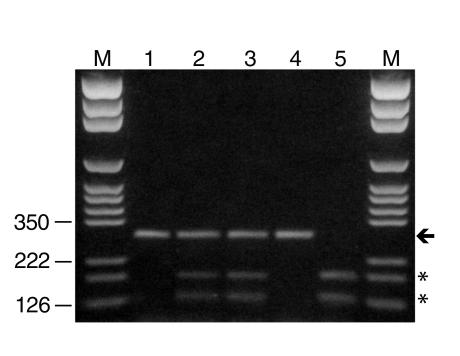
Sequence analysis of DNA fragments (together comprising the complete coding sequence of SCHAD), amplified from genomic DNA of patient FS, revealed a homozygous C→T point mutation in exon 7 of Schad. No other mutations were detected. The mutated nucleotide corresponds to nucleotide (nt) 773 of the coding sequence (taking the A of the translation start codon as nt 1). The C773T point mutation abrogates an ApaI restriction site present in the normal Schad sequence. Amplification of DNA fragments containing nt 773 from patient DNA and from DNA of the parents, followed by ApaI digestion and analysis on an agarose gel, confirmed that FS is homozygous and showed that her parents are heterozygous for the C773T mutation (Figure 3). The mutation could not be detected in DNA from 200 control chromosomes. The C773T mutation leads to replacement of Pro258 (Pro246 of the mature SCHAD protein) by Leu. Pro258 is completely conserved in SCHAD sequences from different species (Figure 4).
Figure 3.
Restriction fragment length analysis of DNA fragments containing nt 773 of the SCHAD coding sequence. DNA from FS, her parents, and controls was amplified using primers for exon 7 (Table 2). The PCR product was analyzed on a 2% agarose gel, either untreated (lane 1) or after exposure to ApaI for 2 hours (lanes 2–5). The C773T mutation abrogates an ApaI restriction site present in the normal sequence. ApaI digestion of the DNA fragment from controls yields two bands of 121 and 171 nt (asterisk). Exposure of the mutated sequence to ApaI yields a single band of 292 nt (arrow). Lane 1, patient DNA fragment (untreated); lane 2, DNA fragment of the father after ApaI treatment; lane 3, DNA fragment of the mother after ApaI treatment; lane 4, DNA fragment of the patient treated with ApaI; lane 5, DNA fragment of a control treated with ApaI. The pattern of the DNA fragments of the parents reveals the presence of both the normal and the mutated sequence.
Figure 4.
Diagram of aligned SCHAD sequences from several evolutionarily distant species. Pro258 (in bold), which is replaced by Leu in the DNA of FS, is completely conserved in the SCHAD coding sequences from different species, including bacteria. Human, NP_005318; Pig, AAD20939; Caenorhabditis elegans, P41938; Clostridium acetobutylicum, AAA95971.
In vitro expression of SCHAD.
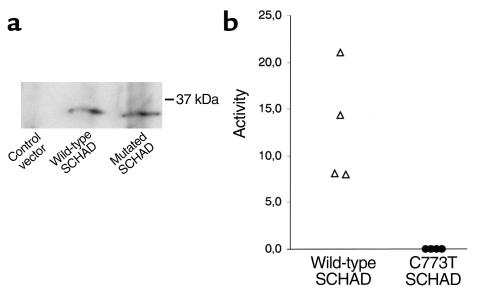
To assess the effect of the P258L substitution on the activity of the protein, the wild-type and the mutated protein were synthesized in vitro from plasmids containing the wild-type SCHAD coding sequence and the SCHAD coding sequence harboring the C773T point mutation, respectively. The absence of amplification artifacts in the wild-type construct and of mutations other than the C773T point mutation in the patient construct was ascertained by sequencing of the SCHAD expression plasmids in two directions. Expression of the wild-type SCHAD protein in a reticulocyte lysate system yielded a protein with an apparent molecular mass of approximately 35 kDa, which is in agreement with the calculated molecular mass of the wild-type protein of 34.3 kDa. The in vitro expressed mutated protein reacted strongly with the anti-SCHAD antibody and had an apparent molecular mass 0.5 kDa less than that of the wild-type protein (Figure 5). Immunoblot analysis showed that comparable amounts of protein were obtained for the wild-type and mutated SCHAD protein, whereas the vector alone did not yield a positive band of similar molecular mass (Figure 5). SCHAD activity was assayed in three separate experiments (Figure 5). The wild-type SCHAD exhibited a distinct but variable activity, whereas the mutated SCHAD did not yield activity above background in all experiments performed, indicating that the P258L substitution abolishes enzyme activity of in vitro expressed SCHAD.
Figure 5.
Expression of wild-type and C773T mutant SCHAD using a reticulocyte lysate system. (a) Western blot showing no protein with vector alone, immunoreactive SCHAD protein with an apparent molecular weight of 35 kDa with the wild-type SCHAD construct, and immunoreactive SCHAD protein with a slightly lower apparent molecular weight with the C773T mutant construct. (b) SCHAD enzyme activity obtained with expression of the wild-type and C773T mutant SCHAD proteins. Enzyme activity is equal to the nanomole substrate converted per microliter of reticulocyte lysate between 10 and 30 minutes’ incubation.
Discussion
FS suffered frequent, severe hypoglycemia. Three hypoglycemia screens indicated definite HI (blood glucose <2.6 mM, plasma insulin >3 mU/l; ref. 20) as did the glucose requirement of 8 mg/kg/min (although many hyperinsulinemic infants require more than 15 mg/kg/min; ref. 18). The episode of hypoglycemia that followed the glucagon test was not attributable to HI but rather suggested impaired fatty acid oxidation. (The pathogenesis of hypoglycemia in FAOD is probably multifactorial. NEFA cannot be used and blood concentrations of ketone bodies are low, so glucose utilization is increased; however, in addition, gluconeogenesis is probably impaired because acetyl-CoA concentrations in the liver are low.) Treatment with diazoxide and chlorothiazide led to a dramatic improvement in glucose homeostasis, providing further evidence that HI was the main cause of hypoglycemia.
The possibility of impaired fatty acid oxidation was investigated by examination of the blood acylcarnitine profile. All samples showed an elevated concentration of a carnitine species with an m/z ratio of 304. This could be due to a hydroxybutyryl-carnitine or isomeric carnitine species. A similar peak has been reported in children with ketosis, so we had to prove that FS had levels of this compound that were higher than those seen in ketosis even when FS had been fed and was not ketotic (Table 3). A number of identities for the “hydroxybutyrylcarnitine” were considered along with theories as to why it might be accumulating. The hypotheses were accumulation of (a) L-3-hydroxybutyrylcarnitine due to SCHAD deficiency; (b) 3-hydroxyisobutyrylcarnitine due to 3-hydroxyisobutyryl-CoA deacylase deficiency; or (c) D-3-hydroxybutyrylcarnitine due to a ketone body utilization defect (KBUD). The SCHAD hypothesis was consistent with a NEFA/D-3-hydroxybutyrate ratio toward the upper limit of normal. The deacylase hypothesis seemed unlikely upon comparison of FS with the case described previously (25). Plasma concentrations of D-3-hydroxybutyrate did not suggest a KBUD.
Rather than prove that the compound in the blood was L-3-hydroxybutyrylcarnitine and that the urine contained excess L-3-hydroxybutyrate (which is indistinguishable from D-3-hydroxybutyrate on simple organic acid analysis), it was decided to move directly to an assay of SCHAD. SCHAD is expressed in many tissues (26) and has previously been assayed in fibroblasts. Clear evidence of reduced SCHAD activity was seen in fibroblasts from FS. There was no impairment in hydrogenation of 3-ketooctanoyl-CoA, a medium-chain substrate, in keeping with our organic acid and acylcarnitine analyses but at variance with the evidence of impairment in medium-chain 3-hydroxyacyl-CoA dehydrogenase activity in an SCHAD-knockout mouse and in another SCHAD-deficient patient (10, 11).
There was high residual SCHAD activity in the patient’s fibroblasts, which was surprising, as Western blots indicated that the fibroblasts contained no immunoreactive protein. There was no fall in residual enzyme activity in the patient’s fibroblasts after immunoprecipitation of residual SCHAD protein. The residual activity could be due to several enzymes: (a) Trifunctional protein HAD activity. This is unlikely because this enzyme has low activity toward acetoacetyl-CoA (27) and residual SCHAD activity was detectable after immunoprecipitation of SCHAD protein from an LCHAD-deficient cell-line. (b) Peroxisomal L- and D-3-hydroxyacyl-CoA dehydrogenases (28). (c) Presence of type II 3-hydroxyacyl-CoA dehydrogenase (29) or human brain multifunctional dehydrogenase (30) in fibroblasts. (d) Short-chain 2-methy -hydroxyacyl-CoA dehydrogenase (31). Using 2-methylacetoacetyl-CoA as substrate, activity of this enzyme was low (0.32 mU/mg protein in control fibroblasts, 0.42 mU/mg in FS). Because it is only half as active toward straight chain as toward 2-methylacyl-CoA esters (31), it is unlikely, however, that this enzyme was responsible for the residual activity.
Given that the residual activity was substantially reduced when a mitochondrial preparation was used, it seems likely that it was due to peroxisomal enzyme(s).
Sequencing of the Schad gene from fibroblasts showed that FS is homozygous for a C773T mutation that leads to a change from proline to leucine at amino acid 258 (246 in the mature protein after cleavage of the mitochondrial targeting sequence); the parents are heterozygotes. Several lines of evidence indicate that C773T is responsible for the reduction in SCHAD activity and is a disease-causing mutation: (a) No other difference from the wild-type sequence was detected in the any of the eight exons of Schad from FS. (b) The C773T mutation was not found in 200 control chromosomes, including 100 from individuals with the same ethnic background, indicating that the mutation is not a common polymorphism. (c) As shown in Figure 4, Pro258 is part of a highly conserved amino acid region, and the equivalent of Pro258 is present in SCHAD of all species investigated. (d) Analysis of the crystal structure of SCHAD reveals that Pro258 is the starting point of one of the α-helices (α12) of the C-terminal domain (32). Barycki et al. argue that the orientation of these α-helices relative to one another is critical for enzyme function. Replacement of the proline at the starting point of an α-helix by leucine is likely to prevent normal protein folding. This could lead to rejection by the chaperonin system (leading to destruction of the nascent protein) or to synthesis of a protein with reduced catalytic activity.
The Western blots indicated reduced immunoreactive SCHAD protein in fibroblasts. This suggests that the P258L substitution alters the tertiary structure of the nascent enzyme to such a degree that it is not recognized by chaperonins and is destroyed. This phenomenon has been described for point mutations in short-chain acyl-CoA dehydrogenase (33).
Additional evidence that the C773T mutation in the SCHAD coding sequence is responsible for the patient’s disease is provided by the functional assay after in vitro expression of the mutated protein. We included 81 nucleotides of the 5′UTR, in addition to the complete coding sequence, as a template for the expression of the SCHAD protein, to ensure protein formation starting from the translation start site. It has been shown that absence of the sequences upstream of the translation start codon may lead to aberrant choice of translation start sites by the in vitro expression system (34). The SCHAD protein expressed from the wild-type construct had an apparent molecular mass of the expected size. The mutated sequence yielded a comparable amount of protein with a slightly lower apparent molecular mass as determined by SDS-PAGE. This is probably due to the P258L substitution The protein folding introduced by proline in the wild-type sequence cannot be undone by denaturing the protein, so the wild-type protein may exhibit a different migration pattern in a denaturing gel than the mutant protein. The complete absence of SCHAD activity of the in vitro synthesized protein harboring the P258L substitution further corroborates the link between the mutation and the patient’s disease.
The acylcarnitine profile in blood from FS was unique with regard to the presence of more than 0.6 μM of hydroxybutyrylcarnitine. However, it was also abnormal to the extent that the acetylcarnitine concentration was usually above the normal range. Comparison with other hyperinsulinemic children suggested that elevation of blood spot acetylcarnitine is caused by HI rather than being a specific effect of SCHAD deficiency. How could HI lead to an elevated concentration of acetylcarnitine in blood? Insulin leads to increased production of acetyl-CoA from glucose in muscle and it is likely that when acetyl-CoA is being produced by pyruvate dehydrogenase at a rate that exceeds its removal in the Krebs cycle, it is buffered by conversion to acetylcarnitine.
The hypoglycemia observed in FS was not typical of a FAOD; it was not easily provoked by a prolonged fast, but, rather, occurred in an unpredictable fashion, often 2–6 hours after a feed. On some occasions the plasma insulin level was elevated, but on others, it was normal and the NEFA/D-3-hydroxybutyrate ratio was at the upper limit of normal (a supranormal value is typical of hypoglycemia due to a FAOD). Although it is conceivable that FS has two separate genetic defects, one in the Schad gene and another causing HI, we believe it more likely that the absence of SCHAD activity in the β cell causes inappropriate insulin secretion; SCHAD is abundant in the β cell (3, 4) because it fulfills an important regulatory function.
The postulated role of lipid signaling in insulin secretion is shown in Figure 6 (right); the pathway that triggers secretion via the increased ATP/ADP ratio is shown on the left (14). Fatty acids are a major energy source for unstimulated islets. An early change caused by glucose is a shift from fatty acids to glucose as fuel. It is proposed that this occurs through conversion of glucose to malonyl-CoA, which inhibits carnitine palmitoyl transferase I (CPT I) and blocks the entry of long chain fatty acyl CoA (LCFA-CoA) into the mitochondrion. Thus LCFA-CoA is converted instead into diacylglycerol, triglycerides, fatty acids, and acylated proteins. LCFA-CoA or the complex lipids derived from them are potent regulators of enzymes, ion channels, and signal-transducing effectors. It is proposed that the complex lipids or acylated proteins augment insulin secretion by a KATP-independent mechanism. Unequivocal evidence for such a lipid-linked signaling mechanism is lacking, but there is experimental evidence for a KATP-independent mechanism that augments insulin secretion in response to glucose (13–15).
Figure 6.
The two postulated pathways for β cell signaling (from ref. 14). PDH, pyruvate dehydrogenase; PC, pyruvate carboxylase; CL, citrate lyase; CPT1, carnitine palmitoyl transferase 1; m, mitochondrial; c, cytosolic; AcCoa, acetyl-CoA; LCFA-CoA, long-chain fatty acyl-CoA.
What effects would FAOD in general, and SCHAD deficiency in particular, have on the lipid signaling pathway? Any defect leading to accumulation of cytosolic LCFA-CoA and increased esterification could induce inappropriate insulin secretion. Accumulation of triglyceride, particularly in liver, occurs in LCHAD deficiency, in very long chain acyl-CoA dehydrogenase (VLCAD) deficiency, and in medium chain acyl-CoA dehydrogenase (MCAD) deficiency during fasting-induced decompensation (35). However, our data do not suggest that these FAOD produce HI (Table 1). It is possible that in SCHAD deficiency, accumulation of short chain acyl-CoA esters in the mitochondrion causes insulin secretion by inhibition of CPT I. The isoform of CPT I in the β cell is the same as that in the liver (36). This enzyme, located in the outer mitochondrial membrane, has one inhibition site that faces the cytosol and is inhibited by dicarboxylic CoA esters (physiologically by malonyl-CoA) and a second inhibition site, facing the intermembrane space, that is inhibited by short chain mono-carboxylic CoA esters (37). What would be the role of inhibition of CPT I by L-3-hydroxybutyryl-CoA? We hypothesize that it is the cell’s ketone body–sensing mechanism. High levels of D-3-hydroxybutyrate and acetoacetate in the blood will lead to a rise in intramitochondrial acetoacetyl-CoA via the ketone body utilization pathway. In a cell containing abundant SCHAD, operation of the enzyme in the “reverse” direction would lead to accumulation of L-3-hydroxybutyryl-CoA. Inhibition of CPT I by L-3-hydroxybutyryl-CoA would inhibit fatty acid oxidation and, in the β cell, lead to insulin secretion. In muscle, acetoacetate and 3-hydroxybutyrate inhibit fatty acid oxidation by a mechanism independent of malonyl-CoA (38).
Our patient’s hypoglycemia responded to diazoxide, which inhibits insulin secretion by keeping KATP channels open. This does not disprove the hypothesis that HI in SCHAD deficiency is due to stimulation of the lipid-signaling pathway; the Prentki model suggests that large amounts of insulin are only secreted if both the KATP channel and the lipid-signaling pathway are activated.
There are significant differences between FS and previous putative cases of SCHAD deficiency. In contrast to the child reported by Tein et al. (6), FS had no evidence of skeletal or cardiac myopathy and SCHAD activity was low in her fibroblasts. The cases reported by Bennett et al. in 1996 (7) had a vigorous ketone response to hypoglycemia and medium- and long-chain 3-hydroxydicarboxylic acids in the urine. Neither of these features was present in FS. It is possible that some patients previously reported as SCHAD deficient (6–8) were in fact deficient in other enzymes with SCHAD activity. However, the recently reported patient with G118A and C171A mutations in the Schad gene, presented with fulminant liver failure at 3 years (10); HI was not reported. This raises the possibility of phenotypic variation in SCHAD deficiency. The SCHAD-knockout mouse dies when subjected to a 10-hour fast (11); our observations suggest that this could be due to hyperinsulinemic hypoglycemia.
We have checked acylcarnitine profiles in other children with HI and found no further cases with a raised hydroxybutyrylcarnitine, suggesting that SCHAD deficiency is a rare cause of HI. However, cases such as this provide important insight into normal biochemistry and physiology. In this case, the biochemistry of the β cell and the physiology of insulin secretion.
In summary, we describe here a new syndrome of hyperinsulinism and SCHAD deficiency that should be easily recognizable by analysis of acylcarnitine species and that responds well to treatment with diazoxide. It provides, to our knowledge, the first “experiment of nature” that links impaired fatty acid oxidation to HI and that provides support for the concept that a lipid signaling pathway (14) is implicated in the control of insulin secretion. It raises the possibility that HI might contribute to hypoglycemia in other FAODs.
Acknowledgments
Part of this work was undertaken by Great Ormond Street Hospital NHS Trust, which received a proportion of its funding from the NHS Executive; the views expressed in this article are not necessarily those of the NHS Executive. We are grateful to D.M. Turnbull (Newcastle-upon-Tyne) for the anti-SCHAD antibody. P.T. Clayton was supported by the Wellcome Trust and S. Eaton by a British Heart Foundation Fellowship.
References
- 1.Vredendaal PJ, et al. Human short-chain L-3-hydroxyacyl-CoA dehydrogenase: cloning and characterization of the coding sequence. Biochem Biophys Res Commun. 1996;223:718–723. doi: 10.1006/bbrc.1996.0961. [DOI] [PubMed] [Google Scholar]
- 2.Vredendaal PJ, et al. Structural organization of the human short-chain L-3-hydroxyacyl-CoA dehydrogenase gene. Mamm Genome. 1998;9:763–768. doi: 10.1007/s003359900860. [DOI] [PubMed] [Google Scholar]
- 3.Hammar H, Berne C. The activity of β-hydroxyacyl-CoA dehydrogenase in the pancreatic islets of hyperglycaemic mice. Diabetologia. 1970;.6:526–528. doi: 10.1007/BF01211896. [DOI] [PubMed] [Google Scholar]
- 4.Ågren A, Borg K, Brolin SE, Carlman J, Lundqvist G. Hydroxyacyl CoA dehydrogenase, an enzyme important in fat metabolism in different cell types in the Islets of Langerhans. Diabete Metab. 1977;3:169–172. [PubMed] [Google Scholar]
- 5.Eaton S, Bartlett K, Pourfarzam M. Mammalian mitochondrial beta-oxidation. Biochem J. 1996;320:345–357. doi: 10.1042/bj3200345. [DOI] [PMC free article] [PubMed] [Google Scholar]
- 6.Tein I, et al. Short-chain L-3-hydroxyacyl-CoA dehydrogenase deficiency in muscle: a new cause for recurrent myoglobinuria and encephalopathy. Ann Neurol. 1991;30:415–419. doi: 10.1002/ana.410300315. [DOI] [PubMed] [Google Scholar]
- 7.Bennett MJ, Weinberger MJ, Kobori JA, Rinaldo P, Burlina AB. Mitochondrial short-chain L-3-hydroxyacyl-coenzyme A dehydrogenase deficiency: a new defect of fatty acid oxidation. Pediatr Res. 1996;39:185–188. doi: 10.1203/00006450-199601000-00031. [DOI] [PubMed] [Google Scholar]
- 8.Bennett MJ, et al. Fatal short-chain L-3-hydroxyacyl-coenzyme A dehydrogenase deficiency: clinical biochemical and pathological studies on three subjects with this recently identified disorder of mitochondrial β-oxidation. Pediatric and Developmental Pathology. 1999;2:337–345. doi: 10.1007/s100249900132. [DOI] [PubMed] [Google Scholar]
- 9.Rinaldo P. Mitochondrial fatty acid oxidation disorders and cyclic vomiting syndrome. Dig Dis Sci. 1999;44:S97–S102. [PubMed] [Google Scholar]
- 10.O’Brien LK, et al. Fulminant hepatic failure associated with mutations in the medium and short chain L-3-hydroxyacyl-CoA dehydrogenase gene. J Inherit Metab Dis. 2000;23(Suppl. 1):127. (Abstr.) [Google Scholar]
- 11.O’Brien LK, Sims HF, Bennett MJ, Strauss AW. A mouse model for medium and short chain chain L-3-hydroxyacyl-CoA dehydrogenase deficiency. J Inherit Metab Dis. 2000;23(Suppl. 1):127. (Abstr.) [Google Scholar]
- 12.Glaser B, Thornton P, Otonkoski T, Junien C. Genetics of neonatal hyperinsulinism. Arch Dis Child Fetal Neonatal Ed. 2000;82:F79–F86. doi: 10.1136/fn.82.2.F79. [DOI] [PMC free article] [PubMed] [Google Scholar]
- 13.Shepherd RM, et al. Hyperinsulinism of infancy: towards an understanding of unregulated insulin release. European Network for Research into Hyperinsulinism in Infancy. Arch Dis Child Fetal Neonatal Ed. 2000;82:F87–F97. doi: 10.1136/fn.82.2.F87. [DOI] [PMC free article] [PubMed] [Google Scholar]
- 14.Prentki M. New insights into pancreatic β-cell metabolic signaling in insulin secretion. Eur J Endocrinol. 1996;134:272–286. doi: 10.1530/eje.0.1340272. [DOI] [PubMed] [Google Scholar]
- 15.Prentki M, Corkey BE. Are the beta-cell signaling molecules malonyl-CoA and cystolic long-chain acyl-CoA implicated in multiple tissue defects of obesity and NIDDM? Diabetes. 1996;45:273–283. doi: 10.2337/diab.45.3.273. [DOI] [PubMed] [Google Scholar]
- 16.Aizawa T, Komatsu M, Asanuma N, Sato Y, Sharp GW. Glucose action ‘beyond ionic events’ in the pancreatic beta cell. Trends Pharmacol Sci. 1998;19:496–499. doi: 10.1016/s0165-6147(98)01273-5. [DOI] [PubMed] [Google Scholar]
- 17.Morris AAM, et al. Evaluation of fasts for investigating hypoglycemia or suspected metabolic disease. Arch Dis Child. 1996;75:115–119. doi: 10.1136/adc.75.2.115. [DOI] [PMC free article] [PubMed] [Google Scholar]
- 18.Aynsley-Green A, et al. Practical management of hyperinsulinism in infancy. Arch Dis Child Fetal Neonatal Ed. 2000;82:F98–F107. doi: 10.1136/fn.82.2.F98. [DOI] [PMC free article] [PubMed] [Google Scholar]
- 19.Hughes, I.A. 1986. Handbook of endocrine tests in children. John Wright. Bristol, UK. 138–139.
- 20.Jackson S, et al. Long-chain 3-hydroxyacyl-CoA dehydrogenase deficiency. Pediatr Res. 1991;29:406–411. doi: 10.1203/00006450-199104000-00016. [DOI] [PubMed] [Google Scholar]
- 21.Thorpe C. A method for the preparation of 3-ketoacyl-CoA derivatives. Anal Biochem. 1986;155:391–394. doi: 10.1016/0003-2697(86)90452-5. [DOI] [PubMed] [Google Scholar]
- 22.Shepherd D, Garland PB. Citrate synthase from rat liver. Methods Enzymol. 1969;13:11–16. doi: 10.1042/bj1140597. [DOI] [PMC free article] [PubMed] [Google Scholar]
- 23.Peterson GL. A simplification of the protein assay of Lowry et al. which is more generally applicable. Anal Biochem. 1977;83:346–356. doi: 10.1016/0003-2697(77)90043-4. [DOI] [PubMed] [Google Scholar]
- 24.Hoogeboom, G. 1962. Methods in enzymology. Volume 1. S.P. Colowick and N.O. Kaplan, editors. Academic Press. New York, New York, USA. 16–19.
- 25.Brown GK, et al. Beta-hydroxyisobutyryl coenzyme A deacylase deficiency: a defect in valine metabolism associated with physical malformations. Pediatrics. 1982;70:532–538. [PubMed] [Google Scholar]
- 26.Xue-Ying H. Identity of heart and liver L-3-hydroxyacyl coenzyme A dehydrogenase. Biochim Biophys Acta. 1999;1437:119–123. doi: 10.1016/s1388-1981(98)00005-5. [DOI] [PubMed] [Google Scholar]
- 27.Carpenter K, Pollitt RJ, Middleton B. Human liver long-chain 3-hydroxyacyl-CoA dehydrogenase is a multifunctional membrane bound beta-oxidation enzyme of mitochondria. Biochem Biophys Res Commun. 1992;183:443–448. doi: 10.1016/0006-291x(92)90501-b. [DOI] [PubMed] [Google Scholar]
- 28.Wanders RJA, van Grunsven EG, Jansen GA. Lipid metabolism in peroxisomes: enzymology, functions and dysfunctions of the fatty acid α- and β-oxidation systems in humans. Biochem Soc Trans. 2000;28:141–149. doi: 10.1042/bst0280141. [DOI] [PubMed] [Google Scholar]
- 29.Kobayashi A, Jiang LL, Hashimoto T. Two mitochondrial 3-hydroxyacyl-CoA dehydrogenases in bovine liver. J Biochem (Tokyo) 1996;119:775–782. doi: 10.1093/oxfordjournals.jbchem.a021307. [DOI] [PubMed] [Google Scholar]
- 30.He XY, Schulz H, Yang SY. A human brain l-3-hydroxyacyl coenzyme a dehydrogenase is identical to an amyloid β-peptide-binding protein involved in Alzheimer’s disease. J Biol Chem. 1998;273:10741–10746. doi: 10.1074/jbc.273.17.10741. [DOI] [PubMed] [Google Scholar]
- 31.Luo MJ, Mao LF, Schulz H. Short-chain 3-hydroxy-2-methylacyl-CoA dehydrogenase from rat-liver: purification and characterization of a novel enzyme of isoleucine metabolism. Arch Biochem Biophys. 1995;321:214–220. doi: 10.1006/abbi.1995.1388. [DOI] [PubMed] [Google Scholar]
- 32.Barycki JJ, et al. Biochemical characterization and crystal structure determination of human heart short chain L-3-hydroxyacyl-CoA dehydrogenase provide insights into catalytic mechanism. Biochemistry. 1999;38:5786–5798. doi: 10.1021/bi9829027. [DOI] [PubMed] [Google Scholar]
- 33.Corydon TJ, et al. Rapid degradation of short-chain acyl-CoA dehydrogenase variants with temperature-sensitive folding defects occurs after import into mitochondria. J Biol Chem. 1998;273:13065–13071. doi: 10.1074/jbc.273.21.13065. [DOI] [PubMed] [Google Scholar]
- 34.Saijo T, Tanaka K. Isoalloxazine ring of FAD is required for the formation of the core in the Hsp60-associated folding of medium chain acyl-CoA dehydrogenase subunit into the assembly competent conformation in mitochondria. J Biol Chem. 1995;270:1899–1907. doi: 10.1074/jbc.270.4.1899. [DOI] [PubMed] [Google Scholar]
- 35.Roe, C.R., and Coates, P.M. 1995. Mitochondrial fatty acid oxidation disorders. In The metabolic and molecular bases of inherited disease. 7th edition. C.R. Scriver, A.L. Beaudet, W.S. Sly, and D. Valle, editors. McGraw-Hill. New York, New York, USA. 1501–1534.
- 36.Zammit VA. The malonyl-CoA-long-chain acyl-CoA axis in the maintenance of mammalian cell function. Biochem J. 1999;343:505–515. [PMC free article] [PubMed] [Google Scholar]
- 37.Kashfi K, Mynatt RL, Cook GA. Hepatic carnitine palmitoyltransferase-I has two independent inhibitory binding sites for regulation of fatty acid oxidation. Biochim Biophys Acta. 1994;1212:245–252. doi: 10.1016/0005-2760(94)90259-3. [DOI] [PubMed] [Google Scholar]
- 38.Ruderman NB, Saha AK, Vavvas D, Witters LA. Malonyl-CoA, fuel sensing and insulin resistance. Am J Physiol Endocrinol Metab. 1999;276:E1–E18. doi: 10.1152/ajpendo.1999.276.1.E1. [DOI] [PubMed] [Google Scholar]


