Abstract
Failure of CD4+ T cells to proliferate in response to antigenic stimulation is a characteristic of HIV infection. Analysis of the proliferation defect has been hampered by an inability to identify CD4+ cells with T cell receptor specificity for antigen. To focus only on cells that had been stimulated through the T cell receptor, CD4+ T cells were stimulated with an anti-Vβ3 Ab that activates approximately 3–5% of peripheral blood T cells. This approach revealed proliferation defects in cells from HIV-infected patients that were not appreciated using anti-CD3 Ab stimulation and provided the capacity to examine responses on a single cell basis. After anti-Vβ3 Ab stimulation, CD4+Vβ3+ cells from HIV-infected patients demonstrated defects in expression of cell cycle–associated proteins, D-type cyclins, and cyclin A. However, the expression of early activation markers, CD69 and CD25, was not significantly impaired in cells from most patients. Thus, CD4+ T cell proliferation failure in HIV disease is characterized by dysregulated activation that precludes cell cycle progression. This proliferation defect was most apparent in patients with diminished CD4+ T cell numbers and higher plasma HIV RNA levels. CD4+ T cell proliferation failure may be a key determinant of immune impairment in HIV disease.
Introduction
CD4+ T cells from HIV-infected patients tend to proliferate poorly following T cell receptor stimulation (1–4). The proliferation defect may preclude sufficient immune responsiveness to HIV or to other pathogens due to limited expansion of antigen-reactive cells. The association between T cell proliferation function and HIV immunity is suggested by correlations between CD4+ T cell proliferation responses to HIV antigens and control of viral replication (5), as well as prolonged duration of cytotoxic T cell function (6). It is important, therefore, to uncover mechanisms that underlie the CD4+ T cell proliferation defects in HIV disease.
Although the inability of patient cells to proliferate has been associated with decreased production of IL-2 (1, 7) and enhanced susceptibility to apoptosis (8, 9), it is not clear how these phenomena are related nor are the molecular alterations that could account for the functional changes understood. The defects may be the consequence of very early stimulation events that fail to induce the appropriate signals needed for cellular activation. Following stimulation with recall antigen, subnormal expression of CD69, an early activation marker, has been described in cells from HIV-infected patients (10). Poor expression of CD69 following stimulation with antigen might be reflective of insufficient activation signals or could result from a depletion of T cells that have the appropriate specificity for the recall antigen. In contrast to antigen-specific responses, mitogen responses do not rely on a specific antigen-reactive subpopulation of memory cells. Stimulation with mitogen has also been reported to result in partial defects of CD69 expression in cells from HIV-infected patients (10–12), and this has been correlated with proliferation failure (11, 12). This suggests that early signaling events may be defective in cells from HIV-infected subjects and, consequently, lead to proliferation failure. An alternative hypothesis is that cells from HIV-infected subjects can generate early response signals but fail to divide in subsequent steps of T cell activation. This is supported by studies demonstrating good IFN-γ responses to recall antigens by lymphocytes of HIV-infected patients in circumstances where proliferation responses are predicted to be poor (13). Thus, the cells may receive signals that allow for cytokine secretion but not the signals required for division. Furthermore, it is possible that cells from HIV-infected patients may actually enter into the cell cycle but fail to complete division. We have described such a circumstance in cells from HIV-infected subjects that spontaneously enter S phase of the cell cycle upon culture, but instead of completing mitosis, these cells tend to undergo apoptosis (14).
Testing these hypotheses has been difficult experimentally. Methods to characterize T cell proliferation defects in HIV disease have generally relied on stimulation with either recall antigen or mitogen. Both of these approaches have limitations. In the case of recall-antigen stimulation, interpretation of proliferation responses is limited by the potential for precursor memory cell depletion in HIV-infected patients. Thus, it is difficult to discern between qualitative and quantitative changes in potential responder cell populations. Moreover, methods for definitive identification of cells with appropriate T cell receptors for MHC class II restricted peptide–specific responses are not widely available. For mitogen stimulation, responses may be influenced by the nonphysiological nature of the stimuli. This could occur as the result of activating all T cells, and sometimes non-T cells, in a given culture, making nonspecific and bystander effects quite prominent. The consequences of stimulating the majority of T cells in a given culture may in part explain observations that describe normal responses to mitogen but poor responses to antigen in cells from HIV-infected patients (1).
We have established a stimulation protocol that permits identification of a specific precursor population on a single cell basis yet minimizes nonphysiological effects invoked by stimulating all T cells in a given cell culture. This is accomplished by stimulating a subpopulation of T cells via the Vβ3 T cell receptor chain. Roughly 3–5% of peripheral T cells are able to bind to anti-Vβ3 agonistic Ab, thereby making bystander and nonspecific activation less of a factor. Using anti-Vβ3 Ab stimulation, we observe that CD4+ T cells from HIV-infected subjects do not progress through the cell cycle despite showing early signs of activation.
Methods
Cells.
PBMCs were isolated from blood samples by centrifugation over a Ficoll-Histopaque cushion. Samples were acquired from healthy volunteers and HIV-infected patients. Patients with CD4 cell counts above 50 cells per microliter were used so that enough cells could be recovered to perform the experiments. No other criteria were used to exclude participants. In some experiments, PBMCs were depleted of CD8+ cells by magnetic bead separation (Miltenyi Biotec, Bergisch Gladbach, Germany). Briefly, PBMCs were incubated with PBS/EDTA/BSA staining buffer along with anti-CD8–coated beads for 15 minutes at 4°C. Cells were washed once and passed over magnetic separation columns (Miltenyi Biotec). Cells were subsequently washed in culture medium (RPMI-1640; BioWhittaker Inc., Walkersville, Maryland, USA) before use in proliferation assays. Resulting lymphocyte populations always consisted of fewer than 9% CD8+ cells and more typically consisted of fewer than 3% CD8+ cells following depletion as determined by flow cytometric analysis.
Proliferation assays.
PBMCs or CD8-depleted PBMCs were labeled in Diluent C (Sigma Chemical Co., St. Louis, Missouri, USA) supplemented with PKH26 red fluorescent dye (Sigma Chemical Co.) for 5 minutes at room temperature. The PKH26-labeling process was then stopped by adding FBS. After labeling, cells were washed at least three times before resuspension in RPMI-1640 medium supplemented with 10% heat-inactivated FBS, 2 mM glutamine, and 100 U/ml of penicillin/streptomycin. Cells were plated at concentrations of 1 to 1.5 × 10⁶ cells/ml in 24-well culture plates and either stimulated with anti-CD3 Ab (250 ng/ml; PharMingen San Diego, California, USA), anti-Vβ3 Ab (100 ng/ml; PharMingen), or tetanus toxoid (TT) (1 LFU/ml; Wyerst Ayerst, Marietta, Pennsylvania, USA). Cells were examined 4–8 days later by two-color flow cytometry for cell surface molecules and tracking dye levels. For some experiments, anti-human Vβ3PE Ab’s (PharMingen) were used for stimulation of PBMCs.
For measuring bromodeoxyuridine (BrdU) incorporation into DNA, PBMCs were stimulated with anti-Vβ3PE Ab and pulsed for 18 hours with BrdU (10 μM; PharMingen).
Flow cytometry.
For cell surface staining, 0.5 × 10⁶ cells were incubated with Ab’s at 4°C for 30 minutes followed by washing with staining buffer (PBS/BSA/azide). For two-color analyses to detect tracking dye and Vβ3+ cells, FITC-conjugated mouse IgM Ab (Beckman-Coulter Inc., Fullerton, California, USA) was incubated with cells, followed by a wash and a second incubation with anti-mouse FITC Ab (PharMingen). Control staining was performed with nonspecific IgM FITC (Coulter-Immunotech). Staining for CD4+ cells was performed with FITC-conjugated mouse anti-human CD4 Ab (PharMingen), and staining for CD25 was done with mouse anti-human CD25 FITC (PharMingen). Three-color surface staining was also done to assess CD25 and CD69 expression in CD4+Vβ3+ cells. Cells were stained for CD4 with anti-CD4 peridinin chlorophyll protein–conjugated Ab (Becton Dickinson Biosciences, San Jose, California, USA), anti-CD69 FITC PharMingen) or anti-CD25 FITC (PharMingen), and anti-Vβ3PE. Nonspecific isotype-matched Ab’s (PharMingen) were used as controls.
To assess cyclin expression, cells were preincubated in 500 μl FACS permeabilizing solution (Becton Dickinson Biosciences) for 5 minutes at room temperature and then 10 minutes on ice. Cells were washed with PBS and resuspended directly with mAb’s that were directed against D-type cyclins (D1, D2, and D3), or cyclin A (PharMingen) or isotype controls (PharMingen). Anti-CD4 and anti-Vβ3PE Ab were also added for a 30-minute incubation at room temperature. For assessment of BrdU incorporation cells were first surface stained for CD4 and Vβ3 and then processed for intracellular BrdU staining as outlined in the BrdU flow kit instructions (PharMingen).
Results
Impaired proliferation responses of cells from HIV-infected patients revealed by anti-Vβ3 Ab stimulation.
In contrast to anti-CD3 Ab, which can potentially activate all T cells in a given culture, anti-Vβ3 Ab provides an activation stimulus that is specific for 3–5% of the total peripheral blood T cell population. Because of the limited proportion of T cells that can be activated, anti-Vβ3 Ab stimulation may induce fewer bystander activation effects and, consequently, may better resemble a physiological stimulus than anti-CD3 Ab stimulation. Therefore, we speculated that anti-Vβ3 Ab stimulation might provide a more useful approach for detecting CD4+ T cell dysfunction in HIV disease.
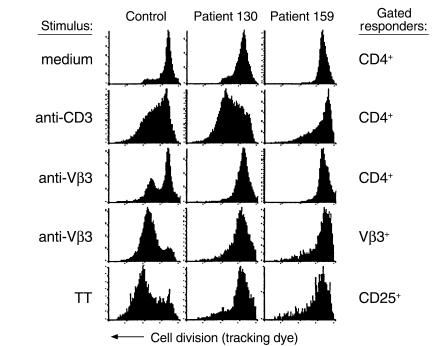
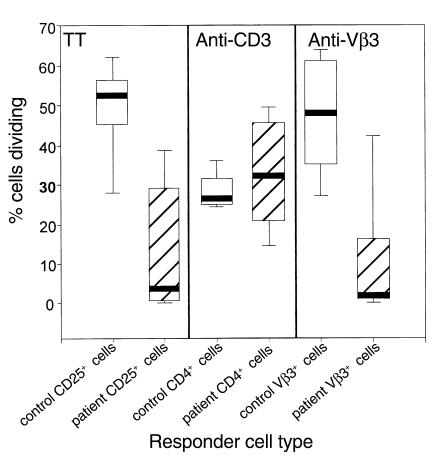
To address this possibility, comparisons were made between the magnitude of T cell proliferation responses in PBMCs from healthy donors and HIV-infected subjects following stimulation with anti-CD3 Ab, anti-Vβ3 Ab, or TT recall antigen. A fluorescent tracking dye that incorporates into the cell membrane and is evenly distributed between daughter cells following mitosis was used to assess cell division in specific T cell populations that were identified by two-color flow cytometry. A representative experiment involving cells from a healthy control and two HIV-infected subjects is shown in Figure 1. Following activation with anti-CD3 Ab, CD4+ cells from patient 130 had an excellent response to stimulation that exceeded the control response, whereas CD4+ cells from patient 159 displayed a partial defect (Figure 1). In contrast, stimulation with anti-Vβ3 Ab resulted in marked proliferation defects in cells from both patients in the CD4+ and Vβ3+ cell populations. Likewise, CD25+ cells from both patients showed defects in proliferation following stimulation with TT (Figure 1). Proliferation of CD25+ cells was examined in TT-stimulated cultures because preliminary experiments showed that after stimulation with TT, proliferating cells were markedly enriched by gating on CD25+ cells in contrast to gating on CD4+ cells. These results suggest that stimulation with anti-Vβ3 Ab may provide a more sensitive method for detecting functional defects in CD4+ T cells from HIV-infected patients than stimulation with anti-CD3 Ab. A summary of the responses of additional patients and controls supports this suggestion (Figure 2).
Figure 1.
Comparison of anti-CD3, anti-Vβ3, and TT responses in cells from HIV-infected patients and a healthy control. PBMCs from two HIV-infected patients and a healthy donor were labeled with PKH tracking dye and stimulated with either anti-CD3 Ab, anti-Vβ3 Ab, or TT. Other cells were left in medium alone. After 8 days, the cells were stained with Ab’s specific for CD4, Vβ3, or CD25. Cells that stained positive for cell surface markers were selected by gating, and frequency distribution histograms were generated for PKH dye fluorescence. Movement from right to left on the above histograms is evidence for cell division. The stimulus is shown to the left of the histograms, and the cells that were gated on for analysis are shown to the right of the histograms.
Figure 2.
Cumulative data showing differences between the responses to stimuli in patient cells verses control cells. PBMCs from HIV-infected patients (n = 10 for TT and n = 11 for anti-Vβ3 responses; open boxes) and healthy donors (n = 5; hatched boxes) were stimulated with TT, anti-CD3 Ab, anti-Vβ3 Ab, or left in medium alone. After 8 days, the percentages of dividing CD25+ cells, CD4+ cells, and Vβ3+ cells were determined for PBMCs stimulated with TT, anti-CD3 Ab, and anti-Vβ3 Ab, respectively. Respective spontaneous proliferation in unstimulated cultures was subtracted from the values in stimulated cultures to obtain the values shown. The differences in TT response and the anti-Vβ3 responses between patients and controls reached statistical significance (P < 0.05 in each case; Student’s t test).
The proportion of stimulated T cells influences proliferation potential.
There are several possible explanations for the more efficient responses of patient T cells to anti-CD3 Ab compared with anti-Vβ3 Ab. Qualitative differences in binding and activation by the Ab’s do not appear to explain this difference, since the anti-Vβ3 Ab induced proliferation on a per cell basis more efficiently than the anti-CD3 Ab even in controls (Figure 1). In addition, both Ab’s were used at concentrations that resulted in the complete blocking of the respective anti-Vβ3 or anti-CD3 Ab staining 1 day after culture (not shown). We therefore speculated that the primary difference between anti-CD3 stimulation and anti-Vβ3 stimulation was related to the absolute numbers of cells engaged by the respective Ab’s. One prediction from this hypothesis is that anti-CD3 Ab stimulation might better reveal proliferation defects in cells from HIV-infected patients if the responder population is diluted with unstimulated cells.
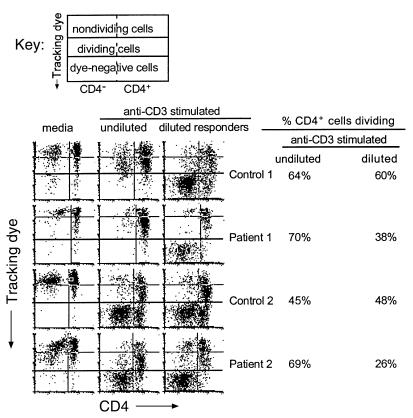
To test this hypothesis, PBMCs or CD8-depleted PBMCs were labeled with tracking dye, stimulated with anti-CD3 Ab for 1 hour, and mixed with unstimulated and unlabeled PBMCs. The labeled cells constituted 5–10% of the final cell population. Cell division was examined by flow cytometry 4 days after stimulation. Stimulated cells from healthy donors proliferated equally well with or without dilution, whereas stimulated cells from HIV-infected patients showed a marked reduction in the ability to divide following dilution with unstimulated cells (Figure 3). These observations indicate that the proportion of T cells activated in a given culture markedly influences the response of cells from HIV-infected subjects and that activation of fewer cells provides a better model for discerning proliferation defects.
Figure 3.
Dilution of responder cells results in proliferation defects in cells from HIV-infected patients. CD8-depleted PBMCs were labeled with tracking dye and stimulated with anti-CD3 Ab for 1 hour followed by several washes. Cells were plated with unlabeled cells that had not been stimulated such that the proportion of stimulated cells to unstimulated cells was approximately 1:9 (right column). Stimulated cells were plated alone (top experiment) or with unlabeled cells that had been stimulated with anti-CD3 Ab (bottom experiment) for comparison (middle column). Unstimulated cells were used to establish background proliferation (left column). After 4 days, the cells were examined for proliferation by staining with anti-CD4 FITC Ab and simultaneously evaluating tracking dye expression. Each histogram is divided into six sections. The right and left top sections represent cells that had not divided. The middle right and left sections represent cells that had divided, and the bottom right and left sections represent the autofluorescence of cells that had not been labeled with tracking dye. Values shown to the right of the plots represent the percentages of the CD4+ cells that had divided by day 4 for the anti-CD3–stimulated cells and the anti-CD3–stimulated, diluted cells.
Cell cycle progression of anti-Vβ3 Ab-stimulated cells is arrested before D-type cyclin expression.
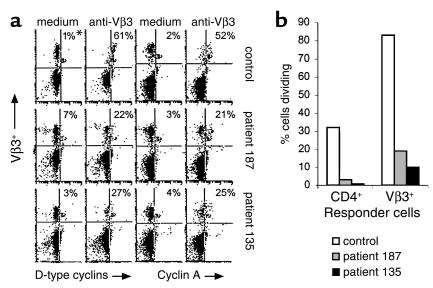
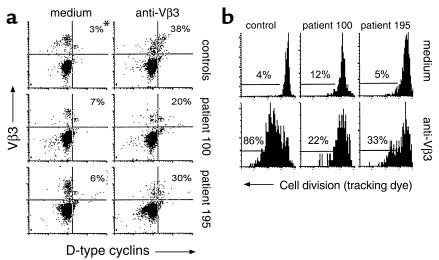
Proliferation defects in CD4+ T cells from HIV-infected patients may be caused by an altered potential of these cells to progress through the cell cycle. To examine this possibility, the expression of D-type cyclins, which are expressed in G1 phase of the cell cycle, and cyclin A, which is expressed in S phase of the cell cycle, was assessed in anti-Vβ3–stimulated cells. Cyclin expression was examined in unstimulated and stimulated CD4+Vβ3+ cells by flow cytometry 2 days after exposure to anti-Vβ3 Ab. Stimulated cells showed an enhancement of cyclin expression when compared with unstimulated cells. The specificity of the staining was verified by using isotype control Ab’s and the enhancement of cyclin expression with stimulation could be inhibited by cyclosporine A (data not shown). Before 2 days after stimulation, very little enhancement in staining for cyclins could be observed (not shown). At day 2 we found typically that fewer than 10% of the stimulated Vβ3+ cells had divided, as determined by tracking dye analysis (data not shown). Thus, the expression of cell cycle markers (cyclins) at 2 days after stimulation predominantly reflects the first attempts at cell division. CD4+Vβ3+ cells from HIV-infected patients demonstrated marked defects in activation-induced enhancement of cyclin expression (Figure 4a). The reduced proportions of cells expressing these cell cycle progression markers on day 2 were associated with impaired cell division as measured on day 4 by tracking dye dilution (Figure 4b). These findings suggest that patient cells fail to divide due to arrest in cell cycle progression that occurs before D-type cyclin expression.
Figure 4.
Cyclin expression and proliferation responses. (a) PBMCs were stimulated with anti-Vβ3 Ab or left unstimulated. On the second day of culture the cells were triple-stained for CD4, Vβ3, and either D-type cyclins or cyclin A. Enhancement in cyclin expression was determined by using unstimulated cells to set the background. Histograms are shown for CD4+ cells. The y axis indicates Vβ3 staining and the x axis indicates cyclin staining. *Numbers represent the percentage of Vβ3+ cells that are cyclin-positive. (b) The percentages of CD4+ or Vβ3+ cells that had divided by day 4 after stimulation are shown. The values represent the percentage of stimulated cells that had divided minus the values of unstimulated cells that had divided.
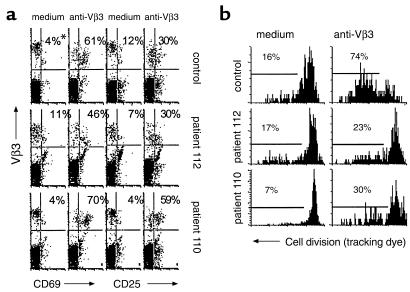
The above experiment was performed with whole PBMCs, which are characterized by a disproportionate representation of CD8+ cells for blood samples from HIV-infected patients. This could be important, since a subpopulation of CD8+ cells also expresses the Vβ3 chain and could potentially respond to stimulation by using up growth factors while contributing little to replenishment. To determine if the defect in cell cycle progression in CD4+ cells was dependent on CD8+ cells, we depleted PBMCs of CD8+ cells and stimulated with anti-Vβ3 Ab. D-type cyclin expression was impaired for patient CD4+ cells 2 days after stimulation (Figure 5a), and this was again associated with reduced proliferation responses (Figure 5b). By examining forward-scatter characteristics of CD4+Vβ3+ cells, we found that apoptosis of these cells was actually less in the patient cultures than in the control cultures on day 2 (data not shown), arguing against the possibility that cells from patients acquire cyclin expression but rapidly die. Thus, the defect in D-type cyclin expression by patient CD4+ cells was independent of CD8+ T cells and not associated with overt apoptotic death.
Figure 5.
D-type cyclin expression and proliferation responses. (a) CD8-depleted PBMCs were examined for expression of D-type cyclins 2 days after stimulation with anti-Vβ3PE Ab. Cells were gated on CD4+ cells, and staining is shown for Vβ3 expression (y axis) and D-type cyclin expression (x axis). *Numbers represent the percentage of Vβ3+ cells that are D-type cyclin–positive. (b) Proliferation of cells gated for Vβ3 expression in unstimulated and anti-Vβ3–stimulated cultures 4 days after the initial stimulation is shown.
Although expression of D-type cyclins is typically associated with the G1 phase of the cell cycle and cyclin A is a marker of S phase, it is possible that expression of D-type cyclins and cyclin A could overlap to some extent as suggested by the proportions of cells staining positive for these markers in the control depicted in Figure 4a. Therefore, to verify that proliferation failure in patient cells was associated with cell cycle arrest before S-phase entry, incorporation of BrdU into synthesizing DNA was examined in CD4+Vβ3+ cells 2 days after stimulation with anti-Vβ3 Ab in three healthy donors and five HIV-infected patients. In comparison with control samples, three of five patient samples demonstrated marked reductions in BrdU incorporation following stimulation with anti-Vβ3 Ab (Table 1). By regression analysis, BrdU incorporation correlated with proliferation responses as measured by tracking dye dilution (r = 0.91). The proportional decrease in BrdU incorporation, like the decrease in expression of D-type cyclins and cyclin A, suggests that proliferation failure in patient cells occurs before S phase of the cell cycle.
Table 1.
BrdU incorporation following anti-Vβ3 Ab stimulation
Activation marker expression is enhanced by anti-Vβ3 Ab stimulation in cells from HIV-infected patients.
The reduced proportions of cyclin-expressing cells following stimulation of patient T cells with anti-Vβ3 Ab might be explained by a proportional failure in cellular activation or, alternatively, by events that could occur following initial cellular activation. To determine the potential for anti-Vβ3 Ab to activate patient T cells, the expression of the early activation markers CD69 and CD25 was determined after stimulation.
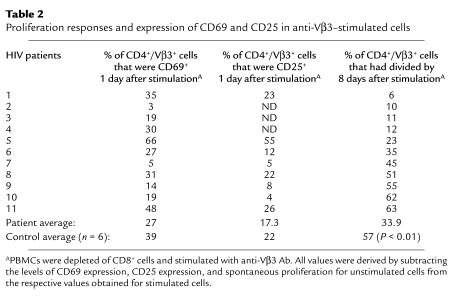
CD8-depleted PBMCs were stimulated with anti-Vβ3 Ab and assessed after an overnight culture for cell surface expression of CD69 and CD25 using flow cytometry. The expression of CD69 and CD25 was enhanced in cells from HIV-infected subjects following an overnight activation (Figure 6a), but this did not correspond with the ability of the cells to divide subsequently (Figure 6b). In contrast to proliferation responses that were reduced in patient cells, differences in CD69 and CD25 expression between patient and control cells did not reach statistical significance. Cells from a minority of patients appeared to have reduced activation marker expression; however, this did not correspond to a defect in proliferation (Table 2). Thus, for cells from HIV-infected patients, CD69 and CD25 expression appear to be poor predictors of the proliferation response to anti-Vβ3 Ab stimulation, and it is unlikely that reduced expression of these markers reflects or causes proliferation defects in this model. It appears that cells from HIV-infected subjects can be activated by anti-Vβ3 Ab stimulation, but this activation may not always be sufficient to drive cells into the cell cycle.
Figure 6.
Activation marker expression and cell division. (a) CD8-depleted PBMCs were stimulated with anti-Vβ3 Ab. Cells were recovered from culture 1 day after stimulation and stained for CD4, Vβ3, and either CD69 or CD25. Isotype control Ab’s were used to set the gates. *Numbers represent the percentage of Vβ3+ cells that are either CD69+ or CD25+. (b) Proliferation of cells determined 8 days after stimulation are shown.
Table 2.
Proliferation responses and expression of CD69 and CD25 in anti-Vβ3–stimulated cells
High viral replication and low CD4 cell counts are correlated with proliferation defects.
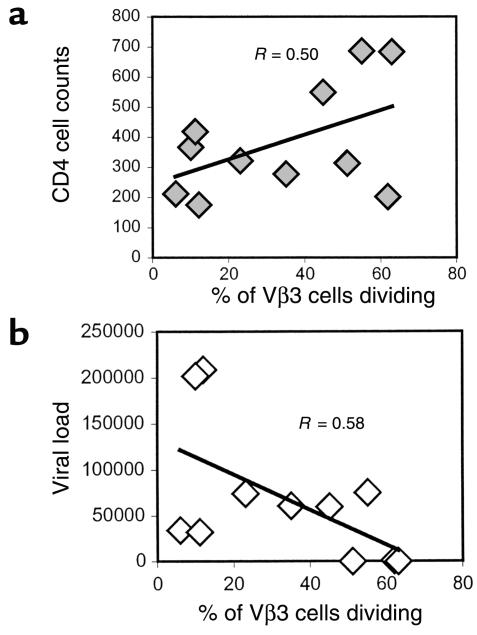
To evaluate the relationship between T cell function and clinical status, peripheral CD4 cell numbers and plasma HIV RNA levels were compared with the proportion of CD4+Vβ3+ cells that could proliferate in response to stimulation with anti-Vβ3 Ab. Lower numbers of circulating CD4+ T cells were moderately correlated with decreased proliferation responses in cells from HIV-infected subjects (Figure 7a). In addition, a moderate inverse correlation was noted between plasma viral load and proliferation of Vβ3+CD4+ cells (Figure 7b). Thus, the proliferative potential of patient CD4 cells appears to be related to clinical status such that elevated CD4 cell numbers and limited viral replication are associated with better proliferation responses to anti-Vβ3 Ab stimulation.
Figure 7.
Comparison of CD4 cell counts and viral load with proliferation responses. CD8-depleted PBMCs were stimulated with anti-Vβ3 Ab, and the percentage of Vβ3+ cells that had reduced levels of tracking dye were determined. The respective percentages of Vβ3+ cells with reduced tracking dye levels in unstimulated cultures were subtracted from the values obtained in stimulated cultures. (a) The percentage of proliferating Vβ3+ cells was compared with CD4 cell counts (cells per microliter) of HIV-infected subjects. (b) The percentage of proliferating Vβ3+ cells was compared with the viral load (copies per milliliter).
Discussion
Anti-Vβ3 Ab stimulation of peripheral T cells may provide significant advantages over current approaches for examining T cell function in HIV disease. Traditional models used to assess CD4+ T cell function in HIV disease rely primarily on mitogen or recall antigen for T cell stimulation. Responses to recall antigen are preferable in that a physiological stimulus is used to induce activation of T cells, but interpretation is complicated by possible differences in effector cell precursor frequencies. This problem has been partially solved by the use of MHC tetramers that can identify antigen-specific precursor cells at low frequencies. Tetramer technology has been used to assess CD8+ T cell activation in response to class I–restricted antigens (15–17) and is being adapted for MHC class II–restricted responses (17–19). However, the latter has not yet become widely available. The use of anti-Vβ3 Ab stimulation provides a methodology that allows for evaluation of T cell activation on an identifiable responder population that can be assessed for responsiveness on a single cell basis. Moreover, the stimulation of a minority of T cells in a PBMC culture by anti-Vβ3 Ab minimizes the potential confounding factors associated with conventional mitogen stimulation. Thus, the advantages of stimulating T cells with anti-Vβ3 Ab makes this approach a reasonable and convenient method to examine CD4+ T cell function in HIV-infected patients.
The technique of anti-Vβ3 Ab stimulation allowed for detection of patient cell proliferation defects that could not be observed using anti-CD3 Ab. The targeting of a subpopulation of T cells for activation provides an explanation for the increased sensitivity of anti-Vβ3 Ab stimulation over that of anti-CD3 Ab stimulation in the detection of proliferation failure in HIV disease. The loss of proliferation responses in patient cells that were stimulated with anti-CD3 Ab and subsequently diluted with unstimulated cells supports this suggestion. The latter observation also suggests that proliferation defects are not selective for Vβ3+ cells in HIV infection. This is further supported by studies showing that Vβ3+ cells are not selectively depleted in HIV infection (20, 21).
The induced expression of CD69 and CD25 following stimulation of CD4+ T cells from HIV-infected patients with anti-Vβ3 Ab provides evidence that these cells are activated by T cell receptor ligation. Consistent with this observation, others have described normal levels of T cell receptor–induced calcium mobilization in T cells from HIV-infected patients following CD3 cross-linking (22). Despite acquiring an activated phenotype, anti-Vβ3 Ab–stimulated cells from HIV-infected patients commonly demonstrate proliferation failure. Likewise, relatively intact IFN-γ cytokine responses to recall or HIV antigens have been seen in circumstances where proliferation defects are often observed (23) or expected (13) in patient T cells. Thus, T cell receptor stimulation of cells from HIV-infected patients may result in a defect that is selective for cell cycle progression.
Our data suggest that CD4+ T cells fail to divide following anti-Vβ3 stimulation because of arrest in cell cycle progression that occurs early in the G1 phase of the cell cycle. Decreased CD25 induction has been described as a defining event in the progression of T cells from the G0 into G1 phase of the cell cycle (24), whereas expression of cyclins D2 and D3 is enhanced in G1 phase of the cell cycle (25). D-type cyclin/kinase complexes mediate hyperphosphorylation of the retinoblastoma gene product (26–28), thereby allowing for transition to S phase of the cell cycle. The normal expression of CD25 in stimulated CD4+ T cells from HIV-infected subjects suggests that cells enter into G1 phase, while the reduced D-type cyclin expression indicates a failure in subsequent cell cycle progression. Thus, events associated with cell cycle arrest in early G1 phase of the cell cycle may underlie CD4 cell proliferation failure in HIV infection. Nevertheless, it should be noted that these observations do not rule out the possibility that defects in other phases of the cell cycle could also occur in stimulated cells from HIV-infected patients.
The clinical status of HIV-infected patients may play a role in qualitative T cell defects. Proliferation of CD4+ T cells from HIV-infected patients correlated directly with circulating CD4 cell counts and inversely with viral load. The mechanisms responsible for T cell proliferation defects have not been identified; however, we speculate that high levels of viral replication may expose cells to viral factors such as gp120 and tat that disrupt normal CD4+ T cell function (29–33). Disruptive effects of viral proteins may be compounded by a lack of sufficient helper function imposed by reduced numbers of CD4+ T cells. Taken together, these factors may alter subsequent cellular responsiveness to signals delivered through the T cell receptor leading T cells into a state of unresponsiveness similar to T cell anergy.
Overall, our findings suggest that patient CD4+ cells fail to divide following stimulation as a consequence of events that occur before D-type cyclin expression in the G1 phase of the cell cycle. By using a relevant T cell activation model we can now begin to focus attention on early events that underlie CD4+ T cell dysfunction in HIV disease.
Acknowledgments
We thank Robert Asaad for his assistance in acquiring blood samples. Scott Sieg is supported by National Research Service Award, grants AI-07024-21 and AI-38858, NIH.
References
- 1.Clerici M, et al. Detection of three distinct patterns of T helper cell dysfunction in asymptomatic, human immunodeficiency virus-seropositive patients. J Clin Invest. 1989;84:1892–1899. doi: 10.1172/JCI114376. [DOI] [PMC free article] [PubMed] [Google Scholar]
- 2.Miedema F, et al. Immunological abnormalities in Human Immunodeficiency Virus (HIV)-infected asymptomatic homosexual men: HIV affects the immune system before CD4+ T helper cell depletion occurs. J Clin Invest. 1988;82:1908–1914. doi: 10.1172/JCI113809. [DOI] [PMC free article] [PubMed] [Google Scholar]
- 3.Musey LK, et al. Early and persistent human immunodeficiency virus type 1 (HIV-1)-specific T helper dysfunction in blood and lymph nodes following acute HIV-1 infection. J Infect Dis. 1999;180:278–284. doi: 10.1086/314868. [DOI] [PubMed] [Google Scholar]
- 4.Gurley RJ, Ikeuchi K, Byrn RA, Anderson K, Groopman JE. CD4+ lymphocyte function with early human immunodeficiency virus infection. Proc Natl Acad Sci USA. 1989;86:1993–1997. doi: 10.1073/pnas.86.6.1993. [DOI] [PMC free article] [PubMed] [Google Scholar]
- 5.Rosenberg ES, et al. Vigorous HIV-1-specific CD4+ T cell responses associated with control of viremia. Science. 1997;278:1447–1450. doi: 10.1126/science.278.5342.1447. [DOI] [PubMed] [Google Scholar]
- 6.Kalams SA, et al. Association between virus-specific cytotoxic T-lymphocyte and helper responses in human immunodeficiency virus type 1 infection. J Virol. 1999;73:6715–6720. doi: 10.1128/jvi.73.8.6715-6720.1999. [DOI] [PMC free article] [PubMed] [Google Scholar]
- 7.Rollides E, et al. Helper T-cell responses in children with human immunodeficiency virus type 1. J Pediatr. 1991;118:724–730. doi: 10.1016/s0022-3476(05)80033-2. [DOI] [PubMed] [Google Scholar]
- 8.Groux H, et al. Activation-induced death by apoptosis in CD4+ T cells from HIV-1 infected asymptomatic individuals. J Exp Med. 1992;175:331–340. doi: 10.1084/jem.175.2.331. [DOI] [PMC free article] [PubMed] [Google Scholar]
- 9.Meyaard L, et al. Programmed death of T cells in HIV-1 infection. Science. 1992;257:217–219. doi: 10.1126/science.1352911. [DOI] [PubMed] [Google Scholar]
- 10.Krowka JF, et al. Expression of CD69 after in vitro stimulation: a rapid method for quantitating impaired lymphocyte responses in HIV-infected individuals. J Acquir Immune Defic Syndr Hum Retrovirol. 1996;11:95–104. doi: 10.1097/00042560-199601010-00013. [DOI] [PubMed] [Google Scholar]
- 11.Perfetto SP, et al. Measurement of CD69 induction in the assessment of immune function in asymptomatic HIV-infected individuals. Cytometry. 1997;30:1–9. doi: 10.1002/(sici)1097-0320(19970215)30:1<1::aid-cyto1>3.0.co;2-r. [DOI] [PubMed] [Google Scholar]
- 12.Prince HE, Lape-Nixon M. CD69 expression reliably predicts the anti-CD3-induced proliferative response of lymphocytes from human immunodeficiency virus type 1-infected patients. Clin Diagn Lab Immunol. 1997;4:217–222. doi: 10.1128/cdli.4.2.217-222.1997. [DOI] [PMC free article] [PubMed] [Google Scholar]
- 13.Pitcher CJ, et al. HIV-1-specific CD4+ T cells are detectable in most individuals with active HIV-1 infection, but decline with prolonged viral suppression. Nat Med. 1998;5:518–525. doi: 10.1038/8400. [DOI] [PubMed] [Google Scholar]
- 14.Patki AH, Sieg SF, Zielske SP, Lederman MM. Preferential S phase entry and apoptosis of CD4+ T lymphocytes of HIV-1-infected patients after in vitro cultivation. Clin Immunol. 2000;97:241–247. doi: 10.1006/clim.2000.4940. [DOI] [PubMed] [Google Scholar]
- 15.Appay V, et al. HIV-specific CD8(+) T cells produce antiviral cytokines but are impaired in cytolytic function. J Exp Med. 2000;192:63–73. doi: 10.1084/jem.192.1.63. [DOI] [PMC free article] [PubMed] [Google Scholar]
- 16.Shanker P, et al. Impaired function of circulating HIV-specific CD8+ T cells in chronic human immunodeficiency virus infection. Blood. 2000;96:3094–3101. [PubMed] [Google Scholar]
- 17.Kelleher AD, Rowland-Jones SL. Functions of tetramer-stained HIV-specific CD4(+) and CD8(+) T cells. Curr Opin Immunol. 2000;12:370–374. doi: 10.1016/s0952-7915(00)00102-3. [DOI] [PubMed] [Google Scholar]
- 18.Novak EJ, Liu AW, Nepom GT, Kwok WW. MHC class II tetramers identify peptide-specific human CD4(+) T cells proliferating in response to influenza A antigen. J Clin Invest. 1999;104:R63–R67. doi: 10.1172/JCI8476. [DOI] [PMC free article] [PubMed] [Google Scholar]
- 19.Meyer AL, et al. Direct enumeration of borrelia-reactive CD4 T cells ex vivo by using MHC class II tetramers. Proc Natl Acad Sci USA. 2000;97:11433–11438. doi: 10.1073/pnas.190335897. [DOI] [PMC free article] [PubMed] [Google Scholar]
- 20.Boyer V, et al. T cell receptor Vβ repertoire in HIV-infected individuals: lack of evidence for selective Vβ depletion. Clin Exp Immunol. 1993;92:437–441. doi: 10.1111/j.1365-2249.1993.tb03417.x. [DOI] [PMC free article] [PubMed] [Google Scholar]
- 21.Posnett DN, Kabak S, Hodtsev A, Goldberg EA, Asch A. T-cell antigen receptor V beta subsets are not preferentially deleted in AIDS. AIDS. 1993;7:625–631. doi: 10.1097/00002030-199305000-00003. [DOI] [PubMed] [Google Scholar]
- 22.Hickey TE, et al. Intact antigen receptor-mediated calcium signals in patients with early stage HIV-1 infection. J Immunol. 1996;156:4012–4017. [PubMed] [Google Scholar]
- 23.Patki AH, Purvis SF, Meyerson H, Lederman MM. Lymphocyte proliferation assays may underestimate antigen responsiveness in human immunodeficiency virus infection. Clin Immunol. 1999;93:241–247. doi: 10.1006/clim.1999.4802. [DOI] [PubMed] [Google Scholar]
- 24.Crabtree GR. Contingent genetic regulating events in T lymphocyte activation. Science. 1989;243:355–361. doi: 10.1126/science.2783497. [DOI] [PubMed] [Google Scholar]
- 25.Ajchenbaum F, Ando K, DeCaprio JA, Griffin JD. Independent regulation of human D-type cyclin gene expression during G1 phase in primary human T lymphocytes. J Biol Chem. 1993;268:4113–4119. [PubMed] [Google Scholar]
- 26.Ewen ME, et al. Functional interactions of the retinoblastoma protein with mammalian D-type cyclins. Cell. 1993;73:487–497. doi: 10.1016/0092-8674(93)90136-e. [DOI] [PubMed] [Google Scholar]
- 27.Kato J, Matsushime H, Hiebert SW, Ewen ME, Sherr CJ. Direct binding of cyclin D to the retinoblastoma gene product (pRb) and pRb phosporylation by the cyclin D-dependent kinase CDK4. Genes Dev. 1993;7:331–342. doi: 10.1101/gad.7.3.331. [DOI] [PubMed] [Google Scholar]
- 28.Sherr CJ. D-type cyclins. Trends Biochem Sci. 1995;20:187–190. doi: 10.1016/s0968-0004(00)89005-2. [DOI] [PubMed] [Google Scholar]
- 29.Banda N, et al. Crosslinking CD4 by human immunodeficiency virus gp120 primes T cells for activation-induced apoptosis. J Exp Med. 1992;176:1099–1106. doi: 10.1084/jem.176.4.1099. [DOI] [PMC free article] [PubMed] [Google Scholar]
- 30.Hubert P, Bismuth G, Korner M, Debre P. HIV-1 glycoprotein gp120 disrupts CD4-p56lck/CD3-T cell receptor interactions and inhibits CD3 signaling. Eur J Immunol. 1995;25:1417–1425. doi: 10.1002/eji.1830250542. [DOI] [PubMed] [Google Scholar]
- 31.Chirmule N, Than S, Khan SA, Pahwa S. Human immunodeficiency virus Tat induces functional unresponsiveness in T cells. J Virol. 1995;69:492–498. doi: 10.1128/jvi.69.1.492-498.1995. [DOI] [PMC free article] [PubMed] [Google Scholar]
- 32.Li CJ, Friedman DJ, Wang C, Metelav V, Pardee AB. Induction of apoptosis in uninfected lymphocytes by HIV-1 tat protein. Science. 1995;268:429–431. doi: 10.1126/science.7716549. [DOI] [PubMed] [Google Scholar]
- 33.Purvis SF, Jaccobberger JW, Sramkoski RM, Patki AH, Lederman MM. HIV-1 Tat protein induces apoptosis and death in Jurkat cells. AIDS Res Hum Retroviruses. 1995;11:443–450. doi: 10.1089/aid.1995.11.443. [DOI] [PubMed] [Google Scholar]


