

Abstract
Localization of the actin cross-linking protein, α-actinin, to the cleavage furrow has been previously reported. However, its functions during cytokinesis remain poorly understood. We have analyzed the functions of α-actinin during cytokinesis by a combination of molecular manipulations and imaging-based techniques. α-actinin gradually dissipated from the cleavage furrow as cytokinesis progressed. Overexpression of α-actinin caused increased accumulation of actin filaments due to inhibition of actin turnover, leading to cytokinesis failure. Global depletion of α-actinin by siRNA caused a decrease in the density of actin filaments throughout the cell cortex, surprisingly inducing accelerated cytokinesis and ectopic furrows. Local ablation of α-actinin induced accelerated cytokinesis specifically at the site of irradiation. Neither overexpression nor depletion of α-actinin had an apparent effect on myosin II organization. We conclude that cytokinesis in mammalian cells requires tightly regulated remodeling of the cortical actin network mediated by α-actinin in coordination with actomyosin-based cortical contractions.
Introduction
Cytokinesis is a spatially and temporally regulated event crucial for accurate separation of chromosomes and organelles into two daughter cells. In animal cells, cortical ingression takes place along the equator after chromosome separation. In spite of recent advances, which have led to an increased understanding of division-plane positioning (Maddox and Oegema, 2003; Glotzer, 2004), it remains largely unknown how cortical ingression is regulated during cytokinesis. Due to the existence of strong cortical forces (Burton and Taylor, 1997), and the concentration of actin filaments and myosin II along the equator (Fujiwara and Pollard, 1976; Sanger and Sanger, 1980; Maupin and Pollard, 1986), it is widely believed that cortical ingression involves the constriction of an actomyosin contractile ring (Satterwhite and Pollard, 1992). However, the process appears to be more complex than the simple constriction of a contractile ring (Wang, 2005).
Several reports have shown that actin is highly dynamic along the equator (Pelham and Chang, 2002; Murthy and Wadsworth, 2005; Guha et al, 2005), and that both actin assembly and disassembly are required for cytokinesis (O’Connell et al, 2001; Pelham and Chang, 2002; Murthy and Wadsworth, 2005; Guha et al, 2005). In fission yeast, inhibition of actin polymerization by low doses of latrunculin A induced a decreased rate of ring closure (Pelham and Chang, 2002), suggesting that cytokinesis requires the integrity of certain actin structures. A similar phenotype was also observed after global application of latrunculin A to mammalian cells (Murthy and Wadsworth, 2005). On the other hand, local application of cytochalasin D or latrunculin A at the equator facilitates cytokinesis, suggesting that cortical actin disassembly promotes cytokinesis (O’Connell et al, 2001).
Recent studies suggested that myosin II activity plays a role in facilitating actin turnover along the equator (Murthy and Wadsworth, 2005; Guha et al, 2005). Actin depolymerizing factor (ADF)/cofilin is also likely involved in not only formation and maintenance of the contractile ring (Nakano and Mabuchi, 2006), but also the regulation of actin disassembly during furrow ingression, as its knockdown resulted in the robust accumulation of actin filaments along the equator and cytokinesis failure (Gunsalus et al, 1995; Somma et al, 2002; Hotulainen et al, 2005). In addition to actin assembly and disassembly, cytokinesis likely involves remodeling of a cortex-associated, cross-linked actin filament network.
An actin cross-linking protein termed α-actinin was found in the cleavage furrow of animal cells almost 30 years ago (Fujiwara et al, 1978; Mabuchi et al, 1985; Sanger et al, 1987). α-actinin is a homodimer with two subunits of molecular mass ~ 100 kDa each (Suzuki et al, 1976) arranged in an antiparallel orientation (Djinovic et al, 1999; Ylanne et al, 2001). It is present in both muscle and nonmuscle cells, interacting with a large number of molecular partners such as α-catenin, vinculin, integrins and zyxin, and is found in multiple subcellular regions, including sarcomeric z-lines, cell-cell and cell-matrix contact sites and stress fibers (Otey and Carpen, 2004). Interestingly, it has been shown that increased cross-linking of actin filaments by α-actinin inhibits myosin-based contractions in vitro (Janson et al, 1992). Moreover, in the presence of α-actinin, a member of the ADF/cofilin family named actophorin promotes bundling of actin filaments in vitro (Maciver et al, 1991), presumably by limited disruption of the cross-linked network. These observations raise a possibility that modulation of the actin filaments network by α-actinin might regulate actomyosin contractility and/or actin bundle assembly during cytokinesis. While a previous study has indicated a role of α-actinin in cytokinesis of fission yeasts (Wu et al, 2001), little is known about its precise function in relation to cortical contraction.
In the present study, we have dissected the function of α-actinin during cytokinesis of mammalian cells. Our observations strongly suggest that cytokinesis requires the remodeling of actin filaments by α-actinin. We also suggest that cytokinetic ingression requires remodeling rather than the accumulation of actin filaments.
Results
Dynamics of α-actinin during cell division of mammalian cells
Consistent with previous reports (Fujiwara et al, 1978; Sanger et al, 1987), endogenous α-actinin primarily accumulated at the equatorial region, colocalizing along actin filaments during cytokinesis of normal rat kidney epithelial (NRK) cells (Figure 1A). α-actinin maintained its activity when fused to GFP, as indicated by its ability to rescue defects caused by depletion of endogenous α-actinin (described later) and its localization in fixed samples mimicking the endogenous protein (data not shown). α-actinin-GFP was used for visualizing the dynamics of α-actinin during anaphase and cytokinesis (Figure 1B and supplemental video 1). Cells expressing α-actinin-GFP at low level showed a small number of α-actinin-containing, dot-like structures on the cortex. At about 100 seconds after anaphase onset, α-actinin-GFP started accumulating along the equator as punctuate structures, which developed into a strong equatorial band during early cytokinesis and dissipated subsequently, leaving little trace around the midbody at late cytokinesis. Quantitative analysis indicated that the fluorescent signal reached its peak simultaneously with furrow initiation (Figure 1C, arrow; 235.0 ± 13.0 s after anaphase onset) and steadily decreased during furrow ingression, while its intensity remained essentially unchanged in the polar region during cytokinesis (Figure 1C).
Figure 1. Dynamics of α-actinin during cell division.

(A) Localization of endogenous α-actinin during cytokinesis. Cells were fixed and immunostained with antibodies against α-actinin (green) and rhodamine-phalloidin (red). Bar, 10 μm. (B) An NRK cell expressing α-actinin-GFP was monitored by fluorescence optics. α-actinin-GFP starts accumulating (yellow arrow) along the cleavage furrow (pointed by white arrows) soon after anaphase onset. During furrow ingression, α-actinin dissipates from the cleavage furrow to the subequatorial region (thick red arrow). Upon completion of cytokinesis, α-actinin-GFP accumulates at the sites of cell-cell contacts (red arrow), while it is hardly present in the midbody (blue arrow). Time elapsed in seconds since anaphase onset is shown at the bottom right corner of each image. Bar, 10 μm. (C) Quantification of α-actinin-GFP intensity at the cleavage furrow. Zero indicates the time of anaphase onset. Arrow indicates time of furrow initiation. Each value represents mean ± SEM (n = 10). (D) FRAP analysis of α-actinin-GFP during cytokinesis. NRK cells expressing α-actinin-GFP were bleached at the equatorial (n = 15), subequatorial (7–15 μm from the furrow leading edge) (n = 8), and polar regions (n = 3) during cytokinesis or along the stress fibers (n = 13) during interphase. Bars = mean ± SEM.
To analyze the dynamics of α-actinin in more details, we performed FRAP analysis of α-actinin-GFP (Figure 1D and Figure S1A in the Supplemental Data). While the recovery half-time of α-actinin-GFP along the stress fibers in interphase cells was close to 30 seconds (t½ = 27.0 ± 3.8 s; Fraley et al., 2005, Hotulainen and Lappalainen, 2006), the half-time was less than 10 seconds along the equator (t½ = 7.9 ± 0.5 s). The subequatorial region showed an intermediate mobility (t½ = 20.1 ± 2.3 s). These results suggest that α-actinin was highly dynamic at the equator during cytokinesis.
Overexpression of α-actinin causes an increase in equatorial actin filaments, delayed cytokinesis and cytokinesis failure
In order to analyze the function of α-actinin, we first performed gain-of-function experiments by overexpressing α-actinin-GFP. Over 25% of the cells overexpressing α-actinin were multinucleated at 2 days after transfection, whereas about 3% of nontransfected cells were multinucleated (Figure 2A), suggesting that overexpression of α-actinin-GFP inhibits cytokinesis. Time-lapse microscopy confirmed that 23% (13/57) of cells overexpressing α-actinin-GFP failed cytokinesis. The relative amount of α-actinin in cells expressing α-actinin-GFP was estimated by the intensity of immunofluorescence staining. The total amount of α-actinin was increased 4–5 fold in cells that had failed cytokinesis, while cells with ~2-fold overexpression of α-actinin-GFP had divided normally, suggesting that the cytokinetic defect in cells overexpressing α-actinin-GFP is dependent on its expression level.
Figure 2. Overexpression of α-actinin causes delayed cytokinesis and cytokinesis failure.

(A) Frequency of multinucleation in cells transfected with GFP (n = 273), α-actinin-GFP (n = 361), or non-transfected neighboring cells (n = 452 and n = 1161, accordingly). Bars = mean ± SEM. A control NRK cell (B), or an NRK cell overexpressing α-actinin-GFP at a high level (C), was monitored by time-lapse phase and/or fluorescence optics. Time elapsed in minutes and seconds after anaphase onset is shown at the bottom-right corner. The initially symmetric furrow regresses on one side of the equator (red arrow). Furrow progression continues even after the furrow regressed from one side of the equator (yellow arrows). During furrow ingression, the nuclear envelope forms normally (black arrows). α-actinin-GFP strongly accumulates along the equator (blue arrow). Bar, 10 μm. (D) Plots of furrow width over time after anaphase onset. The furrow width was monitored for seven different cells overexpressing α-actinin-GFP and for three representative control cells. Cells shown in Figure 1B, 2C, and 2B are plotted under the name of α-actinin-GFP 1, α-actinin-GFP 4, and control 1, respectively.
In cells overexpressing α-actinin at high level that failed cytokinesis (Figure 2C and supplemental video 2), no apparent defects in spindle positioning or chromosome congression were observed. The failure typically involved slowing of ingression and regression on one side of the furrow, after an apparently symmetric initial ingression. Ingression progressed extremely slowly, lasting for around 50 min, while the nuclear envelope formed normally. Eventually, the furrow regressed without forming the midbody, resulting in the formation of a binucleated cell. Corresponding fluorescence images of α-actinin-GFP showed that α-actinin-GFP accumulated strongly along the equator (Figure 2C, blue arrow). In contrast, in control nontransfected cells, furrow ingression typically initiated soon after chromosome separation and progressed from both sides of the equator, and the midbody formed at ~ 16 min after anaphase onset (Figure 2B and supplemental video 3).
As α-actinin-GFP is an actin cross-linking protein, we examined the effects of overexpression of α-actinin-GFP on actin filament organization using rhodamine-phalloidin. We detected a significant increase in the density of actin filaments not only along the equator but also throughout the cell cortex, in cells overexpressing α-actinin-GFP compared to control cells (Figures 3A, 3B and 4C). Overexpression of the truncated α-actinin protein lacking the ability to cross-link actin filaments (the actin binding domain; ABD) fused to GFP had no effect on the density of actin filaments along the equator, although ABD-GFP was localized to the cleavage furrow (Figures 3C and 3D). Moreover, there was no significant difference in the frequency of multinucleation between cells overexpressing ABD-GFP (3.1 ± 0.2 %, n = 356) and control non-transfected cells (2.9 ± 0.4 %, n = 369). These results suggest that extensive cross-linking of actin filaments by overexpression of α-actinin leads to increased density of actin filaments, causing cytokinesis failure.
Figure 3. Overexpression of α-actinin causes an increase in the accumulation of actin filaments by inhibition of actin turnover.
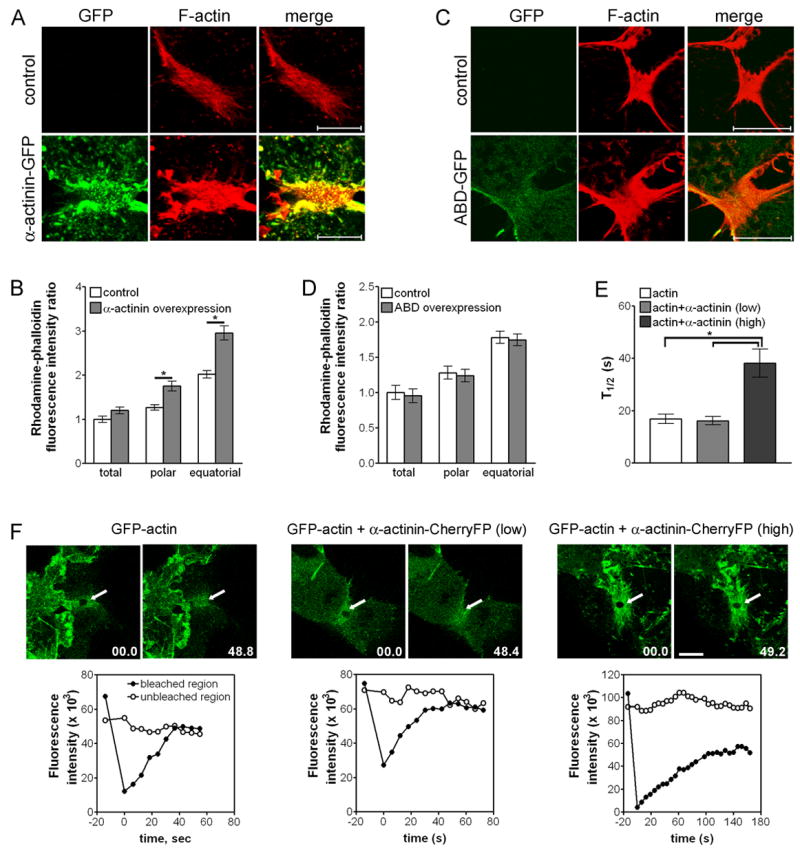
(A) NRK cells transiently transfected with α-actinin-GFP or control nontransfected cells were fixed and stained with rhodamine-phalloidin (red). Bar, 10 μm. Note that whole cell images are shown in Figure 4C. (B) Quantification of F-actin fluorescence intensity of control cells (n = 27) and cells overexpressing α-actinin-GFP (n = 14) during cytokinesis. Bars = mean ± SEM. *P < 0.0001. (C) NRK cells transiently transfected with ABD-GFP or control nontransfected cells were fixed and stained with rhodamine-phalloidin (red). Bar, 10 μm. (D) Quantification of F-actin fluorescence intensity of control cells (n = 9) and cells overexpressing ABD-GFP (n = 10) during cytokinesis. Bars = mean ± SEM. (E) Rate of FRAP for GFP-actin. Bars = mean ± SEM. *P < 0.0005. (F) FRAP analysis of GFP-actin in cells overexpressing α-actinin-CherryFP during cytokinesis. Cells expressing GFP-actin (n = 11), cells expressing both GFP-actin and α-actinin-Cherry at low level that showed normal cytokinesis (n = 13) or cells expressing both GFP-actin and α-actinin-Cherry at high level that showed delayed cytokinesis (n = 5) were bleached in the indicated region (arrows) along the equator. Bar, 10 μm.
Figure 4. Overexpression of α-actinin has no significant effect on myosin II organization but induces precocious formation of focal adhesions during cytokinesis.

(A) NRK cells transiently transfected with α-actinin-GFP (green) or control nontransfected NRK cells were stained with antibodies against myosin II (red) and Hoechst 33258 (blue). 3D reconstructed images are presented. Bar, 10 μm. (B) Quantification of myosin II fluorescence intensity in whole cells and at both the equatorial and polar regions of cells overexpressing α-actinin-GFP (n = 10) compared with control cells (n = 19). Bars = mean ± SEM. (C) NRK cells transiently transfected with α-actinin-GFP or control nontransfected cells were fixed and stained with rhodamine-phalloidin (red) and antibodies against vinculin (blue). In cells overexpressing α-actinin-GFP that failed cytokinesis, vinculin plaques are observed along the equator (arrow). Bar, 10 μm. (D) Comparison of relative rigidity of cells overexpressing GFP with that of cells overexpressing α-actinin-GFP. The graph shows the ratio of mean rigidity of cells expressing GFP over that of cells overexpressing α-actinin-GFP. Bars = mean ± SEM.
To determine if overexpression of α-actinin affects actin dynamics along the equator, we performed FRAP analysis of GFP-actin in cells overexpressing α-actinin fused to Cherry fluorescent protein (CherryFP), which induced similar effects and localization pattern as overexpression of α-actinin-GFP (Figure S2). FRAP showed that GFP-actin turned over slower in α-actinin-CherryFP overexpressing cells that showed delayed cytokinesis (t1/2 = 38.1 ± 5.4 s) compared to control cells (t1/2 = 16.9 ± 1.8 s; Guha et al, 2005) and to cells with low level of α-actinin-CherryFP (t1/2 = 16.1 ± 1.6 s) (Figures 3E, 3F, and Figure S1B). Overexpression of α-actinin-GFP had no significant effect on the organization of myosin II during cytokinesis, which was organized as punctate structures predominantly along the equator of both control cells and cells overexpressing α-actinin-GFP (Figures 4A and 4B). These results indicate that overexpression of α-actinin-GFP inhibits actin turnover and causes the accumulation of actin filaments along the equator, without affecting myosin II organization.
In addition to affecting equatorial cortical dynamics, overexpression of α-actinin-GFP may affect cell-substrate adhesion during cytokinesis, which may in turn affect cytokinesis. Although the failure in cytokinesis cannot be easily explained by a failure in cell rounding, since α-actinin-GFP-overexpressing cells with both larger and normal size showed cytokinesis failure (Figure 2D), we noticed an increase in vinculin plaques throughout the cortex and particularly along the equator with no effect on its protein level, while control cells hardly showed any vinculin plaques during division (Figure 4C).
To determine whether overexpression of α-actinin-GFP affects cell rigidity, which may cause cytokinetic defects, we brought a thin glass needle to the side of an early mitotic cell overexpressing α-actinin-GFP or a control cell and moved it toward the center of the cell in 5 μm increments. Images of cells and needles allowed us to calculate the relative cell rigidity. The apparent rigidity of cells overexpressing α-actinin-GFP was slightly increased, compared to that of control cells (Figure 4D and Figure S3), although the difference was not statistically significant (P = 0.08). However, even though the cells remained attached to the substrate during probing, we cannot rule out the possibility that the measurements were also affected by altered cell adhesion, which may mask differences in cortical rigidity.
Depletion of α-actinin causes global decrease in cortical actin filaments, accelerated cytokinesis and ectopic furrowing
To determine the effect of disruption of α-actinin-mediated cortical actin cross-linking, we first performed local inactivation of α-actinin at the equator using chromophore assisted laser inactivation (CALI), which had been used successfully to inactivate α-actinin in interphase cells (Rajfur et al, 2002). CALI on one side of the equator induced a slightly deeper and wider furrow on the irradiated side than the non-irradiated side in about 60% of the cells (7/12) (Figure 5A, arrows), while such a furrow was rarely observed in control experiments (Figures 5A and 5B). This suggests that weakening of the cortical actin network by local inactivation of α-actinin may facilitate ingression. However, the effect of CALI is expected to be weak and transient due to the rapid exchange of α-actinin along the equator as indicated by FRAP analysis (Figure 1D).
Figure 5. Deactivation or depletion of α-actinin induces accelerated cytokinesis.
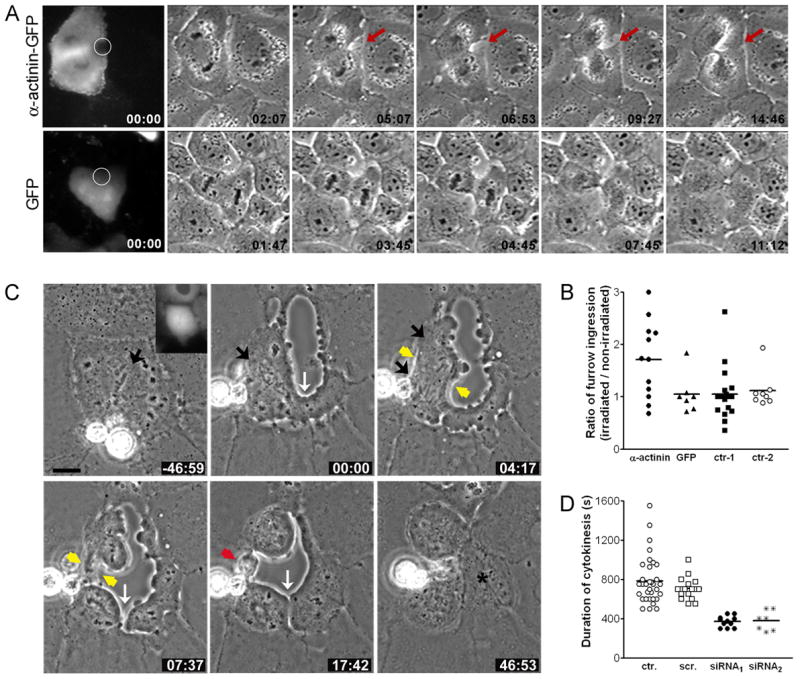
(A) One side of the equatorial region of a dividing NRK cell expressing α-actinin-GFP (top) or GFP only (bottom) was irradiated by a laser beam and monitored by time-lapse phase-contrast optics. (B) Ratio of furrow ingression between the laser-irradiated side and the non-irradiated side of the equator in cells expressing α-actinin-GFP (n = 12), cells expressing GFP alone (n = 7), and nontransfected cells with (n = 18; control 1) or without (n = 8; control 2) laser irradiation. Bars represent mean values. (C) Phase-contrast time-lapse images of NRK cells microinjected with siRNA against α-actinin during cell division. Time elapsed in minutes and seconds since anaphase onset is shown at the bottom-right corner of each image. Chromosome congression and separation occur normally (black arrows). However, precocious cortical ingression is induced before anaphase (white arrow), and furrow ingression is accelerated (yellow arrows). Moreover, cytokinesis also occurs outside the equator (white arrow), producing an anuclear fragment of cytoplasm (asterisk). Bar, 10 μm. (D) Average duration of cytokinesis in control cells or cells depleted of α-actinin. Duration of cytokinesis is ~400 sec in cells microinjected with siRNA-1 (n = 11) and siRNA-2 (n = 7) that showed accelerated cytokinesis, while it is 700~800 sec in non-injected cells (n = 35) and cells microinjected with scrambled siRNA (n = 17). Bars represent mean values.
Next, we used the RNA interference technique (RNAi) to deplete α-actinin globally from the cell. Cells microinjected with either of two different siRNAs directed against α-actinin (siRNA-1 and 2) showed ~70% reduction of α-actinin level, while those injected with a scrambled siRNA showed normal α-actinin distribution and level (Figures S4A and S4B).
Global depletion of α-actinin caused severe defects in the integrity of the cortical actin network during cell division. In about 40% of cells depleted of α-actinin, equatorial cortex suddenly and quickly collapsed (Table 1; Figure 5C and supplemental video 5). In addition, in some cells, an abnormal midbody was formed, and the formation of interphase morphology was delayed. The average duration of cytokinesis in cells depleted of α-actinin that showed rapid furrow ingression was around 400 seconds, as compared to 700–800 seconds in control noninjected cells and cells microinjected with scrambled siRNA (Figure 5D). As rapid furrow ingression was concomitant with collapse of the equatorial cortex, we frequently failed to observe the formation of the midbody, which was used as an indication of cytokinesis completion in control cells. Thus, the duration of cytokinesis in the α-actinin-depleted cells that showed rapid furrowing likely represented a slight overestimate as it was measured from the initiation of cytokinesis to the clear formation of two daughter cells.
Table I. Summary of the phenotype observed in cells depleted of α-actinin.
NRK cells microinjected with scrambled siRNA, either of two different siRNAs against α-actinin, or the indicated siRNA and empty GFP vector or α-actinin-GFP were monitored by time-lapse phase optics. Percentages of cells that showed each phenotype were calculated from averages of at least three separate experiments.
| Cells | Normal cytokinesis (%) | Abnormal cytokinesis (%) | ||
|---|---|---|---|---|
| Accelerated cytokinesis | Ectopic furrowing | |||
| Total | Before anaphase onset | |||
| Non-injected (n = 40) | 100.0 (n = 40) | - | - | - |
| Scrambled siRNA (n = 19) | 100.0 (n = 19) | - | - | - |
| siRNA(1) (n = 28) | 50.0 (n = 14) | 39.3 (n = 11) | 17.9 (n = 5) | 10.7 (n = 2) |
| siRNA(2) (n = 19) | 52.6 (n = 10) | 36.8 (n = 7) | 36.8 (n = 7) | 10.5 (n = 2) |
| GFP + siRNA(1) (n = 13) | 53.9 (n = 7) | 38.5 (n = 5) | 23.1 (n = 3) | - |
| α-actinin-GFP + siRNA(1) (n = 12) | 91.7 (n = 11) | 8.3 (n = 1) | - | - |
Surprisingly, we occasionally observed precocious cortical ingression before anaphase onset in about 10% of cells depleted of α-actinin (Table 1), although chromosome congression and separation was normal (Figure 5C and supplemental video 5). Moreover, in some α-actinin-depleted cells, furrow ingression occurred both along and outside the equator after chromosome separation, producing anuclear cell fragments (Figure 5C). Such accelerated cytokinesis and ectopic furrowing were not observed in cells microinjected with scrambled siRNA (Table 1 and supplemental video 4). These results suggest that α-actinin is required for the regulation of furrow ingression along the equator and for the prevention of ectopic furrowing during cell division.
Co-injection of siRNA against α-actinin with theα-actinin-GFP expression vector allowed normal cytokinesis in more than 90% of the cells, while injection with a mixture of siRNA against α-actinin and the GFP expression vector caused accelerated cytokinesis and/or ectopic furrowing in almost 50% of the cells (Table 1). These results confirmed 1) that cytokinetic defects observed in cells microinjected with siRNA against α-actinin were due to the depletion of α-actinin and 2) that α-actinin-GFP is functional in vivo.
As α-actinin is implicated in maintaining cell-cell contacts (Otey and Carpen, 2004), depletion of α-actinin may weaken cell-cell contacts, which may in turn induce accelerated cytokinesis and/or ectopic furrowing. However, we found that isolated cells depleted of α-actinin also had ectopic furrowing and accelerated cytokinesis (Figure S5), which argued against an induced effect of disrupted cell-cell contacts.
We next examined the effects of depletion of α-actinin on actin filament organization. A reduced density of actin filaments was detected throughout the cortex of cells depleted of α-actinin compared to control cells (Figure 6A), and the total level of actin filaments also decreased slightly (Figure 6B). In contrast, depletion of α-actinin had no effect on either the organization (Figure 6C) or total amount of myosin II (Figure 6D), suggesting that cross-linking of actin filaments by α-actinin did not directly regulate myosin II.
Figure 6. Depletion of α-actinin causes a decrease in the density of actin filaments throughout the cortex with no effect on myosin II.

(A) NRK cells microinjected with or without siRNA against α-actinin diluted in fluorescent dextran (green) were fixed and stained with rhodamine-phalloidin (red) and antibodies against α-actinin (blue). 3D reconstructed images of actin filaments are shown. Bar, 10 μm. (B) Quantification of actin filaments fluorescence intensity at both the equatorial and the polar regions of cells depleted of α-actinin (n = 9) compared with control cells (n = 13). Bars = mean ± SEM. *P < 0.05, **P < 0.0001. (C) NRK cells microinjected with or without siRNA against α-actinin diluted in fluorescent dextran (green) were fixed and stained with antibodies against myosin II (red). 3D reconstructed images are presented. Bar, 10 μm. (D) Quantification of myosin II fluorescence intensity at both the equatorial and polar regions of cells depleted of α-actinin (n = 7) compared with control cells (n = 15). Bars = mean ± SEM. (E) NRK cells microinjected with or without siRNA treated with blebbistatin. Bar, 10 μm. (F) FRAP analysis of α-actinin-GFP during cytokinesis of cells treated with blebbistatin. NRK cells expressing α-actinin-GFP were treated with blebbistatin (n = 10) or DMSO (n = 16) and bleached at the equatorial region. Bars = mean ± SEM. *P < 0.0001.
As myosin II is essential for cytokinesis, we examined if accelerated cytokinesis and/or ectopic furrowing induced by depletion of α-actinin require myosin II activity. Blebbistatin, a known inhibitor for myosin II (Straight et al, 2003), was applied to cells microinjected with siRNA against α-actinin. While DMSO treatment had no effects on accelerated cytokinesis and ectopic furrowing in cells depleted of α-actinin (data not shown), no furrows were detected in cells depleted of α-actinin and treated with blebbistatin (n = 23; Figure 6E) even after cells entered late anaphase (compare with the cells in Figures 6A and 6C). Thus, as for normal furrows, myosin II activity is required for accelerated cytokinesis and ectopic furrowing. To further analyze the relationship between α-actinin and myosin II, we tested if myosin II affects α-actinin turnover by FRAP analysis of α-actinin-GFP in cells treated with blebbistatin (Figures 6F, and Figures S1C and S6). α-actinin-GFP recovers from photobleaching more slowly in cells treated with blebbistatin (t1/2 = 29.5 ± 4.5 s) than in control cells treated with DMSO (t1/2 = 9.2 ± 0.9 s), showing that myosin II influences the dynamics of α-actinin.
Discussion
Functions of α-actinin along and outside the equator
Depletion of α-actinin induced ectopic furrowing even before anaphase onset (Figure 5), suggesting that inward forces are present not only along the equator (Rappaport, 1967), but on the entire cortex from the early stage of mitosis and that furrow ingression requires remodeling rather than accumulation of actin filaments. This argues against the simplest version of the contractile ring hypothesis (Schroeder, 1968; Satterwhite and Pollard, 1992; Wang, 2005), and suggests that cross-linking of actin filaments by α-actinin is required to resist global inward forces, possibly increasing cortical rigidity, outside the equator or before the onset of cytokinesis.
Overexpression of α-actinin slowed down cortical ingression, while deactivation or depletion of α-actinin induced rapid furrow ingression, suggesting that α-actinin at the equator regulates furrow ingression speed after cytokinesis initiates. Although we cannot rule out the possibility that precocious formation of focal adhesions suppressed furrow ingression in cells overexpressing α-actinin, inhibition of actin disassembly and actomyosin-based cortical contraction is most likely responsible for the delay in ingression. In addition, disruption of cell-cell or cell-substrate contacts cannot easily explain the precocious ingression caused by the depletion of α-actinin. Finally, the local inactivation experiment supports a direct role of α-actinin at the furrow.
Comparison of the function of α-actinin in cytokinesis between fission yeast and mammalian cells
The α-actinin-like protein Ain1p has been implicated in cytokinesis of fission yeasts (Wu et al, 2001). Overexpression of Ain1p caused mispositioned and/or disorganized actin rings, while deletion of the Ain1 gene caused formation of an abnormal, thin actin ring under certain stress conditions, suggesting that Ain1p is involved in the formation of equatorial actin ring. Ain1p has only two spectrin-like domains instead of four in mammalian cells. Hence, Ain1p may form actin bundles instead of a network caused by conventional α-actinin, which is possibly responsible for the tightly packed actin ring in yeast (Wu et al, 2001). In contrast to the short length of Ain1p, conventional α-actinin may cross-link actin filaments loosely at the equator where an apparent ring structure is hardly detected during cytokinesis of mammalian cells under some conditions (Fishkind and Wang, 1993).
The number of multinucleated yeast cells increased not only upon overexpression of the Ain1p protein but also in ain1 deletion mutants (Wu et al, 2001), suggesting that Ain1p helps proper formation of the actin ring rather than remodeling of actin filaments. This differs from our results in mammalian cells where furrow ingression speeds up and even ectopic furrows are formed by loss of α-actinin. Thus, although the cytokinetic components are well conserved between fission yeast and mammalian cells, the regulation of furrow ingression likely depends on the organization of the contractile ring.
Regulation of the cortical actin network by α-actinin during cytokinesis
How does α-actinin regulate the change of cell shape (i.e. furrow ingression) along the equator? A previous report demonstrated that, at high rates of deformation, the actin network cross-linked by α-actinin is stiffer than actin filaments alone, whereas at low rates of deformation, there is no effect on the mechanical properties of the cross-linked actin network (Sato et al, 1987). Assuming that α-actinin forms dynamic cross-links between actin filaments, the actin network may deform easily under a slowly provided force as seen in cytokinesis of animal cells (Rappaport, 1967). In addition, an important function of α-actinin may be to suppress rapid, random shape changes due to local fluctuations in motor activities.
A separate study showed that increasing the concentration of α-actinin relative to actin causes stiffening of the actin gel and makes the gel more solid-like regardless of the deformation rate (Tseng and Wirtz, 2001). Conversely, decreases in α-actinin causes the gel to become more liquid-like. This may explain the inhibition of ingression upon overexpression of α-actinin, and the poorly regulated ingression upon depletion of α-actinin. The behavior of the cortical gel is likely also affected by myosin II forces, which may rupture the association between actin and α-actinin and cause “strain softening” (Heidemann and Wirtz, 2004). Therefore, under normal conditions, accumulation of α-actinin at the equator likely causes an increase in viscoelasticity of the isotropic actin network before furrow initiation. However, subsequent increases in myosin-driven forces may promote not only contraction but also release of α-actinin from the equator, causing a decrease in cortical viscoelasticity and rearrangement of the cross-linked actin network, which leads to change the cell shape (i.e. ingression of the furrow).
Our observations elucidate the regulation of furrow ingression by α-actinin. The overall regulating mechanism of cytokinesis, however, is likely more complex. The effects of actin associated proteins on the mechanical properties of the actin network during cytokinesis have been studied in Dictyostelium (Reichl et al, 2005). In Dictyostelium, furrow contractility is multiphasic, and both the global and the equatorial actin network, regulated differentially by various actin cross-linkers, myosin II and a small GTPase, have distinct and important roles in furrow ingression (Girard et al, 2004; Zhang and Robinson, 2005; Octtaviani et al, 2006). Compared with Dictyostelium, mammalian cell lines such as NRK cells do not undergo as dramatic a change in morphology during cytokinesis. In addition, these cells do not form a cylinder-shaped cleavage furrow as Dictyostelium does (Zhang and Robinson, 2005). Therefore, the mechanism for the regulation of furrow ingression in mammalian cells may be different from that of Dictyostelium. However, as many other proteins are involved in cytokinesis of mammalian cells, it is important to elucidate how they function and interact spatio-temporally in order to regulate furrow ingression during cytokinesis.
Experimental Procedures
Cell culture, microscopy, and image processing
NRK cells (NRK-52E; ATCC) were maintained in Kaighn’s modified F12 (F12K) medium with 1 mM L-glutamine (Sigma-Aldrich) supplemented with 10% FBS (BioWest), 100 U/ml penicillin, and 100 μg/ml streptomycin. Cells were grown on glass chamber dishes as previously described (McKenna and Wang, 1989). For live-cell imaging, the cells were maintained at 37°C in a custom made incubator built on top of an Axiovert 200 M inverted microscope (Carl Zeiss) and viewed with a 100×, NA1.30, Plan-NEOFLUAR lens. All images were acquired with a cooled charge-coupled device camera (CoolSNAPHQ, Roper Scientific) and processed with MetaView imaging software (Universal Imaging). Immunofluorescence staining was analyzed using a LSM 510 Meta confocal microscope system (100×, NA 1.25 Achroplan lens, 100×, NA 1.4 Plan-Apochromat lens or 63×, NA 1.4 Plan Apochromat lens; Carl Zeiss).
Plasmids
α-actinin-GFP (α-actinin-4-GFP; Gonzalez et al, 2001) was a generous gift from Dr. Carol Otey (University of North Carolina, USA). GFP-actin and empty pEGFP vectors were from BD Biosciences Clontech, while pmax GFP was obtained from Amaxa. α-actinin-CherryFP was constructed using α-actinin-GFP by replacing a DNA fragment encoding GFP with that encoding CherryFP. The actin binding domain (ABD) of α-actinin (encoding amino acids 28–292) was amplified by PCR using α-actinin-GFP as a template and subcloned into pEGFP-N1.
Transfection and RNA interference
NRK cells grown on glass chamber dishes were transiently transfected with 1.6 μg of plasmids by using Superfect reagent (QIAGEN) according to manufacturer's instruction. After 2 h of incubation, the medium containing the DNA-Superfect complex was replaced with F12K medium containing 10% FBS, and the cells were incubated for an additional 48 h. Alternatively, cells were transfected with 0.3 μg of the plasmids using Effectene reagent diluted in F12K medium containing 1% FBS for 8–12 h. The DNA-Effectene complex was replaced with the F12K medium containing 10% FBS, and the cells were cultured for an additional 24–48 h.
Two different Silencer™ Pre-designed siRNA duplexes against rat α-actinin-4 and a Silencer™ Negative Control #1 siRNA duplex were purchased from Ambion. Each siRNA was diluted to the final concentration of 500 nM in HEK buffer (20 mM HEPES, 10 mM KCl, pH 7.7) with 5 mg/ml lysine fixable 70, 000 MW fluorescein dextran (Molecular Probes) and then microinjected into the cells using custom drawn glass needles and FemtoJet pressure control system (Eppendorf). The cells microinjected with each siRNA were cultured for 72 h. For rescue experiments, cells were microinjected with siRNA (500 nM) together with 300 μg/ml of either empty GFP vector or α-actinin-GFP and cultured for 72 h.
Fluorescence recovery after photobleaching (FRAP)
NRK cells were transiently transfected with α-actinin-GFP, GFP-actin or both GFP-actin and α-actinin-CherryFP using Effectene transfection reagent as described above. FRAP was performed using a Zeiss Meta 510 confocal microscope, with a 100×, NA 1.25 Achroplan objective. Bleaching of the marked region was carried out at 100% laser power with 150 iterations. Time-lapse images were acquired at every 6 sec interval. Fluorescence recovery was analyzed using MetaView.
Chromophore-assisted laser inactivation (CALI)
NRK cells were transiently transfected with α-actinin-GFP or pmax GFP plasmid using Effectene transfection reagent as described above. Cells expressing α-actinin-GFP at low level were selected for CALI. Cells were irradiated for 200 msec with a focused beam from a Lexel Model 94 argon ion laser (488 nm, 500 mW of power at the laser head), using a 100×, numerical aperture 1.30 Plan Neofluar lens, mounted on a Zeiss Axiovert Inverted microscope. The laser beam was first applied after anaphase onset but before initiation of ingression to one side of the equator. As ingression progressed, the same region was irradiated for an additional 3–4 times. Fluorescence and phase-contrast images were acquired with a cooled charge-coupled device camera (ST133 controller and CCD57 chip; Roper Scientific) and processed with custom software for background subtraction.
Immunofluorescence
Cells were briefly rinsed with warm PBS and fixed with 4% paraformaldehyde (EM Sciences) in warm PBS for 10 min. They were then rinsed thoroughly in PBS and permeabilized by incubation with 0.2% Triton X-100 for 5 min. Fixed cells were rinsed with PBS, blocked for 30 min with 3% BSA (Boehringer Mannheim) in PBS (PBS/BSA), and then incubated with primary antibodies diluted in PBS/BSA for 1 h at 37°C. Primary antibodies were diluted as follows: 1:200 anti-α-actinin rabbit antibody (ImmunoGlobe), 1:100 anti-vinculin monoclonal antibody (Upstate), and 1:500 anti-myosin II (A+B) rabbit antibodies. After three 10 min rinses with PBS/BSA, cells were incubated with goat anti-mouse (vinculin) or anti-rabbit (α-actinin and myosin) antibodies conjugated with Alexa Fluor-488, Alexa Fluor-546 or Alexa Fluor-647 (Molecular Probes) at a dilution of 1:300.
To observe actin filaments, fixed cells were stained with rhodamine-phalloidin (Molecular Probes) at a dilution of 1:300 for 1 h at 37°C.
To locate the chromosomes, cells were incubated with 10 μg/ml Hoechst 33258 (Sigma-Aldrich) for 10 min at room temperature.
Quantification of fluorescence signals
Expression level of α-actinin-GFP was estimated by quantitative immunofluorescence. To analyze α-actinin-GFP dynamics during cytokinesis (Figure 1B), fluorescence intensity of α-actinin-GFP in the entire region of the cleavage furrow, in the polar region with the same width as the cleavage furrow and in the whole cell was measured.
Fluorescence intensity of actin filaments, myosin II and vinculin along the equator or near the polar cortex was measured at 2 different regions (3 μm x 3 μm square for F-actin, myosin II and vinculin). Graphs representing the quantification of fluorescence intensity (Figures 3B, 3D, 4B, 6B and 6D) show the ratio of average fluorescence intensity at the indicated region over mean fluorescence intensity of whole control cells.
Drug treatment
S-(−) isomer of blebbistatin (Toronto Research) was dissolved at 100 mM in 90% DMSO. Cells were incubated with blebbistatin at the final concentration of 100 μM or 0.45% DMSO for 45–90 min prior to FRAP analyses or fixation.
Measurement of relative cell rigidity
Cell rigidity was measured using glass needles with a method modified from that of Maddox and Burridge (2003). Briefly, a thin glass needle was brought to the side of a prometaphase/metaphase cell overexpressing GFP or α-actinin-GFP. The needle was moved toward the center of the cell in 5 μm increments using a custom-made micromanipulator and the position of the tip was measured at each increment from the images. The deformation of the needle, calculated as the difference between needle position and tip position, was then plotted against the deformation of the cell (position of the tip), and the spring constant was determined from the slope as an indicator of cell rigidity. The same needle was used for control cells overexpressing GFP and cells overexpressing α-actinin-GFP and 5–10 cells were analyzed in each experiment. Three independent experiments were performed.
Supplementary Material
Acknowledgments
We would like to thank Dr. Carol Otey (Univ. North Carolina, USA) for her kind gift of α-actinin-GFP expression vector and Dr. Masayuki Takahashi (Hokkaido Univ., Japan) for anti-myosin IIA and IIB antibodies. We also thank Adrian Ng and Shyan Huey Low for technical assistance and Drs. Pernille Rørth, William Chia, Mohan Balasubramanian, Snezhana Oliferenko, Volker Wachtler and all lab members of the Murata-Hori laboratory for discussions and/or critical reading of the manuscript. This study was supported by intramural funds from the Temasek Life Sciences Laboratory to M. M.-H., and by NIH grant GM-32476 to Y.-L. W.
Footnotes
Publisher's Disclaimer: This is a PDF file of an unedited manuscript that has been accepted for publication. As a service to our customers we are providing this early version of the manuscript. The manuscript will undergo copyediting, typesetting, and review of the resulting proof before it is published in its final citable form. Please note that during the production process errors may be discovered which could affect the content, and all legal disclaimers that apply to the journal pertain.
References
- Burton K, Taylor DL. Traction forces of cytokinesis measured with optically modified elastic substrata. Nature. 1997;385:450–454. doi: 10.1038/385450a0. [DOI] [PubMed] [Google Scholar]
- Djinovic-Cargo K, Young P, Gautel M, Saraste M. Molecular basis for cross-linking of actin filaments: Structure of the α-actinin rod. Cell. 1999;98:537–546. doi: 10.1016/s0092-8674(00)81981-9. [DOI] [PubMed] [Google Scholar]
- Fishkind DJ, Wang Y-L. Orientation and three-dimensinal organization of actin filaments in dividing cultured cells. J Cell Biol. 1993;123:837–848. doi: 10.1083/jcb.123.4.837. [DOI] [PMC free article] [PubMed] [Google Scholar]
- Fraley TS, Pereira CB, Tran TC, Singleton CA, Greenwood JA. Phosphoinositide binding regulates α-actinin dynamics. J Biol Chem. 2005;280:15479–15482. doi: 10.1074/jbc.M500631200. [DOI] [PubMed] [Google Scholar]
- Fujiwara K, Pollard TD. Fluorescent antibody localization of myosin in the cytoplasm, cleavage furrow, and mitotic spindle of human cells. J Cell Biol. 1976;71:848–875. doi: 10.1083/jcb.71.3.848. [DOI] [PMC free article] [PubMed] [Google Scholar]
- Fujiwara K, Porter ME, Pollard TD. Alpha-actinin localization in the cleavage furrow during cytokinesis. J Cell Biol. 1978;79:268–275. doi: 10.1083/jcb.79.1.268. [DOI] [PMC free article] [PubMed] [Google Scholar]
- Girard KD, Chaney C, Delannoy M, Kuo SC, Robinson DN. Dynacortin contributes to cortical viscoelasticity and helps define the shape changes of cytokinesis. EMBO J. 2004;23:1536–1546. doi: 10.1038/sj.emboj.7600167. [DOI] [PMC free article] [PubMed] [Google Scholar]
- Glotzer M. Cleavage furrow positioning. J Cell Biol. 2004;164:347–351. doi: 10.1083/jcb.200310112. [DOI] [PMC free article] [PubMed] [Google Scholar]
- Gonzalez AM, Otey C, Edlund M, Jones CR. Interactions of a hemidesmosome component and actinin family members. J Cell Sci. 2001;114:4197–4206. doi: 10.1242/jcs.114.23.4197. [DOI] [PubMed] [Google Scholar]
- Guha M, Zhou M, Wang Y-L. Cortical actin turnover during cytokinesis requires myosin II. Curr Biol. 2005;15:732–736. doi: 10.1016/j.cub.2005.03.042. [DOI] [PubMed] [Google Scholar]
- Gunsalus KC, Bonaccorti SE, Williams Verni F, Gatti M, Goldberg ML. Mutations in twinstar, a Drosophila gene encoding a cofilin/ADF homologue, result in defects in centrosome migration and cytokinesis. J Cell Biol. 1995;131:1243–1259. doi: 10.1083/jcb.131.5.1243. [DOI] [PMC free article] [PubMed] [Google Scholar]
- Heidemann SR, Wirtz D. Towards a regional approach to cell mechanics. Trends Cell Biol. 2004;14:160–166. doi: 10.1016/j.tcb.2004.02.003. [DOI] [PubMed] [Google Scholar]
- Hotulainen P, Paunola E, Vartiainen MK, Lappalainen P. Actin-depolymerizing factor and cofilin-1 play overlapping roles in promoting rapid F-actin depolymerization in mammalian nonmuscle cells. Mol Biol Cell. 2005;16:649–664. doi: 10.1091/mbc.E04-07-0555. [DOI] [PMC free article] [PubMed] [Google Scholar]
- Hotulanien P, Lappalainen P. Stress fibres are genereated by two distinct actin assembly mechanisms in motile cells. J Cell Biol. 2006;173:383–394. doi: 10.1083/jcb.200511093. [DOI] [PMC free article] [PubMed] [Google Scholar]
- Janson LW, Sellers JR, Taylor DL. Actin-binding proteins regulate the work performed by myosin II motors on single actin filaments. Cell Motil Cytoskeleton. 1992;122:274–280. doi: 10.1002/cm.970220407. [DOI] [PubMed] [Google Scholar]
- Mabuchi I, Hamaguchi Y, Kobayashi T, Hosoya H, Tsukita S, Tsukita S. Alpha-actinin from sea urchin eggs: Biochemical properties, interaction with actin, and distribution in the cell during fertilization and cleavage. J Cell Biol. 1985;100:375–383. doi: 10.1083/jcb.100.2.375. [DOI] [PMC free article] [PubMed] [Google Scholar]
- Maciver SK, Wachsstock DH, Schwarz WH, Pollard TD. The actin filament severing protein actophorin promotes the formation of rigid bundles of actin filaments crosslinked with α-actinin. J Cell Biol. 1991;115:1621–1628. doi: 10.1083/jcb.115.6.1621. [DOI] [PMC free article] [PubMed] [Google Scholar]
- Maddox AS, Burridge K. RhoA is required for cortical retraction and rigidity during mitotic cell rounding. J Cell Biol. 2003;160:255–265. doi: 10.1083/jcb.200207130. [DOI] [PMC free article] [PubMed] [Google Scholar]
- Maddox AS, Oegema K. Deconstructing cytokinesis. Nat Cell Biol. 2003;5:773–776. doi: 10.1038/ncb0903-773b. [DOI] [PubMed] [Google Scholar]
- Maupin P, Pollard TD. Arrangement of actin filaments and myosin-like filaments in the contractile ring and of actin-like filaments in the mitotic spindle of dividing HeLa cells. J Ultrastruct Mol Struct Res. 1986;94:92–103. doi: 10.1016/0889-1605(86)90055-8. [DOI] [PubMed] [Google Scholar]
- McKenna NM, Wang Y-L. Culturing cells on the microscope stage. Methods Cell Biol. 1989;29:195–205. doi: 10.1016/s0091-679x(08)60195-8. [DOI] [PubMed] [Google Scholar]
- Murthy K, Wadsworth P. Myosin-II-dependent localization and dynamics of F-actin during cytokinesis. Curr Biol. 2005;15:724–731. doi: 10.1016/j.cub.2005.02.055. [DOI] [PubMed] [Google Scholar]
- Nakano K, Mabuchi I. Actin-depolymerizing protein Adf1 is required for formation and maintenance of the contractile ring during cytokinesis in fission yeast. Mol Biol Cell. 2006;17:1933–1945. doi: 10.1091/mbc.E05-09-0900. [DOI] [PMC free article] [PubMed] [Google Scholar]
- O’Connell C, Warner A, Wang Y-L. Distinct roles of the equatorial and polar cortices in the cleavage of adherent cells. Curr Biol. 2001;11:702–707. doi: 10.1016/s0960-9822(01)00181-6. [DOI] [PubMed] [Google Scholar]
- Octtaviani E, Effler JC, Robinson DN. Enlazin, a natural fusion of two classes of canonical cytoskeletal proteins, contributes to cytokinesis dynamics. Mol Biol Cell. 2006;17:5275–5286. doi: 10.1091/mbc.E06-08-0767. [DOI] [PMC free article] [PubMed] [Google Scholar]
- Otey CA, Carpen O. Alpha-actinin revisited: a fresh look at an old player. Cell Motil Cytoskeleton. 2004;58:104–111. doi: 10.1002/cm.20007. [DOI] [PubMed] [Google Scholar]
- Pelham RJ, Chang F. Actin dynamics in the contractile ring during cytokinesis in fission yeast. Nature. 2002;419:82–86. doi: 10.1038/nature00999. [DOI] [PubMed] [Google Scholar]
- Rajfur Z, Roy P, Otey C, Romer L, Jacobson K. Dissecting the link between stress fibres and focal adhesions by CALI with EGFP fusion proteins. Nat Cell Biol. 2002;4:286–293. doi: 10.1038/ncb772. [DOI] [PubMed] [Google Scholar]
- Rappaport R. Cell division: direct measurement of maximum tension exerted by furrow of echinoderm eggs. Science. 1967;156:1241–1243. doi: 10.1126/science.156.3779.1241. [DOI] [PubMed] [Google Scholar]
- Reichl EM, Effler JC, Robinson DN. The stress and strain of cytokinesis. Trends Cell Biol. 2005;15:200–206. doi: 10.1016/j.tcb.2005.02.004. [DOI] [PMC free article] [PubMed] [Google Scholar]
- Sanger JM, Sanger JW. Banding and polarity of actin filaments in interphase and cleaving cells. J Cell Biol. 1980;86:568–575. doi: 10.1083/jcb.86.2.568. [DOI] [PMC free article] [PubMed] [Google Scholar]
- Sanger JM, Mittal B, Pochapin MB, Sanger JW. Stress fiber and cleavage furrow formation in living cells microinjected with fluorescently labeled alpha-actinin. Cell Motil Cytosceleton. 1987;7:209–220. doi: 10.1002/cm.970070304. [DOI] [PubMed] [Google Scholar]
- Sato M, Schwarz WH, Pollard TD. Dependence of the mechanical properties of actin/α-actinin gels on deformation rate. Nature. 1987;325:828–830. doi: 10.1038/325828a0. [DOI] [PubMed] [Google Scholar]
- Satterwhite LL, Pollard TD. Cytokinesis. Curr Opin Cell Biol. 1992;4:43–52. doi: 10.1016/0955-0674(92)90057-j. [DOI] [PubMed] [Google Scholar]
- Schroeder TE. Cytokinesis: Filaments in the cleavage furrow. Exp Cell Res. 1968;53:272–276. doi: 10.1016/0014-4827(68)90373-x. [DOI] [PubMed] [Google Scholar]
- Somma MP, Fasulo B, Cenci G, Cundari E, Gatti M. Molecular dissection of cytokinesis by RNA interference in Drosophila cultured cells. Mol Cell Biol. 2002;13:2448–2460. doi: 10.1091/mbc.01-12-0589. [DOI] [PMC free article] [PubMed] [Google Scholar]
- Straight AF, Cheung A, Limouze J, Chen I, Westwood NJ, Sellers JR, Mitchison TJ. Dissecting temporal and spatial control of cytokinesis with a myosin II inhibitor. Science. 2003;299:1743–1747. doi: 10.1126/science.1081412. [DOI] [PubMed] [Google Scholar]
- Suzuki A, Goll DE, Singh I, Allen RE, Robson RM, Stromer MH. Some properties of purified skeletal muscle α-actinin. J Biol Chem. 1976;251:6860–6870. [PubMed] [Google Scholar]
- Tseng Y, Wirtz D. Mechanics and multiple-particle tracking microheterogeneity of alpha-actinin-cross-linked actin filament networks. Biophys J. 2001;81:1643–1656. doi: 10.1016/S0006-3495(01)75818-3. [DOI] [PMC free article] [PubMed] [Google Scholar]
- Wang Y-L. The mechanism of cortical ingression during early cytokinesis: thinking beyond the contractile ring hypothesis. Trends Cell Biol. 2005;15:581–588. doi: 10.1016/j.tcb.2005.09.006. [DOI] [PubMed] [Google Scholar]
- Wu JQ, Bahler J, Pringle JR. Roles of a fimbrin and an alpha-actinin-like protein in fission yeast cell polarization and cytokinesis. Mol Biol Cell. 2001;12:1061–1077. doi: 10.1091/mbc.12.4.1061. [DOI] [PMC free article] [PubMed] [Google Scholar]
- Ylanne J, Scheffzek K, Young P, Saraste M. Crystal structure of the α-actinin rod reveals an extensive torsional twist. Structure. 2001;9:597–604. doi: 10.1016/s0969-2126(01)00619-0. [DOI] [PubMed] [Google Scholar]
- Zhang W, Robinson DN. Balance of actively generated contractile and resistive forces controls cytokinesis dynamics. Proc Natl Acad Sci USA. 2005;102:7186–7191. doi: 10.1073/pnas.0502545102. [DOI] [PMC free article] [PubMed] [Google Scholar]
Associated Data
This section collects any data citations, data availability statements, or supplementary materials included in this article.