

Abstract
Functionally graded coatings (FGCs) of bioactive glass on titanium alloy (Ti6Al4V) were fabricated by the enameling technique. These innovative coatings may be an alternative to plasma-sprayed, hydroxyapatite-coated implants. Previously we determined that a preconditioning treatment in simulated body fluid (SBF) helped to stabilize FGCs (Foppiano, S., et al., Acta Biomater, 2006; 2(2):133-42). The primary goal of this work was to assess the in vitro cytocompatibility of preconditioned FGCs with MC3T3-E1.4 mouse pre-osteoblastic cells. We evaluated cell adhesion, proliferation and mineralization on FGCs in comparison to uncoated Ti6Al4V and tissue culture polystyrene (TCPS). No difference in cell adhesion was identified, whereas proliferation was significantly different on all materials, being highest on FGCs followed by TCPS and Ti6Al4V. Qualitative and quantitative mineralization assays indicated that mineralization occurred on all materials. The amount of inorganic phosphate released by the mineralizing layers was significantly different, being highest on TCPS, followed by FGC and uncoated Ti6Al4V. The secondary objective of this work was to assess the ability of the FGCs to affect gene expression, indirectly, by means of their dissolution products, which was assessed by real-time reverse-transcription polymerase chain reaction. The FGC dissolution products induced a 2-fold increase in the expression of Runx-2, and a 20% decrease in the expression of collagen type 1 with respect to TCPS extract. These genes are regulators of osteoblast differentiation and mineralization, respectively. The findings of this study indicate that preconditioned FGCs are cytocompatible and suggest that future work may allow composition changes to induce preferred gene expression.
Keywords: Cell adhesion, cell proliferation, cell differentiation, cytocompatibility
Introduction
An enameling technique, combined with a functionally graded approach, has been used to produce bioactive glass coatings on titanium alloy (Ti6Al4V) that resist delamination [1, 2]. The glass compositions were tailored to provide a loose match in the coefficient of thermal expansion with titanium and layered to obtain a bioactive surface. Specifically, the glass in contact with Ti6Al4V contained 61 wt% Si, and small amounts of Mg and K oxides to provide an adequate match in coefficient of thermal expansion (CTE) with the alloy. The second layer of the coating was a bioactive glass containing 55 wt% Si [1]. Such a combination allows the formation of a coating reliably adhering to Ti6Al4V, as also confers surface bioactivity. The resulting biomaterial is capable of withstanding loads which cannot otherwise be obtained by a single bioactive glass coating [1] or by bioactive glass in bulk [3]. Our previous work [4], in agreement with others [5–7], indicated that the glass silica network of the coatings could be undermined unless the coatings were pretreated in simulated body fluid (SBF). The preconditioning treatment transformed the coatings’ surfaces into a crystalline apatite-like form [1]. Thus, preconditioning prior to implantation is strongly recommended.
The mechanisms by which bioactive glasses, and their coatings, affect osteoblast behavior and metabolism are unclear. There is evidence indicating that bioactive glasses can control gene transcription through glass dissolution products [8–12]. The present work had two objectives: (i) to assess the in vitro biocompatibility of functionally graded bioactive glass coatings (FGCs) after preconditioning treatment; and (ii) to test the hypothesis that FGCs thus treated can affect the expression of genes involved in the early stages of osteogenesis by means of their dissolution products. To pursue our objectives, cell adhesion, proliferation and mineralization were assessed using the mineralizing subclone of the mouse pre-osteoblastic cell line MC3T3-E1: MC3T3-E1.4 [10]. FGCs were preconditioned in SBF to provide a stable surface. Titanium alloy (Ti6Al4V) and tissue culture polystyrene (TCPS), preconditioned in the same way, served as controls. In the second part of this study we prepared material extracts to uncouple the effect of the surface roughness of the material from the effect of the dissolution products on gene expression. Runx-2, α2 chain of collagen type I (Col 1) and alkaline phosphatase were measured by quantitative real-time reverse-transcription polymerase chain reaction (real-time RT-PCR).
Materials and Methods
Sample preparation
To fabricate FGCs, two bioactive glasses were prepared by mixing the reagents in propanol using a high-speed stirrer as previously described [1]. The P2O5 content was 6 wt.% for both glasses, designated 6P followed by their SiO2 content in weight percent (Table 1). The reagents were SiO2 (99.5% Cerac Inc., Milwaukee, WI), CaCO3 (99.9%, J.T. Baker, Phillipsburg, NJ), MgO (98.6%, J.T. Baker), K2CO3 (99.4%, Mallinkrodt, Paris, KY), NaHCO3 (99.5%, J.T. Baker), and Na2HPO4 (99%, Sigma, St Louis, MO). The mixture was dried and then fired in air in a platinum crucible for 5 h at 1400°C (glass 6P55) and 1450°C (glass 6P61). Functionally graded glass enameled coatings were prepared as previously described [1]. Glasses 6P61 and 6P55 were separately milled in a planetary agate mill. 6P61 glass powder (particle size < 37 μm) was suspended in 100% ethanol and deposited on polished (1 μm diamond suspension (Buehler, Ltd., Lake Bluff, IL)) Ti6Al4V squares (1.5 × 1.5 × 0.1 cm) (Ti6Al4V Goodfellow Ltd., Huntingdon, UK). Glass particles were allowed to settle and the process was carefully repeated using glass 6P55, without disturbing the first powder layer. The green coatings were dried in air at 80°C for 48 h and then fired in air in a dental furnace (Unitek Ultra Mat II, 3M, Maplewood, MN). The furnace was preheated at 640°C, and the firing temperature of 800°C was reached at a rate of 40 °C min−1 while evacuating the furnace to 0.1 atm. At 800°C air was let into the firing chamber, samples were fired for 10 s in air at 1 atm and quenched. Ti6Al4V of the same size and polished to 1 μm served as control together with TCPS (the bottom of the wells). Samples were cleaned by sonication in acetone and isopropyl alcohol for 5 min each, and sterilized in dry heat at 250°C. Sterile samples were placed in 12-well tissue culture plates under sterile conditions.
Table 1.
Glass compositions in weight percent
| SiO2 | Na2O | K2O | CaO | MgO | P2O5 | |
|---|---|---|---|---|---|---|
| 6P61 | 61.1 | 10.3 | 2.8 | 12.6 | 8.9 | 6.0 |
| 6P55 | 54.5 | 12.0 | 4.0 | 15.0 | 8.5 | 6.0 |
SBF preconditioning
Samples and controls were preconditioned in 4 ml of filter-sterilized SBF (0.22 μm filter, GE Osmonics, Inc., Minnetoka, MN) (Table 2). Preconditioning lasted for 2 weeks at 37°C, changing the solution after 1 week. Specimens were rinsed with phosphate-buffered saline (PBS) prior to cell seeding. Experiments were performed in triplicate with n = 3 for each material in each experiment.
Table 2.
Ion concentration of SBF (mM)
| Ion concentration (mM) | |||||||
|---|---|---|---|---|---|---|---|
| Na+ | K+ | Ca2+ | Mg2+ | Cl− | HCO3− | HPO42− | |
| SBF | 142 | 5 | 2.05 | 1.5 | 148 | 4.2 | 1 |
Cell culture
MC3T3-E1.4 mouse osteoblast-like cells were grown in an incubator at 37°C and 5% CO2 atmosphere, in α-modified Eagle’s medium (α-MEM) supplemented with 10% fetal calf serum (FCS) and 1% antibiotics (penicillin and streptomycin) (full medium) and passaged every 4–5 days. In all experiments cells were plated at an initial density of 50,000 cells cm−2 [2].
Cell adhesion
Cells were seeded in 30 μl aliquots on the center of sample and control materials. After 10 min the wells were gently flooded with the medium (1 ml well−1). A concentration of 1 ml medium per well was consistently used throughout the experiments. Three hours after flooding, the supernatant containing non-adhering cells was removed, and replaced with fresh medium. The number of adhering cells was assayed using a commercial kit (CellTiter 96® Promega Corp., Madison, WI), based on the metabolic activity of living cells (3-(4,5-dimethylthiazol-2-yl)-2,5-diphenyl tetrazolium bromide) (MTT) assay). The MTT solution added to each well was incubated for 4 h at 37°C. After the formation of the crystal formazan product the square samples (FGC and Ti6Al4V) were transferred to new tissue culture plates. This way only the crystals formed on the samples were dissolved. To dissolve the formazan product, solutions were added according to the manufacturer’s protocol, keeping volume of solution to sample surface area ratio constant at 2 μl mm−2. This was done to compensate for the difference in surface available to the cells. The overnight protocol was chosen to ensure complete solubilization of the dark-blue formazan product. Optical density was measured at 570 nm in a spectrophotometer (Spectronic Genesys 5, Spectronics Instruments, Rochester, NY). A calibration curve allowed conversion of absorption to number of cells. The number of cells was then normalized to the sample surface area (cells cm−2).
Cell proliferation (cell cycle re-entry)
Cell proliferation was assayed after 5 days in culture. On day 1, cells were seeded as described above (see Cell adhesion). On day 2, cells were synchronized by serum starvation (1% FBS) for 48 h. On day 4, cells were allowed to re-enter the cell cycle (10% FBS). After 24 h the proliferating cells were assessed using the MTT assay as described above.
Mineralization
Cells were seeded as described above. Cells were treated with ascorbic acid (AA) (50 μg ml−1 medium) for 10 days and then with AA and inorganic phosphate (NaH2PO4) (10 mM) for an additional 5 days. Medium was replaced at 2 day intervals throughout the experiment. Cells were washed three times with PBS without Ca2+ or Mg2+ and then fixed for 15 min in 100% ethanol. Cell layers were stained with alizarin S solution (20 g l−1 pH 4.1–4.3, Sigma Aldrich, St Louis, MO) for 30 min, rinsed and photographed under an optical microscope (Olympus BX50, Olympus America Inc., Melville, NY) connected to a CCD camera (DVC 1300C camera RGB color, DVC Company, Austin, TX).
Quantitative measurement of inorganic phosphate
Cells were seeded and treated with AA and NaH2PO4 as described above to induce mineralization. NaH2PO4 treatment was carried out for a total of 10 days. This was done to try to increase the amount of mineral in the tissue. After 20 days in culture, cells were washed three times with PBS without Ca2+ or Mg2+ and the cell layer grown on FGCs and Ti6Al4V was gently removed from the materials with a rubber policeman and transferred to a new tissue culture plate. This was done to avoid measuring phosphate possibly released from FGCs or from the tissue grown on the tissue culture wells adjacent to the test substrates. The mineralized tissue was incubated for 48 h in 15% trichloroacetic acid (TCA). The volume of TCA added was kept constant at 2 μl mm−2 of sample surface. Fifty microliters of supernatant were then assayed. Inorganic phosphate concentration was determined by spectrophotometry (355 nm) using the method of Heinonen and Lahti [13]. The absorbance value in Klett units (KU) (1 KU = 0.005 absorbance) was converted into concentration using a calibration curve made using the same method.
Quantitative real-time RT-PCR
Cell culture
All samples and controls were preconditioned in SBF for 2 weeks as described above.
Incubation plates
Material extracts were prepared by immersing samples and materials in full media for 48 h with a volume of solution to surface area ratio of 4.5 μl mm−2. Cells were seeded in 6-well tissue culture plates as described above, and treated with materials extract and AA (50 μg ml−1 medium) every 48 h for 7 days. The incubation plates were replenished with the proper amount of full medium after each cell feeding.
RNA extraction and reverse transcription
At day 7 total RNA was extracted using the RNeasy extraction kit (Qiagen, Valencia, CA). The concentration and purity of the total RNA was determined by measuring the light absorbance at 260 nm and by calculating the A260/A280 ratio, respectively. Two-step RT-PCR was carried out in which reverse transcription was performed in a different tube than real-time PCR. Reverse transcription was conducted using the Ericomp Powerblock II System (Long Island Scientific, East Setauket, NY). The same amount of total RNA from each sample within an experiment was used in a total volume of 20 μl containing 1 μl of oligo dT primer, 4 μl first strand buffer, 2 μl of 0.1 M DTT, 1 μl of 10 mM dNTP and 100 U of SuperScript™ II RNase H− reverse transcriptase (Invitrogen, Carlsbad, CA). RT reaction was incubated at 42 °C for 60 min and terminated by heat inactivating the reverse transcriptase at 70 °C for 15 min.
Primers and probes
Primers and probes were Assays on Demand (Applied Biosystems, Foster City, CA) selected using the NCBIRefSeq sequences for glycerol-3 phosphatase dehydrogenase (Gapd) (accession no. NM_008084), α2 chain of collagen type 1 (Col 1) (accession no. NM_007743), and core binding factor 1 (Runx-2) (accession no. NM_009820). The Applied Biosystems patented fluorogenic probes incorporated reporter dye on the 5′ end and quencher dye on the 3′ end, and spanned an exon/intron boundary to avoid genomic DNA amplification.
Real-time PCR
Quantitative real-time PCR was conducted with TaqMan® instrument (TaqMan-PCR ABI Prism 7900HT sequence detection system, Perkin Elmer Applied Biosystems, Foster City, CA) that detects accumulation of PCR product, and allows quantification in the exponential phase of PCR reactions. Serial dilutions of cDNA from cells cultured with the TCPS extract (control) were analyzed for the internal control and target genes (Gapdh, Col I and Runx-2). A standard curve was determined by plotting threshold cycle (CT) vs. the log of initial amount of cDNA and ensured comparable efficiency within the dynamic range. Equal amounts of reaction mixture were amplified by PCR in a 1 × TaqMan® Universal Master mix containing AmpErase® UNG polymerase (Applied Biosystems, Foster City, CA). cDNA was amplified as follows: enzyme activation at 50°C for 2 min, 40 cycles of amplification associated with denaturation at 95 °C for 15 s and extension at 60 °C for 1 min. A control without template and one without polymerase were used to exclude nonspecific signals. Each sample was run in triplicate to test the consistency of the ABI Prism reading. Three replicate experiments were conducted to check for reproducibility.
Results
Cell adhesion and proliferation
Fig. 1 shows the results from a representative experiment (n = 3): the number of adhering cells per cm2 was not significantly different among materials (ANOVA, Student–Newman–Keuls (SNK) p > 0.05). As shown in Fig. 2, proliferation was significantly different on each material. Cells proliferated on the materials in the following order from lowest to highest: Ti6Al4V, TCPS, FGC (ANOVA, SNK p < 0.05).
Fig. 1.
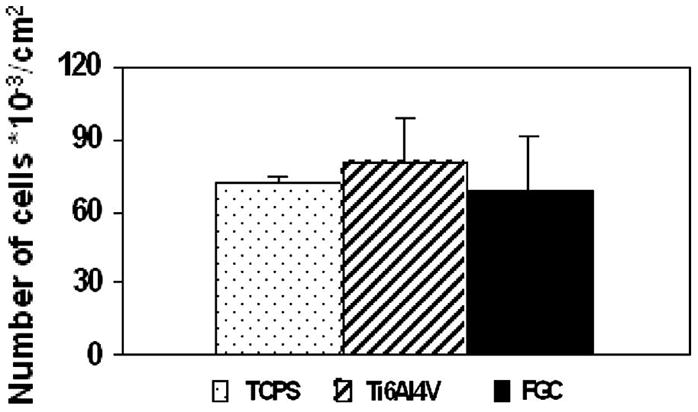
Cell adhesion: the number of adhering cells was not significantly different on all materials (ANOVA, SNK p>0.05).
Fig. 2.
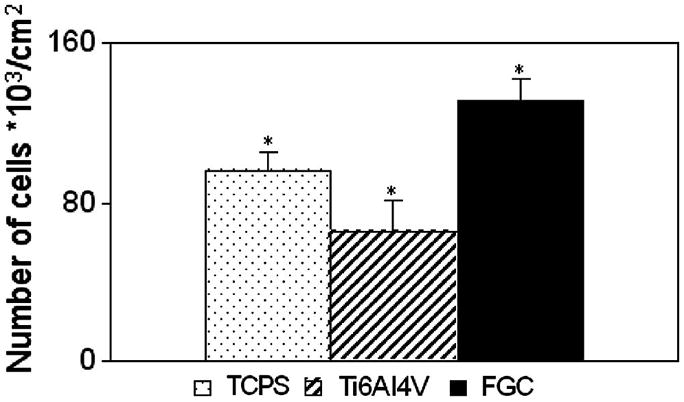
Cell proliferation: after 5 days in culture MC3T3-E1.4 mouse osteoblast-like cells proliferated significantly differently on all materials. Lowest proliferation occurred on Ti6Al4V followed by TCPS, and FGC (ANOVA, SNK p<0.05).
Qualitative mineralization: alizarin S staining
Fig. 3 shows alizarin S staining of the mineralizing cell layer on FGC and control materials. Distinct nodular colonies staining red can be distinguished.
Fig. 3.
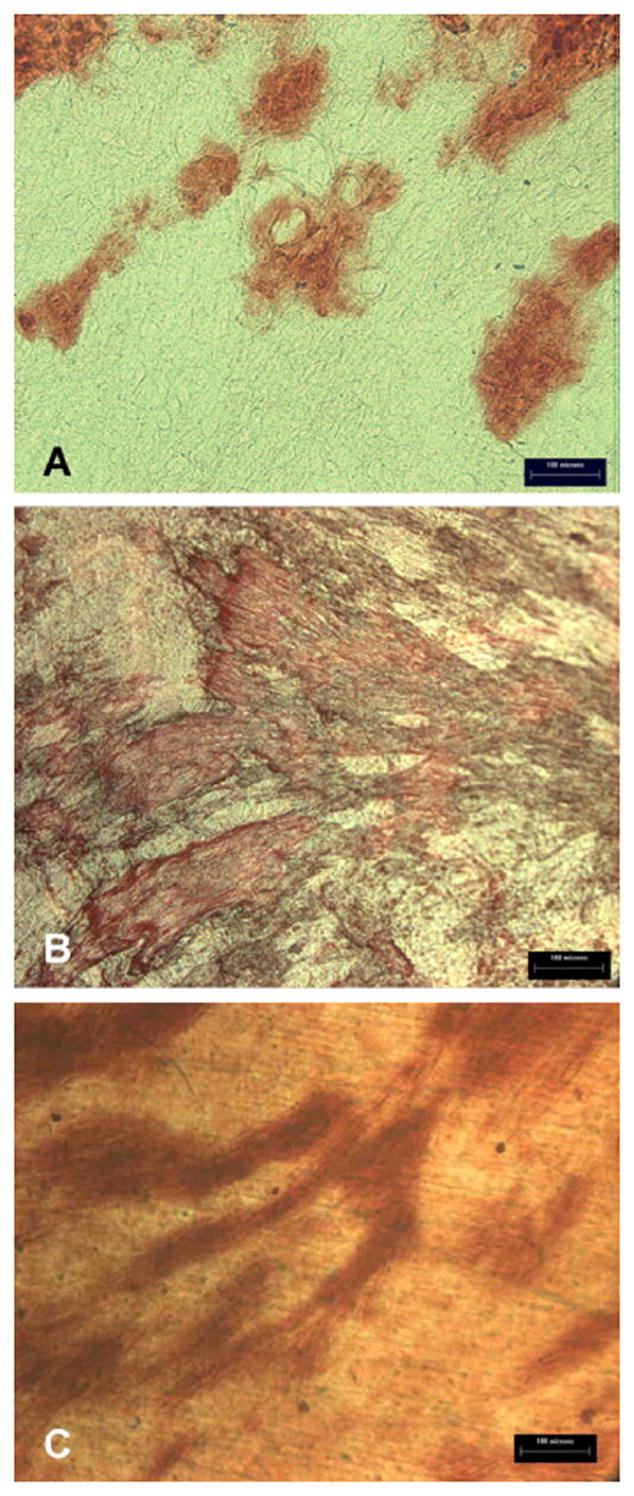
Mineralization by alizarin S staining: MC3T3-E1.4 mouse osteoblast-like cells mineralized on each substratum (A: TCPS, B: FGC, C: Ti6Al4V). Mineralizing areas showed a dark red staining.
Quantitative measurement of inorganic phosphate
Fig. 4 shows the concentration of inorganic phosphate released from the mineralizing cell layer from each material in one representative experiment (n = 3). Significantly different concentrations of inorganic phosphate were released from the cell layers cultured on each substratum in the following order from the lowest to the highest: Ti6Al4V, FGC, TCPS (ANOVA, SNK p<0.05).
Fig. 4.
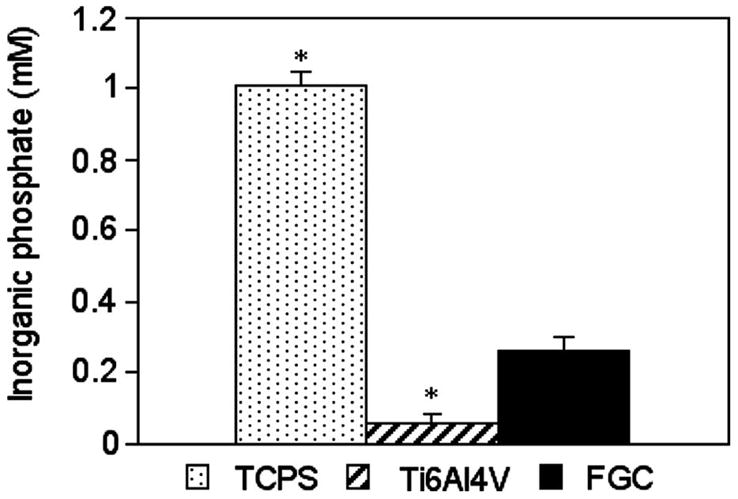
Quantitative mineralization: mineralizing tissue grown onto each material released a significantly different concentration of inorganic phosphate in the following order from the highest to the lowest: TCPS > FGC > Ti6Al4V (ANOVA, SNK p<0.05).
Real-time RT-PCR
Repeat runs of the same samples yielded consistent readings. Gapdh readings between samples were not significantly different, indicating that the initial amount of cDNA used was consistent between the samples. Fig. 5 shows the mean expression level, from three experiments, as percentage of the TCPS control. Real-time RT-PCR showed that Runx-2 expression level was 216% of TCPS control in cultures treated with FGC extract, which was statistically significant (ANOVA, SNK p<0.05). Ti6Al4V did not elicit a significant change in Runx-2 expression with respect to TCPS (ANOVA, SNK p>0.05). Cultures treated with either Ti6Al4V or FGC extract expressed Col 1 at a significantly lower level, about 80% of the TCPS control (ANOVA, SNK p<0.05).
Fig. 5.
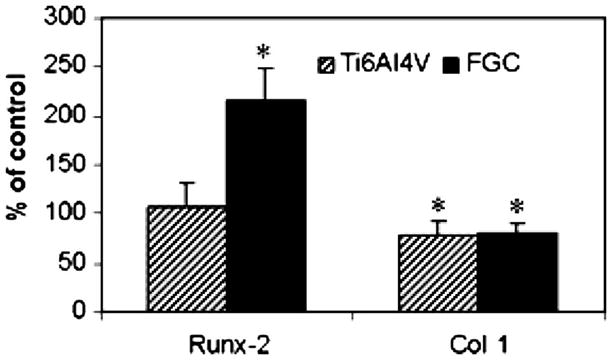
Real-time RT-PCR: FGC extract induced a 2-fold increase in the expression of Runx-2 compared to TCPS extract. FGC and Ti6Al4V extracts induced a 20% decrease in the expression of Col 1 compared to TCPS extract (*significantly different ANOVA, SNK p<0.05).
Discussion
Functionally graded coatings of bioactive glasses on titanium alloy may be a potential alternative to plasma-sprayed hydroxyapatite implant coatings, which have been shown to be unreliable [14–17]. We previously determined that a preconditioning treatment in SBF stabilizes FGCs prior to exposure to a protein-containing environment. After preconditioning in SBF, scanning electron microscopy (SEM), Fourier transform infrared spectroscopy (FTIR) and X-ray diffraction (XRD) analyses indicated the presence of a crystalline apatite-like mineral on the FGC surface [4]. In this study, no significant change could be identified by SEM and FTIR on the surface of the control materials (TCPS and TI6Al4V) after the same preconditioning treatment (data not shown). Alternative preconditioning techniques yielding a coating of apatite on titanium alloy were reported (e.g. soaking in concentrated SBF [18–20] or combinations of chemical and thermal treatments [21]). Our future focus will be on testing the effect of these techniques on FGCs and assessing the quality and cytocompatibility of the surface obtained. In this work we generated control samples by using comparable conditions for all materials that had previously been shown to yield an apatite coating on the surface of the glass as cast as well as on the FGCs [4]. After preconditioning in SBF, the FGCs were cytocompatible as shown by cell adhesion similar to controls, and increased re-entry in the cell cycle after synchronization; all materials allowed cell differentiation and mineralization. An interesting finding was the significantly greater inorganic phosphate apparently included in the mineralizing cell layer cultured on the FGCs, as compared to the TiAl4V control. This suggests that the FGCs may offer more rapid mineralization. Counting numbers of mineralized nodules present on the materials surface would not have been proportional to the true amount of mineralization due to differences in size and thickness of the three- dimensional nodules. However the technique used here cannot exclude the possibility that some of the apatite mineral coating on the FGCs was removed along with cells prior to these measurements; this is a concern that will be addressed in our future work through SEM observation of the removal of cells from the surface of the materials to assess the integrity of the apatite layer, coupled with measurements of the amount of surface covered by bone-like nodules. Mineralization onto TCPS was significantly higher than onto Ti6Al4V and FGC. The quantitative mineralization data, together with qualitative alizarin S staining, indicate that Ti6Al4V and FGC may delay but do not inhibit MC3T3-E1.4 mineralization, compared to TCPS. These differences could be due to the combined effect of surface chemistry and topography of the substrates. Microarray gene analysis indicated that Bioglass® extract affects gene expression in human primary osteoblastic cultures [8, 9], which suggests the possibility of designing materials capable of inducing the expression of specific genes [10]. We conducted preliminary experiments to determine if FGCs also are able to induce gene expression.
Previous reports identified glassy materials that are capable of altering osteoblast gene expression by virtue of their dissolution products. Such materials were defined as “third-generation biomaterials” [10–12]. The objective of the second part of this study was to assess the ability of stable FGCs (i.e. preconditioned) to alter osteoblast gene expression and determine their potential as “third-generation biomaterials”. We analyzed gene expression in response to the materials’ dissolution products to uncouple the effects of chemistry from surface topology. We analyzed to two known osteoblast markers genes: Runx-2 (early stages of osteoblast differentiation) and Col 1 (later stages of osteoblast differentiation). A more in-depth analysis of osteoblast markers (e.g. osteocalcin, bone sialoprotein), as well as the identification of dissolution products affecting gene expression, will be the focus of future work.
Runx-2 is an osteoblast-specific transcription factor required for the differentiation of mesenchymal progenitor cells towards the osteoblastic lineage; in fact −/− Runx-2 mice do not have functional osteoblasts and show an exclusively cartilaginous skeleton [22]. Additionally Runx-2 is necessary to maintain a functional osteoblastic phenotype [23]. Collagen type 1 is the major collagenous extracellular matrix protein present in bone, and plays a central role in bone mineralization [24]. Using real-time RT-PCR we found that FGCs extract induced a 2-fold increase in the expression of Runx-2 compared to uncoated Ti6Al4V and TCPS, while Col 1 expression by the extracts of either FGCs or Ti6Al4V, was about 80% of the expression induced by TCPS extract. Thus FGC dissolution products can induce selective gene expression, which is important to osteoblast differentiation in a simplified in vitro model. The 2-fold induction of Runx-2 expression by FGC extract could have important clinical implications. In vivo implants are in contact with a variety of cells present in bone, including mesenchymal stem cells [25]. These innovative coatings may promote the differentiation of mesenchymal stem cells towards the osteoblastic lineage by stimulating Runx-2 expression, thereby favorably affecting osteointegration. The coating composition may be modified to simultaneously promote mineralization by the induction of genes involved in the process such as Col 1. This intriguing result will be the subject of future research.
Conclusions
FGCs preconditioned in SBF were cytocompatible and promoted osteoblast proliferation compared to uncoated titanium alloy and TCPS. Mineralization levels for FGC were higher than Ti6Al4V but less than TCPS. FGCs and Ti6Al4V are able to affect osteoblast gene expression indirectly through their dissolution products into tissue culture media. Specifically FGCs extract induced a 2-fold expression of Runx-2, a key marker of osteoblast differentiation, compared to Ti6Al4V and TCPS. The current results prompt a future investigation addressing the identification of the specific chemical cues behind the induction of gene expression, and the tailoring of materials composition to control such effect.
Acknowledgments
This work was supported by NIH/NIDCR Grant R01DE11289
Footnotes
Publisher's Disclaimer: This is a PDF file of an unedited manuscript that has been accepted for publication. As a service to our customers we are providing this early version of the manuscript. The manuscript will undergo copyediting, typesetting, and review of the resulting proof before it is published in its final citable form. Please note that during the production process errors may be discovered which could affect the content, and all legal disclaimers that apply to the journal pertain.
References
- 1.Gomez-Vega JM, Saiz E, Tomsia AP. Glass-based coatings for titanium implant alloys. J Biomed Mater Res. 1999;46(4):549–59. doi: 10.1002/(sici)1097-4636(19990915)46:4<549::aid-jbm13>3.0.co;2-m. [DOI] [PubMed] [Google Scholar]
- 2.Gomez-Vega JM, et al. Bioactive glass coatings with hydroxyapatite and Bioglass particles on Ti-based implants. 1. Processing Biomaterials. 2000;21(2):105–11. doi: 10.1016/s0142-9612(99)00131-3. [DOI] [PubMed] [Google Scholar]
- 3.Hench L, Anderson O. Bioactive glasses. In: Hench LL, Wilson J, editors. An Introduction to Bioceramics. World Scientific; Singapore: 1993. pp. 41–62. [Google Scholar]
- 4.Foppiano S, et al. Functionally graded bioactive coatings: reproducibility and stability of the coating under cell culture conditions. Acta Biomater. 2006;2(2):133–42. doi: 10.1016/j.actbio.2005.12.003. [DOI] [PubMed] [Google Scholar]
- 5.Radin S, et al. The effect of in vitro modeling conditions on the surface reactions of bioactive glass. J Biomed Mater Res. 1997;37(3):363–75. doi: 10.1002/(sici)1097-4636(19971205)37:3<363::aid-jbm7>3.0.co;2-j. [DOI] [PubMed] [Google Scholar]
- 6.Radin S, et al. In vitro transformation of bioactive glass granules into Ca-P shells. J Biomed Mater Res. 2000;49(2):264–72. doi: 10.1002/(sici)1097-4636(200002)49:2<264::aid-jbm16>3.0.co;2-2. [DOI] [PubMed] [Google Scholar]
- 7.Sepulveda P, Jones JR, Hench LL. In vitro dissolution of melt-derived 45S5 and sol-gel derived 58S bioactive glasses. J Biomed Mater Res. 2002;61(2):301–11. doi: 10.1002/jbm.10207. [DOI] [PubMed] [Google Scholar]
- 8.Xynos ID, et al. Ionic products of bioactive glass dissolution increase proliferation of human osteoblasts and induce insulin-like growth factor II mRNA expression and protein synthesis. Biochem Biophys Res Commun. 2000;276(2):461–5. doi: 10.1006/bbrc.2000.3503. [DOI] [PubMed] [Google Scholar]
- 9.Xynos ID, et al. Gene-expression profiling of human osteoblasts following treatment with the ionic products of Bioglass 45S5 dissolution. J Biomed Mater Res. 2001;55(2):151–7. doi: 10.1002/1097-4636(200105)55:2<151::aid-jbm1001>3.0.co;2-d. [DOI] [PubMed] [Google Scholar]
- 10.Hench LL, Polak JM. Third-generation biomedical materials. Science. 2002;295(5557):1014–7. doi: 10.1126/science.1067404. [DOI] [PubMed] [Google Scholar]
- 11.Christodoulou I, et al. Characterization of human fetal osteoblasts by microarray analysis following stimulation with 58S bioactive gel-glass ionic dissolution products. J Biomed Mater Res B Appl Biomater. 2006;77(2):431–46. doi: 10.1002/jbm.b.30455. [DOI] [PubMed] [Google Scholar]
- 12.Jell G, Stevens MM. Gene activation by bioactive glasses. J Mater Sci Mater Med. 2006;17(11):997–1002. doi: 10.1007/s10856-006-0435-9. [DOI] [PubMed] [Google Scholar]
- 13.Heinonen JK, Lahti RJ. A new and convenient colorimetric determination of inorganic orthophosphate and its application to the assay of inorganic pyrophosphatase. Anal Biochem. 1981;113:313–317. doi: 10.1016/0003-2697(81)90082-8. [DOI] [PubMed] [Google Scholar]
- 14.Bloebaum RD, et al. Postmortem comparative analysis of titanium and hydroxyapatite porous- coated femoral implants retrieved from the same patient. A case study. J Arthroplasty. 1993;8(2):203–11. doi: 10.1016/s0883-5403(09)80014-4. [DOI] [PubMed] [Google Scholar]
- 15.Bloebaum RD, Dupont JA. Osteolysis from a press-fit hydroxyapatite-coated implant. A case study. J Arthroplasty. 1993;8(2):195–202. doi: 10.1016/s0883-5403(09)80013-2. [DOI] [PubMed] [Google Scholar]
- 16.Chang YL, et al. Biomechanical and morphometric analysis of hydroxyapatite-coated implants with varying crystallinity. J Oral Maxillofac Surg. 1999;57(9):1096–108. 1108–9. doi: 10.1016/s0278-2391(99)90333-6. [DOI] [PubMed] [Google Scholar]
- 17.Lacefield WR. Hydroxylapatite coatings. In: Hench LL, Wilson J, editors. An Introduction to Bioceramics. World Scientific; Singapore: 1993. pp. 223–238. [Google Scholar]
- 18.Barrere F, et al. Biomimetic calcium phosphate coatings on Ti6AI4V: a crystal growth study of octacalcium phosphate and inhibition by Mg2+ and HCO3. Bone. 1999;25(2 Suppl):107S–111S. doi: 10.1016/s8756-3282(99)00145-3. [DOI] [PubMed] [Google Scholar]
- 19.Barrere F, et al. Nucleation of biomimetic Ca-P coatings on ti6A14V from a SBF x 5 solution: influence of magnesium. Biomaterials. 2002;23(10):2211–20. doi: 10.1016/s0142-9612(01)00354-4. [DOI] [PubMed] [Google Scholar]
- 20.Bigi A, et al. Nanocrystalline hydroxyapatite coatings on titanium: a new fast biomimetic method. Biomaterials. 2005;26(19):4085–9. doi: 10.1016/j.biomaterials.2004.10.034. [DOI] [PubMed] [Google Scholar]
- 21.Kokubo T, et al. Bioactive metals: preparation and properties. J Mater Sci Mater Med. 2004;15(2):99–107. doi: 10.1023/b:jmsm.0000011809.36275.0c. [DOI] [PubMed] [Google Scholar]
- 22.Komori T, et al. Targeted disruption of Cbfa1 results in a complete lack of bone formation owing to maturational arrest of osteoblasts. Cell. 1997;89(5):755–64. doi: 10.1016/s0092-8674(00)80258-5. [DOI] [PubMed] [Google Scholar]
- 23.Karsenty G. The genetic transformation of bone biology. Genes Dev. 1999;13(23):3037–51. doi: 10.1101/gad.13.23.3037. [DOI] [PubMed] [Google Scholar]
- 24.Owen TA, et al. Progressive development of the rat osteoblast phenotype in vitro: reciprocal relationships in expression of genes associated with osteoblast proliferation and differentiation during formation of the bone extracellular matrix. J Cell Physiol. 1990;143(3):420–30. doi: 10.1002/jcp.1041430304. [DOI] [PubMed] [Google Scholar]
- 25.Bianco P, Robey PG. Stem cells in tissue engineering. Nature. 2001;414(6859):118–21. doi: 10.1038/35102181. [DOI] [PubMed] [Google Scholar]