

Abstract
Objectives
States vary greatly in their support for home- and community-based services (HCBS) that are intended to help disabled seniors live in the community. This article examines how states' generosity in providing HCBS affects the risk of nursing home admission among older Americans and how family availability moderates such effects.
Methods
We conducted discrete time survival analysis of first long-term (90 or more days) nursing home admissions that occurred between 1995 and 2002, using Health and Retirement Study panel data from respondents born in 1923 or earlier.
Results
State HCBS effects were conditional on child availability among older Americans. Living in a state with higher HCBS expenditures was associated with lower risk of nursing home admission among childless seniors (p < .001). However, the association was not statistically significant among seniors with living children. Doubling state HCBS expenditures per person aged 65 or older would reduce the risk of nursing home admission among childless seniors by 35%.
Discussion
Results provided modest but important evidence supportive of increasing state investment in HCBS. Within-state allocation of HCBS resources, however, requires further research and careful consideration about fairness for individual seniors and their families as well as cost effectiveness.
Previous research has shown that families play critical roles in the care of frail elderly members as direct care providers and decision makers (Freedman, 1996). However, less is known about how long-term care (LTC) policy contexts affect seniors' LTC service use. In particular, states vary greatly in their public support for home- and community-based services (HCBS), a range of services, such as personal care, adult day care, nutrition, and transportation services, provided in noninstitutional settings that are intended to help disabled older persons live in the community (Muramatsu & Campbell, 2002). This article examines how states' commitment to HCBS affects the risk of nursing home admission among older Americans and how family caregiving resources moderate such effects.
Inter-State Variation in Support for HCBS
States play the key role in U.S. LTC policies. Medicaid funds the greatest share of LTC services, covering almost 46% of nursing home expenditures (Smith, Cowan, Sensenig, & Catlin, 2005) and 80% of publicly funded HCBS (Administration on Aging, 1995b; Ladd, Kane, & Kane, 1999; U.S. Department of Health and Human Services, 2000–2004). States set Medicaid eligibility criteria, determine payment levels, and define covered services subject to broad federal guidelines. Given minimum federal standards, states have developed a variety of strategies to care for older adults with LTC needs in the community.
States vary greatly in their HCBS commitment. HCBS for seniors are funded by Medicaid (Aged and Disabled HCBS waiver programs and state plans covering home health and personal care) but also by state general revenues and moneys allocated to states from the Older Americans Act and Social Services Block Grant (Title XX) programs. In some states, these non-Medicaid funds have accounted for a substantial proportion of HCBS expenditures. In 1992, annual total HCBS expenditures from Medicaid and non-Medicaid funds ranged from $1,180 per person aged 65 and older in New York, to $369 in Oregon, down to $29 in Mississippi; the percentage of total LTC expenditures used for HCBS ranged from 4.4% to 50.4% (Administration on Aging, 1995b; Ladd, Kane, Kane, & Nielsen, 1995). This variation remains today, although Medicaid HCBS spending for seniors increased by more than 200% (Consumer Price Indiex-adjusted) between 1992 and 2002, driven by rapid increases (greater than 400%) in Medicaid HCBS waiver programs for aged or disabled persons.
Organizing Framework and Research Focus
The behavioral model of health services use (Andersen, 1995; Andersen & Newman, 1973), the most frequently used framework for nursing home utilization research, suggests that use of services is a function of predisposition to use services, factors that enable or impede use, need for services, and health care system characteristics. Previous studies have shown that nursing home admission is associated with certain predispositions (e.g., higher age) and higher needs (e.g., limitations with daily activities) as well as family availability that enables seniors to live in the community (Boaz & Muller, 1994; Cagney & Agree, 1999; Fisher & Lieberman, 1999; Freedman, 1996; Gaugler et al., 2000; Gaugler, Kane, Kane, Clay, & Newcomer, 2003; Jette, Tennstedt, & Crawford, 1995; Kersting, 2001). Certain community resources, particularly nursing home bed availability, might affect use of nursing home services. Some studies (Greene & Ondrich, 1990; S. C. Miller et al., 1998) support this, but others (Newman, Struyk, Wright, & Rice, 1990) do not.
The most understudied factors of nursing home admission are those related to the health care system ( E. A. Miller & Weissert, 2000). In order to protect respondents' confidentiality, publicly available data usually do not contain detailed geographic information, making it difficult to examine the effects of state-level LTC system factors on nursing home admission. Few studies have examined such effects. Aykan (2002) and Laditka (1998) examined specific strategies that states use to control LTC utilization (such as Medicaid eligibility criteria, availability of Medicaid HCBS waivers, and the existence of certificate of needs programs for nursing home beds) and found no association with nursing home admission. An alternative approach, which we adopted, is to use states' HCBS expenditures across various Medicaid and non-Medicaid programs as a proxy for states' overall HCBS commitment (Administration on Aging, 1995b; R. A. Kane, Kane, & Ladd, 1998; R. L. Kane, Kane, Ladd, & Veazie, 1998; Ladd et al., 1999; Ladd et al., 1995). Using the proportion of states' Medicaid LTC spending on HCBS, S. C. Miller and colleagues (1998) found that, in a sample of people with dementia, unmarried persons who lived in high HCBS states stayed in the community longer than those who lived in low HCBS states . No research has yet documented how states' total HCBS commitment impacts the risk of nursing home admission in the general population.
Using panel data from a large nationally representative sample survey, we examined how risk of nursing home admission is affected by overall state financial support for HCBS and its interaction with family care resources. Our hypothesis was that higher state commitment to HCBS would delay nursing home admission because older adults in those states would be more likely to use formal (or paid) care, often in conjunction with informal (or unpaid family) care (Muramatsu & Campbell, 2002), which would enable them to live in the community. We also hypothesized that the impact of the level of HCBS commitment would be moderated by the level of potential informal help resource availability and that the effects of state HCBS support would be larger for those who lacked family. Family members tend to provide disabled seniors with needed assistance regardless of the level of state support for HCBS and protect seniors from the risk of nursing home admission. Previous research indicates that living in a state with high HCBS support does not reduce the probability of receiving informal support, suggesting that HCBS complement, rather than substitute for, family care (Muramatsu & Campbell, 2002). Seniors without family resources, however, tend to be more vulnerable to the impact of disability and state LTC contexts than those with family resources. We incorporated variables that represented a wide range of family caregiving resources, including family availability, proximity to children, and the demographic and health characteristics of the spouse. We expected these resources to help older adults live in the home and thus delay their nursing home admission.
We took into consideration other factors that are known to affect nursing home admission, such as physical disability, medical morbidity, and dementia. Banaszak-Holl and colleagues (2004) indicated that, controlling for functional impairment, dementia remained significant whereas clinical conditions did not. Thus, our models included dementia and number of chronic diseases. With regard to various socioeconomic factors, we expected that having assets, especially non-housing assets that one could use to purchase HCBS services, would reduce the risk of nursing home admission, but that having medical and LTC insurance would have limited effects. Private LTC insurance is not very widespread and so far has not had a significant impact on the LTC system (Cohen, 2003). Medicaid status could have two counteracting effects. On one hand, having Medicaid could increase one's access to nursing home care covered by Medicaid; on the other hand, being on Medicaid could increase access to HCBS, reducing the risk of nursing home admission. Virtually all Americans aged 65 and older have Medicare that covers skilled nursing care, and thus our model did not include Medicare status.
Methods
We conducted discrete time survival analysis of the timing of first long-term (90 or more days) nursing home admissions that occurred between 1995 and 2002. The sample of interest was Health and Retirement Study (HRS) respondents born in 1923 or earlier (i.e., respondents in the original Assets and Health Dynamics Among the Oldest Old or AHEAD) who were at risk for first long-term nursing home admission as of 1995. The HRS started asking about the timing of nursing home admission in the 1998 survey, which retrospectively covered the period since the 1995 interview. Until then, the HRS asked about previous nursing home admissions but not their timing. We compiled the admission history information from the main surveys and exit interviews of surviving relatives or friends conducted in 1998, 2000, and 2002. Other researchers (Liu, McBride, & Coughlin, 1994) have used the 90-day cutoff point to differentiate long-term use by people with chronic disabilities from short-term nursing home admissions for people recovering from acute illnesses. A restricted data file containing state identifiers permitted us to link state-level data to the micro data. In addition to the main effects of state-level, person-level, and family variables, we examined cross-level interactions to investigate whether the family effects varied by state HCBS expenditures.
Measures
We obtained the timing of first nursing home admission from survey questions concerning the number, duration, and timing of nursing home stays. For cases that indicated nursing home stays but did not provide exact timing of admission, we imputed the month of admission based on (a) total number of nights and data on other stays in the same interval between two interviews, or (b) discharge date (or end of interview date) and length of stay. The imputed cases constituted 3.7% of the 680 respondents in our final analytic sample who had had a long-term nursing home admission during the study period (1995–2002).
We measured family resources (potential caregiving resources) by several variables that indicated family structure: marital status (currently married or not), child availability (three categories: coresidence or child living within 10 miles, child living more than 10 miles away, and no living child), and number of living siblings. In addition, we included age and health characteristics of the spouse, who is the most frequent source of informal care. In order to retain unmarried respondents, we used mean values for spouse characteristics for individuals who were not married; this method, used in conjunction with an indicator variable for marital status, permits unbiased estimation of the effects of spouses in the full sample (Allison, 2002).
Following previous research (Administration on Aging, 1995b; Ladd et al., 1999; Ladd et al., 1995), we measured state commitment to HCBS by two proxy variables: total HCBS expenditures divided by the 65 and older population, and percentage of LTC expenditures going to HCBS rather than nursing homes. The former indicates the absolute amount of money spent on HCBS, whereas the latter indicates the extent of the state LTC system's orientation toward HCBS as opposed to institutional services. We captured HCBS efforts funded not only by Medicaid but also by other sources given the substantial role played by non-Medicaid programs in some states. These state-level variables represented the broad LTC contexts faced by older adults.
Table 1 lists the data elements used to create the state-level variables and their sources. Briefly, total LTC expenditures included nursing home expenditures covered by Medicaid as well as HCBS expenditures from the following four major sources: Medicaid (home health, personal care, and HCBS waivers for aged or disabled individuals), Older Americans Act Title III programs, Social Services Block Grants, and programs funded with only state revenues. When the data for particular years were not available, we used the most recent comparable data available.
Table 1. State Data Sources and Available Years.
| Data Element | Data Source | Years Available | |
|---|---|---|---|
| A | Medicaid | Medstat (Burwell, 2001a,b, 2003a,b) | 1995–2002 |
| A1 | Home healtha | ||
| A2 | Personal care | ||
| A3 | Nursing home | ||
| A4 | HCBS waiver (aged or disabled)b | ||
| B | Older Americans Act | Administration on Aging, 1995a, 1996, 2004 | 1995–2002 |
| C | Social Services Block Grant | U.S. Department of Health and Human Services, 1999, 2000–2004c | 1995–2002 |
| D | State source programsd | Kassner & Williams, 1997; Summer & Ihara, 2004 | 1996, 2002 |
| E | Population 65 and older | Bureau of Health Professions, 2003 | 1995–2002 |
| F | Total HCBS expenditures | A1 + A2 + A4 + B + C + D | |
| Variable | |||
| G | Total HCBS expenditures per person 65 and older | F/E | |
| H | Total LTC expenditures | A1 + A2 + A3 + A4 + B + C + D | |
| I | Percentage of LTC expenditures spent on HCBS | F/H × 100 |
Notes: Annual data on expenditures were compiled for the years included in the analyses, 1995 to 2002. HCBS data included four primary sources of expenditures: Medicaid HCBS (home health, personal care, and waiver expenditures for aged or disabled individuals), the Older Americans Act Title III programs, Social Services Block Grants, and state source programs. Total Medicaid LTC expenditures were calculated to create a variable indicating percentage of LTC expenditures spent on HCBS. HCBS = home- and community-based services; LTC = long-term care.
Texas home health expenditures for 1998 to 2002 were acquired from the Texas Health and Human Service Commission because, due to a managed care arrangement, they were not otherwise available.
Waiver expenditures for Michigan, Connecticut, and Wyoming were adjusted to correct for known reporting errors.
Data from the following states were obtained from state offices: New Hampshire, Vermont, Ohio, Rhode Island, and Connecticut for 1995 to 1997; Tennessee for 1995 to 1998.
Includes programs funded by states through either general revenue or other special funding mechanisms. Surveys of these programs were conducted twice during the study period in 1996 and 2002 by researchers at AARP. Values from 1996 were used for 1996 to 2001. The 2002 data had missing values for several states, including Illinois, where data were obtained from the Illinois Department of Aging; and Maryland, Missouri, North Dakota and Wisconsin, where 1996 data were used.
Age, gender, education, race, ethnicity, income, non-housing wealth, health insurance status (Medicaid, LTC insurance that covered nursing home care), care needs (limitations with activities of daily living and instrumental activities of daily living, number of medical conditions, self-rated health), home ownership, previous short-term nursing home stay(s), and proxy (i.e., whether the interview was conducted by a proxy) were covariates. For income and non-housing wealth, we created indicator variables corresponding to the high, middle, or low tercile, with the low group as the reference category. Cognitive impairment indicated the presence and severity of dementia. Following Langa and colleauges (2001), we measured severity of dementia on a 4-point scale (1 = no dementia, 2 = mild dementia, 3 = moderate dementia, 4 = severe dementia). For self-respondents, we based scores on the Telephone Interview of Cognitive Status, a validated screening instrument patterned on the Mini-Mental State Examination. For proxy respondents, we based them on the proxy's assessment of the respondent's memory and judgment. Because bed availability may also affect one's chance of entering a nursing home, we included county-level nursing home bed availability (Centers for Medicare and Medicaid Services, 1995–2002) per person 65 and older (Bureau of Health Professions, 2003) to account for within-state variation in bed availability. We obtained the month of death from exit interview data.
We drew person-level data from files produced by the Rand Center for the Study of Aging, supplemented with other public data files not included in the Rand distribution, such as “exit interview,” “tracker,” “other person,” “helper,” and “region” files.
Analytic Strategy
The HRS surveys are characterized by survey data gathered at fixed time points in conjunction with more or less precisely dated information on the timing of transitions from retrospective reports. The interval varies both within and between persons so that the retrospective data cover intervals ranging from 12 to 38.5 months. Our analytic strategy was to fit discrete time survival models using time-fixed and time-varying covariates. The discrete time approach makes it much simpler to deal with the complex pattern of time-varying covariates. We constructed a file of person-months for each observation, beginning with the month of the 1995 interview and continuing until the first long-term nursing home admission (if it occurred). We treated persons who died before entering a nursing home, as well as those who had no entry as of the 2002 interview, as censored observations. For each month of observation, we constructed time-varying covariates, drawn from the most recent interview prior to the month in question. For example, we drew variables pertaining to transitions between the 1995 and 1998 interviews from 1995 records. The analytic file consisted of 293,475 person-month records, each coded to indicate whether a transition had taken place. All told, 680 persons had long-term stays. An additional 1,432 persons died, and the remainder were censored.
Modeling the dichotomous outcome using a complementary log-log link, rather than the logistic, yields results that are very closely comparable to those produced by the usual continuous time proportional hazard model (Allison, 1995; Singer & Willett, 2003). Exponentiated coefficients from the model can be interpreted as hazard ratios. Because observations are nested within states, in order to deal with potential nonindependence we obtained standard errors adjusted for clustering based on the “sandwich estimator” (Stata Corporation, 2005). This conventional model with robust standard errors and the multilevel random-intercept model are reasonable alternatives. We ran both models with a complementary log-log link to produce similar results. We present the conventional model results here because the random intercept model is more highly parameterized and, hence, may be more vulnerable to misspecification. The multilevel model, however, has the advantage of allowing variance partition at state and person levels. So we refer to the multilevel model results to describe the state-level variance. We used Stata 9.0 for all computations.
The HRS involves a complex survey design with over-samples of African Americans, Hispanics, and residents of Florida. We included indicator variables for the first two groups in our models along with many other variables (such as age and income) that account for similarity of cases within primary sampling units. As Winship and Radbill (1994) noted, it is not desirable to use sampling weights if the variables that define the weights are included in the model. Furthermore, when one does use weights, one should use software that takes into account the sample design as a whole, and not just the weights. To the best of our knowledge, no such software exists for panel data of this kind. We believe the argument that the weights are reflected in the independent variables included in our model is appropriate in this case.
Death represents a competing risk to entering a nursing home. However, time to death and nursing home admission were likely to be dependent, because underlying poor health may increase the risk of both nursing home admission and death. We attempted to deal with nonindependence of competing risks by including a set of observable health status measures in the model (Allison, 1995). Thus, our model assumed that death and nursing home entry were conditionally independent net of the covariates. Although the independence assumption under multiple competing risks cannot be formally tested (Cox & Oakes, 1984), we believe that our approach is reasonable given that we included a strong set of covariates, including several health-related variables, a measure of whether the respondent provided data via a proxy, and other demographic variables related to health status.
Analytic Sample
Of the AHEAD cohort (N = 7,441), 6,279 were alive and had no known prior long-term nursing home admission (and thus risk of first admission) as of the 1995 survey date. We identified those with prior nursing home admission based on the surveys conducted in 1993 and 1995 (also in 1992 for a handful of respondents) that retrospectively covered the period starting 1 year before the baseline survey date. From those at risk for admission, we excluded the following three groups: (a) 1995 survey nonrespondents (n = 467), because they had no nursing home admission history data available for the period 1993 to 1995 and we could not determine whether they were at risk as of 1995; (b) those who had gaps in survey participation and thus had no nursing home history data available for some period prior to event (nursing home admission, death, or the end of the study period; n = 445); and (c) another 143 respondents with missing data, including those with missing or invalid data in the dependent variables (e.g., admission date, n = 30), state identifiers (n = 47), or independent variables (n = 59); and those who changed spouses during the study period, (n = 7). Our final analytic sample was thus 5,224 respondents who resided in 38 states as of 1995. Table 2 presents the characteristics of respondents at risk for first admission at each survey. The number of those at risk decreased due to admission and deaths. States' HCBS expenditures per person aged 65 and older and the proportion of HCBS in LTC expenditures increased significantly during the study period (Table 3).
Table 2. Sample Characteristics of Assets and Health Dynamics Among the Oldest Old Cohort.
| 1995 Survey (n = 5,176)a | 1998 Survey (n = 4,056) | 2000 Survey (n = 2,967) | |
|---|---|---|---|
| Variable | M(SD) | M(SD) | M(SD) |
| Sociodemographic characteristics | |||
| Age (years)b | 79.56(5.58) | 78.77(5.09) | 78.05(4.58) |
| Femaleb,c | 0.61 | 0.63 | 0.62 |
| African Americanb,c | 0.13 | 0.12 | 0.11 |
| Hispanicb,c | 0.05 | 0.06 | 0.06 |
| Education (years in school)b | 10.91(3.71) | 11.09(3.68) | 11.19(3.63) |
| Total non-housing wealth ($) | 181,867(746,807) | 184,935(641,253) | 209,513(585,963) |
| Household income ($) | 25,473(35,374) | 28,744(36,176) | 29,355(37,021) |
| Insurance | |||
| Medicaidc | 0.10 | 0.11 | 0.10 |
| Long-term care insurance that covers nursing home carec | 0.08 | 0.07 | 0.07 |
| Health | |||
| No. of ADL limitations | 0.57(1.17) | 0.55(1.15) | 0.57(1.16) |
| No. of IADL limitations | 0.55(1.20) | 0.56(1.16) | 0.58(1.23) |
| Cognitive impairmentd | 1.20(0.67) | 1.19(0.64) | 1.21(0.68) |
| Self-rated healthe | 2.97(1.16) | 2.81(1.14) | 2.86(1.13) |
| No. of diseases | 1.92(1.32) | 2.12(1.33) | 2.35(1.33) |
| Family characteristics | |||
| Marriedc | 0.49 | 0.45 | 0.42 |
| Number of living children | 2.61(1.77) | 2.64(1.77) | 2.94(1.64) |
| Children nearby (within 10 miles)c | 0.52 | 0.51 | 0.46 |
| Living with own or step childc | 0.19 | 0.19 | 0.21 |
| No. of living siblings | 1.81(1.72) | 1.72(1.71) | 1.67(1.68) |
| Spouse | |||
| Age (years)b | 76.50(6.76) | 75.46(6.55) | 74.55(6.30) |
| No. of ADL limitations | 0.44(1.07) | 0.48(1.14) | 0.50(1.14) |
| No. of IADL limitations | 0.42(1.10) | 0.49(1.15) | 0.49(1.19) |
| Self-rated healthe | 3.03(1.16) | 2.83(1.15) | 2.92(1.12) |
| No. of medical conditions | 1.78(1.29) | 2.03(1.31) | 2.25(1.33) |
| Controls | |||
| Previous short-term nursing home stay(s)b,c | 0.22 | 0.19 | 0.16 |
| Own homec | 0.64 | 0.68 | 0.68 |
| Proxy interviewsc | 0.11 | 0.10 | 0.12 |
| Nursing home beds per 100 persons 65 and older in county | 5.41(2.53) | 5.29(2.27) | 5.12(2.12) |
| Time (months since 1995 interview ) | 1.00(0.00) | 28.02(2.47) | 53.18(2.29) |
Note: The mean of an indicator variable scored 0 and 1 is the proportion of cases with that attribute. We have omitted standard deviations for indicator variables. ADL = activity of daily living; IADL = instrumental ADL; SD = standard deviation.
An additional 48 respondents who met our sample inclusion criteria had some missing values at the 1995 survey. These respondents were excluded from the descriptive statistics for the 1995 survey but were included in our analytic sample of N = 5,224.
Time fixed, measured at 1995 survey.
Indicator variable: 1 = yes, 0 = no.
1 = no dementia, 2 = mild dementia, 3 = moderate dementia, 4 = severe dementia.
1 = poor, 2 = fair, 3 = good, 4 = very good, 5 = excellent.
Table 3. Characteristics of States Represented in the Assets and Health Dynamics Among the Oldest Old Cohort as of January 1995 to 2002.
| 1995 | 1996 | 1997 | 1998 | 1999 | 2000 | 2001 | 2002 | |
|---|---|---|---|---|---|---|---|---|
| State-Level Characteristic | M(SD) | M(SD) | M(SD) | M(SD) | M(SD) | M(SD) | M(SD) | M(SD) |
| Total HCBS expenditures per person 65 and older ($) | 281.0(188.4) | 278.0(177.5) | 306.4(191.0) | 321.7(209.9) | 356.1(226.9) | 391.4(251.5) | 445.3(291.6) | 503.1(312.7) |
| Total long-term care expenditures spent on HCBS (%) | 24.2(12.6) | 24.2(12.0) | 25.3(11.3) | 25.1(12.4) | 26.1(12.3) | 26.6(13.1) | 26.9(14.2) | 28.5(15.6) |
Notes: There were 38 states represented in the 1995 survey, 41 states represented in the 1998 survey, and 43 states represented in the 2000 survey. Change in the number of states represented resulted from residential mobility and mortality of the sample. HCBS = home- and community-based services; SD = standard deviation.
Results
Main Effects of State-Level Variables, Family Resources, and Individual-Level Factors
Our main-effects models (Table 4, Models 1 and 2) showed that state-level variables had no statistically significant effects on nursing home admission, although the coefficient was in the expected direction.
Table 4. Discrete Time Survival Models Using a Complementary Log-Log Link for First Nursing Home Admission in the Assets and Health Dynamics Among the Oldest Old Cohort, 1995 to 2002 (N = 293,475 Person-Month Records).
| Model 1 | Model 2 | Model 3 | |
|---|---|---|---|
| Variable | Exponentiated Coefficient | Exponentiated Coefficient | Exponentiated Coefficient |
| Individual level | |||
| Age (months) | 1.0073*** | 1.0073*** | 1.0073*** |
| Female | 0.9013 | 0.9005 | 0.9008 |
| African American | 0.6304** | 0.6290** | 0.6280** |
| Hispanic | 0.4232*** | 0.4332*** | 0.4251*** |
| Education (years in school) | 1.0300** | 1.0304** | 1.0310** |
| Wealth, non-housinga | |||
| Middle | 0.8519 | 0.8533 | 0.8491 |
| High | 0.7297** | 0.7361** | 0.7248** |
| Income, total householda | |||
| Middle | 0.9892 | 0.9915 | 0.9880 |
| High | 0.8249 | 0.8259 | 0.8255 |
| Medicaid | 1.0082 | 1.0111 | 1.0073 |
| LTC insurance that covers nursing home care | 0.9846 | 0.9847 | 0.9854 |
| No. of ADL limitations | 1.0429 | 1.0418 | 1.0476 |
| No. of IADL limitations | 1.2745*** | 1.2783*** | 1.2730*** |
| Cognitive impairmentb | 1.2405*** | 1.2441*** | 1.2457*** |
| Self-rated healthc | 0.8161*** | 0.8147*** | 0.8138*** |
| No. of medical conditions | 1.0308 | 1.0309 | 1.0287 |
| Married | 0.5420*** | 0.5409*** | 0.5447*** |
| Childd | |||
| Child living more than 10 miles away | 0.8512 | 0.8570 | 0.1517*** |
| Child nearby/coresiding | 0.6643*** | 0.6666*** | 0.0914*** |
| No. of living siblings | 0.9917 | 0.9923 | 0.9886 |
| Spouse | |||
| Age (months) | 1.0059*** | 1.0059*** | 1.0058*** |
| No. of ADL limitations | 0.9439 | 0.9415 | 0.9486 |
| No. of IADL limitations | 1.0776 | 1.0789 | 1.0770 |
| Self-rated healthc | 0.9098 | 0.9116 | 0.9129 |
| No. of medical conditions | 0.9719 | 0.9745 | 0.9726 |
| Own home | 0.8309*** | 0.8298*** | 0.8251*** |
| Previous short-term nursing home stay(s) | 1.0469 | 1.0540 | 1.0522 |
| Proxy | 1.1168 | 1.1048 | 1.1133 |
| Nursing home beds per 100 persons 65 and older in county | 1.0286 | 1.0224 | 1.0307 |
| State level | |||
| HCBS expenditure (logged) | 0.9404 | 0.7076e*** | |
| LTC expenditures spent on HCBS (%) | 0.9940 | ||
| LTC expenditures per person 65 and older (logged) | 0.9751 | ||
| Time (months since 1995 interview) | 1.0339*** | 1.0341*** | 1.0343*** |
| Time squared | 0.9995*** | 0.9995*** | 0.9995*** |
| Cross-level interactions | |||
| HCBS Expenditures × Child More Than 10 Miles Away | 1.3642*** | ||
| HCBS Expenditures × Child Nearby/Coresiding | 1.4274*** | ||
| Constant | 1.89 × 10−08*** | 1.79 × 10−08*** | 9.46 × 10−08*** |
Note: Standard errors adjusted for clustering on states. LTC = long-term care; ADL = activity of daily living; IADL = instrumental ADL; HCBS = home- and community-based services.
Reference group = low.
1 = no dementia, 2 = mild dementia, 3 = moderate dementia, 4 = severe dementia.
1 = poor, 2 = fair, 3 = good, 4 = very good, 5 = excellent.
Reference group = no child at all.
Model 3 examined interactions between per capita state HCBS expenditures and child availability variables. No child constituted the reference group, and thus the main effect of HCBS expenditures indicated the coefficient of HCBS expenditures for childless seniors. Because the independent variable was the natural logarithm of per capita state HCBS expenditures, it was easier to interpret the coefficient (−.346) than the hazard ratio (.7076). A 100% increase in state per capita HCBS expenditures would be associated with a 34.6% decrease in the risk of nursing home admission.
p ≤ .05.
p ≤ .01 (two tailed).
Not surprisingly, having greater family resources (being currently married, having a younger spouse, living close to or with children) significantly reduced the risk of nursing home admission. However, none of the spouse health variables nor sibling availability had significant effects on admission.
Regarding individual-level variables, as expected, higher age, higher education, worse self-rated health, and lower physical and cognitive functioning significantly increased the risk of nursing home admission. Being African American, being Hispanic, or being in the high wealth group (as opposed to the low wealth group) reduced risk of admission. Income, Medicaid, LTC insurance that covered nursing home care, and nursing home bed availability did not have any significant effects on admission. Linear and quadratic time variables were highly significant, indicating that the hazard of nursing home admission increased with time, but at a decreasing rate.
Do State HCBS Effects Depend on Family Availability?
We ran models including interaction terms involving a state-level HCBS variable and each family resource variable that had been significant in the main-effects models. The analysis revealed that the effects of state HCBS expenditures depended on the availability of children (Table 4, Model 3) but not on other family resources. As shown in Figure 1, for seniors with no living children (12% of the sample), higher state HCBS expenditures were associated with a lower risk of nursing home admission. State HCBS expenditures, however, had little impact on the risk among those who lived with or close to children and among those who had children but not nearby (59% and 29% of sample, respectively). Tests of effects within child availability categories indicated that HCBS expenditures had a statistically significant association with the hazard of nursing home admission for childless seniors: The coefficient of state HCBS expenditures for childless seniors, −0.346 (p < .001), suggests that a 100% increase in HCBS per capita expenditures would be accompanied by a 34.6% reduction in the risk of nursing home admission. None of the family variables that had been significant in the main-effects models had statistically significant interactions with percentage of LTC expenditures spent on HCBS.
Figure 1.
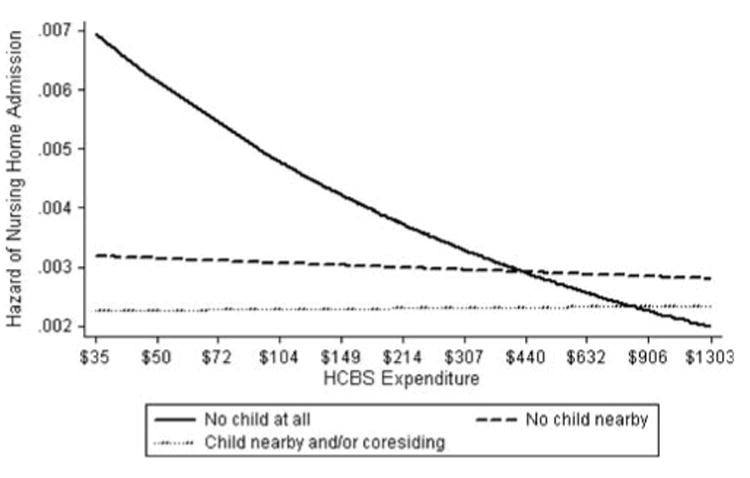
Effects of state home- and community-based services (HCBS) expenditures on the hazard of nursing home admission by child availability. The x axis indicates a log scale of the level of states' annual expenditures on HCBS per person 65 years and older, ranging from $35 (the lowest level among the states in the sample) to $1,303 (the highest). The decile points of the log scale are indicated in exponentiated dollar amounts. The y axis indicates the estimated hazard of nursing home admission. The hazard was calculated for the “average” case based on the complementary log-log model presented in Table 4, fixing the values of independent variables at mean levels for continuous variables and 0 for dichotomous variables. “Child nearby” indicates whether a respondent had any child living within 10 miles. In 1995 interviews, 12.0% of respondents had no child, 28.9% had child(ren) living more than 10 miles away, and 59.1% lived with child(ren) or within 10 miles of child(ren).
Partitioning Variance at State and Person Levels
Multilevel models (results not shown) indicated that, although the variation of nursing home admission was mainly at the individual level, a small but statistically significant proportion of the variation of nursing home admission was between states. A two-level complementary log-log model without any independent variables indicated that the percentage of variation of nursing home admission at the state level (also known as intraclass correlation) was 2.1%, which is fairly small but not uncommon for health-related outcomes. Once we entered individual-level variables in the model, the proportion of variance between states increased to 3.3%. This state-level variance was the maximum variance explainable by any state-level variables.
Discussion
Based on the premise that HCBS allow disabled older adults to live in the community, we tested two hypotheses: (a) Living in a state with a high financial commitment to HCBS would delay or prevent nursing home admission, and (b) the HCBS effects would be larger for those individuals with less family caregiving resources. The main effects of state HCBS variables were not statistically significant, but they were in the expected direction. Thus, our first hypothesis was not supported for “average” seniors. The interaction effects models, however, indicated that state HCBS effects depended on child availability and that living in a state with higher HCBS expenditures was significantly associated with lower risk of nursing home admission among childless seniors. Thus, our second hypothesis was supported with regard to the availability of children. Only 3% of variance in nursing home admission was between states, indicating that state-level factors played relatively small roles.
Nevertheless, the statistically significant finding of state HCBS effects on nursing home admission among childless seniors is important, given the lack of evidence during the past 25 years supportive of increasing state HCBS spending. Previous studies, mainly based on experimental research on the effects of enhanced HCBS compared with usual care during the late 1970s and early 1980s, have provided little or limited support for the expected effects of HCBS on preventing or delaying nursing home admission (Doty, 2000; Kemper, 1988; Weissert, Cready, & Pawelak, 1988; Wooldridge & Schore, 1988). These studies were conducted in LTC settings more than 20 years ago and did not address the effects of recent emerging state variation in HCBS commitment on nursing home risk. Over time, states' spending on HCBS has increased, especially in Medicaid HCBS waiver programs, mainly because of institutional forces, such as pressures to conform to the Olmsted decision (Rosenbaum, 2000) and to meet desires of disabled persons to live in a community setting. Although our nonexperimental study design limits our ability to make causal statements, we find encouraging evidence for increasing state support for HCBS. We believe that we are the first to demonstrate that in the general U.S. population the effects of HCBS are conditional on family caregiving resources.
There are several limitations to our study. This analysis focused only on first long-term nursing home admission. Although 54% of respondents who had had any long-term nursing home admission had had only one, the rest had experienced two to four. Although we recognize the importance of treating nursing home admission as a repeatable event, such analysis is beyond the scope of this study. A sensitivity analysis (results not shown) indicated that coefficients for HCBS variables were similar whether we used a liberal definition (first nursing home admission, including short stays) or a restrictive definition (permanent nursing home admission at the end of life); the use of a more restrictive definition produced higher significance levels. Thus, we believe that the findings presented here are rather robust.
Our final analytic sample constituted 83% of respondents at risk for first long-term nursing home admission as of 2005. We had to exclude a large number of respondents mainly because they had gaps in surveys. Side analysis revealed that excluded individuals were sicker than those included in the analytic sample (results not shown). Specifically, those who missed the 1995 survey and those who had gaps in subsequent surveys had lower survival rates as of 2002 (37% and 43%, respectively) than those included in the analytic sample (60%). Those who missed the 1995 survey had significantly poorer health status at the 1993 baseline, although the three groups were comparable in terms of other characteristics represented in the model. Given this sample bias, our results may have underestimated the rate of nursing home admission. Furthermore, a prior study indicates that state LTC contexts have larger effects on disabled elders than on nondisabled elders (Muramatsu & Campbell, 2002). Thus, we may have underestimated the effect of state HCBS expenditures on nursing home admission.
Our sample did not include all 50 states. Under the complex HRS sample design, 12 states with large metropolitan areas were included with certainty. The rest were represented in the baseline sample according to a multistage area probability sample design with selection proportional to the size of primary stage units. Side analyses indicated that states included in the sample had higher HCBS expenditures than states not included in the sample. The implications of this are difficult to assess.
Although an expenditure-based HCBS commitment measure such as the one we used has a major advantage of capturing overall state efforts dispersed across various programs, it has limitations. Financial support is only one aspect (albeit an important one) of state commitment to HCBS. The measure does not capture states' effectiveness and efficiency when using HCBS resources. Nor does it allow for examination of specific state policies such as eligibility criteria, certificates of need for alternative LTC services, or targeting and reimbursement policies. One might argue that levels of LTC funding are endogenous to the demand for, or use of, LTC services. This argument can be made for total state-level LTC expenditures, in that they are determined by the total quantity of services used, which is largely a function of the size and characteristics of the eligible population and the price of each service used. However, we were interested in how much of the total LTC funding was allocated to HCBS, rather than to its alternatives. Policy decisions with regard to levels of HCBS funding are choices that are made, at least partly, in light of value judgments and total cost assumptions and should not be driven solely or even primarily by exogenous demand.
The recent growth of alternatives to traditional nursing homes and private homes (e.g., assisted living) poses a challenge for modeling LTC transitions. Because of data limitations and the inherent difficulties of identifying a clear typology of alternative care settings (Spillman & Black, 2006), we were unable to model such alternatives as competing risks.
Facing Medicaid spending growth (Smith et al., 2005) and tight state budgets (Hoadley, Cunningham, & McHugh, 2004), states may limit access to HCBS programs (Kitchener, Ng, Miller, & Harrington, 2005). Our research provides modest but important empirical evidence that state HCBS support may prevent or delay nursing home admission for those with limited family caregiving resources. Per capita HCBS expenditures and the proportion of HCBS spending in total LTC expenditures, which we examined, have been used by some states as indices of their progress toward rebalanced LTC systems. It is important to follow up on the current study and monitor the effects of these indices on nursing home use. States should continue their efforts to invest in HCBS and additionally organize services to enhance access to and quality of LTC services. However, the issue of how to allocate HCBS resources within each state requires careful consideration about fairness as well as cost effectiveness. Targeting HCBS resources to seniors without children would penalize those with children such that these seniors would have to continue to depend on their children, who would be locked into caregiving roles. Given the decrease in the number of children ever born to women (U.S. Census Bureau, 2005) and the increase in labor participation among women, experts expect the caregiving burden on each adult child to grow. Furthermore, current LTC policy and practices assume family responsibility for elder care, and many states target limited LTC resources to those in most need based on level of disability, family income, and family availability (Montgomery, 1999). To the extent that state support for HCBS is targeted to those who lack family, our finding of nonsignificant HCBS effects among seniors with children might be the reflection of such targeting, rather than noneffectiveness of state HCBS support among this population. Lack of information on existing targeting policies and practices prevents us from exploring this issue.
Aging occurs not only in one's most immediate environment, the family, but also in larger societal and policy contexts that change over time. The role of formal LTC is growing as changing demographic, economic, and political forces are reshaping family structures and functions in an increasingly diversified U.S. society (Angel, Angel, Aranda, & Miles, 2004). Family availability reduces nursing home utilization, and family function may differ across gender and ethnic subcultures (Freedman, 1993, 1996). Our findings provide initial evidence of interaction between family and state LTC contexts, calling for further research. Over the past decade there has been a clear advancement in U.S. LTC policy: Expanding HCBS has become a goal for almost all states, and many states are expanding consumer-directed and residential care. However, almost all public LTC services in the United States remain as means-tested with the implicit or explicit assumption that family should bear primary responsibility for elder care. Yet faced with rapid population aging and serious concerns about increasing caregiving burden, other societies such as Japan have committed themselves to universal and equitable access to LTC regardless of socioeconomic status or family availability. As the large baby boom cohort becomes caregivers for their parents while needing LTC services themselves, federal and state governments will be increasingly pressed to decide not only how to finance and organize LTC but also how to allocate limited LTC resources. Further research on state and national LTC policies, especially those related to targeting and eligibility, and their effects on seniors and their families should help the United States develop a sound vision and plan future LTC systems.
Acknowledgments
Earlier versions of this article were presented at the Health and Retirement Study Research Conference on Older Families, Santa Fe, New Mexico, February 27–28, 2004, and at the 17th Annual Scientific Meeting of the Gerontological Society of America, Washington D.C., November 19–23, 2004, The research reported here was supported by the National Institute on Aging (R01 AG021648). The authors thank three anonymous reviewers; Paul D. Allison and Jeremy Freese for their assistance on statistical issues; Willard L. Rodgers for his helpful input regarding HRS data issues; Brian Burwell, Charlene Harrington, and other people at various agencies and organizations for their help in our state data compilation process; and Robert L. Kane, Kenneth M. Langa, Douglas A. Wolf, and Marshall H. Chin for their feedback and insights on earlier versions of this article.
References
- Administration on Aging. 1995 State program report for Titles III and VII of the Older Americans Act. Washington, DC: U.S. Department of Health and Human Services; 1995a. [Google Scholar]
- Administration on Aging. Infrastructure of home and community based services for the functionally impaired elderly: State source book. Washington, DC: U.S. Department of Health and Human Services; 1995b. [Google Scholar]
- Administration on Aging. 1996 State program report for Titles III and VII of the Older Americans Act. Washington, DC: U.S. Department of Health and Human Services; 1996. [Google Scholar]
- Administration on Aging. Titles III and VII state program reports. http://www.aoa.gov/prof/agingnet/NAPIS/SPR/spr_reports.asp 2004 Retrieved October 1, 2004, from.
- Allison PD. Survival analysis using the SAS system: A practical guide. Cary, NC: SAS Institute; 1995. [Google Scholar]
- Allison PD. Missing data. Thousand Oaks CA: Sage; 2002. [Google Scholar]
- Andersen RM. Revisiting the behavioral model and access to medical care: Does it matter? Journal of Health and Social Behavior. 1995;35:1–10. [PubMed] [Google Scholar]
- Andersen RM, Newman JF. Societal and individual determinants of medical care utilization in the United States. Milbank Fund Quarterly. 1973;51:95–124. [PubMed] [Google Scholar]
- Angel JL, Angel RJ, Aranda MP, Miles TP. Can the family still cope? Social support and health and determinants of nursing home use in the older Mexican-origin population. Journal of Aging & Health. 2004;16:338–354. doi: 10.1177/0898264304264203. [DOI] [PubMed] [Google Scholar]
- Aykan H. Do state Medicaid policies affect the risk of nursing home entry among the elderly? Evidence from the AHEAD study. Research on Aging. 2002;24:487–512. [Google Scholar]
- Banaszak-Holl J, Fendrick AM, Foster NL, Herzog AR, Kabeto MU, Kent DM, et al. Predicting nursing home admission: Estimates from a 7-year follow-up of a nationally representative sample of older Americans. Alzheimer Disease & Associated Disorders. 2004;18(2):18–39. doi: 10.1097/01.wad.0000126619.80941.91. [DOI] [PubMed] [Google Scholar]
- Boaz RF, Muller CF. Predicting the risk of “permanent” nursing home residence: The role of community help as indicated by family helpers and prior living arrangements. Health Services Research. 1994;29(4):391–414. [PMC free article] [PubMed] [Google Scholar]
- Bureau of Health Professions. Area resource file. Rockville, MD: U.S. Department of Health and Human Services; 2003. [Google Scholar]
- Burwell B. Medicaid Long Term Care Expenditures in FY 2000. http://www.hcbs.org/moreInfo.php/nb/doc/130/Medicaid_Long_Term_Care_Expenditures,_FY2000. 2001a doi: 10.1093/geront/41.5.687. Retrieved March 13, 2007, from. [DOI] [PubMed]
- Burwell B. Medicaid HCBS waiver expenditures, FY1995–2000. http://www.hcbs.org/moreInfo.php/type_tool/129/ofs/10/doc/127/Medicaid_HCBS_Waiver_Expenditures,_FY1995-2000 2001b Retrieved February 13, 2004, from.
- Burwell B. Medicaid Long Term Care Expenditures, FY2002. http://www.hcbs.org/moreInfo.php/nb/doc/120/Medicaid_Long_Term_Care_Expenditures,_FY2002. 2003a doi: 10.1093/geront/41.5.687. Retrieved March 13, 2007, from. [DOI] [PubMed]
- Burwell B. Medicaid HCBS waiver expenditures, FY1997–2002. http://www.hcbs.org/moreInfo.php/nb/doc/122/Medicaid_HCBS_Waiver_Expenditures,_FY1997-2002 2003b Retrieved March 13, 2007, from.
- Cagney K, Agree EM. Racial differences in skilled nursing care and home health use: The mediating effects of family structure and social class. Journal of Gerontology: Social Sciences. 1999;54B:S223–S236. doi: 10.1093/geronb/54b.4.s223. [DOI] [PubMed] [Google Scholar]
- Centers for Medicare and Medicaid Services. Provider of services file, 1995–2002. Baltimore, MD: U.S. Department of Health and Human Services; 1995–2002. [Google Scholar]
- Cohen MA. Private long-term care insurance: A look ahead. Journal of Aging and Health. 2003;15:74–98. doi: 10.1177/0898264302239015. [DOI] [PubMed] [Google Scholar]
- Cox DR, Oakes D. Analysis of survival data. London: Chapman & Hall; 1984. [Google Scholar]
- Doty P. Cost-effectiveness of home and community-based long-term care services. Washington, DC: U.S. Department of Health and Human Services; 2000. [Google Scholar]
- Fisher L, Lieberman MA. A longitudinal study of predictors of nursing home placement for patients with dementia: The contribution of family characteristics. The Gerontologist. 1999;39:677–686. doi: 10.1093/geront/39.6.677. [DOI] [PubMed] [Google Scholar]
- Freedman VA. Kin and nursing home lengths of stay: A backward recurrence time approach. Journal of Health and Social Behavior. 1993;34(2):138–152. [PubMed] [Google Scholar]
- Freedman VA. Family structure and the risk of nursing home admission. Journal of Gerontology: Social Sciences. 1996;51B:S61–S69. doi: 10.1093/geronb/51b.2.s61. [DOI] [PubMed] [Google Scholar]
- Gaugler JE, Edwards AB, Femia EE, Zarit SH, Stephens MA, Townsend A, et al. Predictors of institutionalization of cognitively impaired elders: Family help and the timing of placement. Journal of Gerontology: Psychological Sciences. 2000;55B:P247–P255. doi: 10.1093/geronb/55.4.p247. [DOI] [PubMed] [Google Scholar]
- Gaugler JE, Kane RL, Kane RA, Clay T, Newcomer R. Caregiving and institutionalization of cognitively impaired older people: Utilizing dynamic predictors of change. The Gerontologist. 2003;43:219–229. doi: 10.1093/geront/43.2.219. [DOI] [PubMed] [Google Scholar]
- Greene VL, Ondrich JI. Risk factors for nursing home admissions and exits: A discrete-time hazard function approach. Journal of Gerontology: Social Sciences. 1990;45:S250–S258. doi: 10.1093/geronj/45.6.s250. [DOI] [PubMed] [Google Scholar]
- Hoadley JF, Cunningham P, McHugh M. Popular Medicaid programs do battle with state budget pressures: Perspectives from twelve states. Health Affairs. 2004;23(2):143–154. doi: 10.1377/hlthaff.23.2.143. [DOI] [PubMed] [Google Scholar]
- Jette AM, Tennstedt S, Crawford S. How does formal and informal community care affect nursing home use? Journal of Gerontology: Social Sciences. 1995;50B:S4–S12. doi: 10.1093/geronb/50b.1.s4. [DOI] [PubMed] [Google Scholar]
- Kane RA, Kane RL, Ladd RC. The heart of long-term care. New York: Oxford University Press; 1998. [Google Scholar]
- Kane RL, Kane RA, Ladd RC, Veazie WN. Variation in state spending for long-term care: Factors associated with more balanced systems. Journal of Health Politics, Policy and Law. 1998;23(2):364–390. doi: 10.1215/03616878-23-2-363. [DOI] [PubMed] [Google Scholar]
- Kassner E, Williams L. Taking care of their own: State-funded home and community-based care programs for older persons. Washington, DC: AARP Public Policy Institute; 1997. [Google Scholar]
- Kemper P. The evaluation of the national long term care demonstration: Overview of findings. Health Services Research. 1988;23(1):161–174. [PMC free article] [PubMed] [Google Scholar]
- Kersting RC. Impact of social support, diversity, and poverty on nursing home utilization in a nationally representative sample of older Americans. Social Work in Health Care. 2001;33(2):67–87. doi: 10.1300/J010v33n02_05. [DOI] [PubMed] [Google Scholar]
- Kitchener M, Ng T, Miller N, Harrington C. Medicaid home and community-based services: National program trends. Health Affairs. 2005;24(1):206–212. doi: 10.1377/hlthaff.24.1.206. [DOI] [PubMed] [Google Scholar]
- Ladd RC, Kane RL, Kane RA. State LTC profiles report, 1996. Minneapolis: University of Minnesota; 1999. [Google Scholar]
- Ladd RC, Kane RL, Kane RA, Nielsen WJ. State LTC profiles report. Minneapolis: University of Minnesota; 1995. [Google Scholar]
- Laditka SB. Modeling lifetime nursing home use under assumptions of better health. Journal of Gerontology: Social Sciences. 1998;53B:S177–S187. doi: 10.1093/geronb/53b.4.s177. [DOI] [PubMed] [Google Scholar]
- Langa KM, Chernew ME, Kabeto MU, Herzog AR, Ofstedal MB, Willis RJ, et al. National estimates of the quantity and cost of informal caregiving for the elderly with dementia. Journal of General Internal Medicine. 2001;16(11):770–778. doi: 10.1111/j.1525-1497.2001.10123.x. [DOI] [PMC free article] [PubMed] [Google Scholar]
- Liu K, McBride T, Coughlin T. Risk of entering nursing homes for long versus short stays. Medical Care. 1994;32:315–327. doi: 10.1097/00005650-199404000-00001. [DOI] [PubMed] [Google Scholar]
- Miller EA, Weissert WG. Predicting elderly people's risk for nursing home placement, hospitalization, functional impairment, and mortality: A synthesis. Medical Care Research and Review. 2000;57(3):259–297. doi: 10.1177/107755870005700301. [DOI] [PubMed] [Google Scholar]
- Miller SC, Prohaska TR, Furner SE, Freels S, Brody JA, Levy PS. Time to nursing home admission for persons with Alzheimer's disease: The effect of health care system characteristics. Journal of Gerontology: Social Sciences. 1998;53B:S341–S353. doi: 10.1093/geronb/53b.6.s341. [DOI] [PubMed] [Google Scholar]
- Montgomery RJV. Family role in the context of long-term care. Journal of Aging and Health. 1999;11:383–416. doi: 10.1177/089826439901100307. [DOI] [PubMed] [Google Scholar]
- Muramatsu N, Campbell RT. State expenditures on home and community based services and use of formal and informal personal assistance: A multilevel analysis. Journal of Health and Social Behavior. 2002;43(1):107–124. [PubMed] [Google Scholar]
- Newman S, Struyk R, Wright P, Rice M. Overwhelming odds: Caregiving and the risk of institutionalization. Journal of Gerontology: Social Sciences. 1990;45:S173–S183. doi: 10.1093/geronj/45.5.s173. [DOI] [PubMed] [Google Scholar]
- Rosenbaum JD. Olmstead v. L.C.: Implications for older persons with mental and physical disabilities. Washington, DC: American Association of Retired Persons; 2000. [Google Scholar]
- Singer JD, Willett JB. Applied longitudinal data analysis. New York: Oxford University Press; 2003. [Google Scholar]
- Smith C, Cowan C, Sensenig A, Catlin A. Health spending growth slows in 2003. Health Affairs. 2005;24(2):185–194. doi: 10.1377/hlthaff.24.1.185. [DOI] [PubMed] [Google Scholar]
- Spillman BC, Black KJ. The size of the long-term care population in residential care: Evidence from three national surveys. http://aspe.hhs.gov/daltcp/reports/2006/3natlsures.htm 2006 Retrieved June 30, 2006, from.
- Stata Corporation. Stata statistical software: Release 9.0. College Station, TX: Author; 2005. [Google Scholar]
- Summer LL, Ihara ES. State funded home and community based service programs for older people. Washington, DC: AARP Public Policy Institute; 2004. [Google Scholar]
- U.S. Census Bureau. Table H2. Distribution of women 40 to 44 years old by number of children ever born and marital status: Selected years, 1970 to 2004. http://www.census.gov/population/socdemo/fertility/tabH2.xls 2005 Retrieved January 20, 2006, from.
- U.S. Department of Health and Human Services, Administration for Children and Families, Office of Community Services. Social Services Block Grant program: Analysis of expenditure and recipient data 1995–1997. Washington, DC: U.S. Government Printing Office; 1999. [Google Scholar]
- U.S. Department of Health and Human Services, Administration for Children and Families, Office of Community Services. Social Services Block Grant program annual report. Washington DC: U.S. Government Printing Office; 2000–2004. [Google Scholar]
- Weissert WG, Cready CM, Pawelak JE. The past and future of home and community-based long-term care. Milbank Quarterly. 1988;66(2):309–388. [PubMed] [Google Scholar]
- Winship C, Radbill L. Sampling weights and regression analysis. Sociological Methods and Research. 1994;23:230–257. [Google Scholar]
- Wooldridge J, Schore J. The effect of channeling on the use of nursing homes, hospitals, and other medical services. Health Services Research. 1988;23(1):119–127. [PMC free article] [PubMed] [Google Scholar]