

Abstract
We present a novel confocal microscope that has dual-axis architecture and biaxial postobjective scanning for the collection of fluorescence images from biological specimens. This design uses two low-numerical-aperture lenses to achieve high axial resolution and long working distance, and the scanning mirror located distal to the lenses rotates along the orthogonal axes to produce arc-surface images over a large field of view (FOV). With fiber optic coupling, this microscope can potentially be scaled down to millimeter dimensions via microelectromechanical systems (MEMS) technology. We demonstrate a benchtop prototype with a spatial resolution ≤4.4 μm that collects fluorescence images with a high SNR and a good contrast ratio from specimens expressing GFP. Furthermore, the scanning mechanism produces only small differences in aberrations over the image FOV. These results demonstrate proof of concept of the dual-axis confocal architecture for in vivo molecular and cellular imaging.
Keywords: confocal, microscope, fluorescence, molecular biology, imaging, in vivo
1 Introduction
Confocal microscopy is a powerful tool for imaging in biological tissue, and can be used in vivo if the lenses and scanning mechanisms can be made sufficiently small. This method performs optical sectioning in a highly scattering media with subcellular resolution, a high signal-to-noise ratio (SNR), and a good contrast ratio,1 an achievement not easily matched by any other imaging modality. Also, molecular structures can be identified by fluorescence markers to reveal previously unobservable details about biological processes in vivo. In addition, a microscope implanted in an animal model can perform longitudinal studies over time, thus preserving experimental continuity and reducing the number of sacrificed animals. Currently, in vivo confocal imaging is performed on exposed tissue surfaces such as that of skin or from tissue exposed surgically.2–6 Internal access to tissue is limited by the large physical dimensions of conventional microscopes objectives. A numerical aperture (NA) of at least 0.75 is required to achieve an axial resolution of a few micrometers, the dimensions necessary to resolve molecular and subcellular structures.7 In the conventional single-axis configuration, the same lens is used for illumination and image collection, and the optics cannot be reduced to millimeter scale without sacrificing resolution, field of view (FOV), or working distance (WD). Also, because the scanning mechanism is located proximal to the objective, multiple optical elements are required to correct for aberrations and achieve high performance. Furthermore, the use of standard objectives in vivo is rather cumbersome.
Previously, a laser scanning confocal microscope with single axis configuration has been miniaturized with micro-electromechanical systems (MEMS) technology.8,9 This instrument uses a single-mode optical fiber as the pinhole, and the optical path is folded into a zigzag pattern by a silicon spacer coated with reflective surfaces, resulting in a scanhead size of 1.2×2.5×6.5 mm. The axial resolution of 18 μm was not adequate for in vivo use, and the binary lens objective was too dispersive to collect fluorescence. We previously described the dual-axis architecture and demonstrated proof of concept with reflectance images.10 Also, we have shown the ability of the dual-axis configuration to differentiate against noise from scattering over a depth of 1 mm using illumination at 1345 nm. These reflectance images were vertical cross sections collected perpendicular to the tissue surface using uniaxial postobjective scanning,11 and were achieved with low-coherence heterodyne detection. We now demonstrate fluorescence (noncoherent) images collected in horizontal crosssections parallel to tissue surface using biaxial postobjective scanning.
The collection of fluorescence images in vivo can be used to study transgenic models to answer a diverse range of biological questions.12,13 Molecules can be tagged with fluorescence reporters to enhance the image contrast and reveal details about important biological processes such as cell transport, tumor formation, and development. GFP is an example marker of gene expression and protein targeting in viable cells and organisms. In addition, the distribution of GFP within the cell can be modulated posttranslationally by the biochemical environment and by protein-protein interactions.14 Two or more variants of GFP can be used to provide multiple labels of subcellular processes.15 Furthermore, the combination of two GFPs enable fluorescence energy transfer (FRET) that is sensitive to the orientation and distance on a nanometer scale between two fluorophores.16 These types of processes may be observed in vivo with multiphoton imaging17,18 upon successful development of hollow fibers. In addition, GFP has been used to monitor the development of mammalian embryos19–21 and the development of metastatic tumors.22–24
2 Dual-Axis Architecture
The dual-axis architecture uses separate low-NA objectives for illumination (IO) and collection (CO),25–28 as shown in Fig. 1. The NA of each lens is determined by the angles αi and αc. The point spread function of either objective (gray ovals) has a long axial but narrow transverse dimension. The overall axial resolution of the system is represented by the length of the overlapping region (black oval). The length of this overlap depends primarily on the transverse rather than the axial dimension of the beams at the focus. The illumination beam is incident to the tissue at angle θ, and the fluorescence originating from the overlapping focal volume at the intersection of the two beams, is collected off-axis. As a result, light scattered along the illumination path (checkered region) outside of the focal volume is unlikely to arrive at the collection objective with the proper angle necessary for detection because the correct combination of scattering events required occurs with low probability.11 On the other hand, a standard confocal microscope objective has a single axis and requires a much higher NA to achieve an equivalent axial resolution. As a result, the light collected emerges from within the same large-angle cone (dashed lines) as that traversed by the illumination, thus resulting in increased noise from scattering.
Fig. 1.
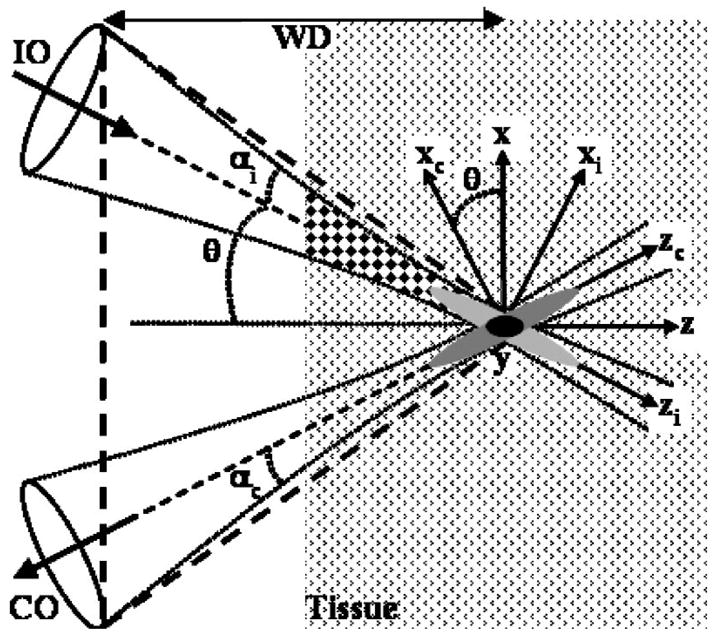
Dual-axis architecture uses separate low-NA objectives for illumination (IO) and collection (CO) at angle θ to the z axis, creating a long WD. The illumination path for dual-axis (checkered region) results in reduced noise from scattered light compared with that from a single axis (area within dashed lines).
3 Biaxial Postobjective Scanning
We use a novel method of scanning whereby the illumination and collection beams pass through their respective objectives on-axis, independent of the angle of the scan mirror, and a single plane biaxial mirror located distal to the objectives is used to steer the beam, as shown in Fig. 2. With the mirror in this location, we define the scanning distance (SD) as the displacement between the mirror surface and the focal volume. Note that this parameter is different from the WD (defined in Fig. 1). In the biaxial mode, the scanning mirror (SM) rotates about both the x and y axes and scans the illumination and collection beams synchronously in a manner such that the intersection of the two axes remains oriented at a constant angle of 2θ. The focal volume remains overlapped and moves without changing shape over an arc surface within the tissue. This feature can be conceptualized by regarding this optical system as being equivalent to the outer annular ring of a high-NA objective illuminated with two parallel collimated beams. The two separate beams are focused with a low NA, and a single plane mirror distal to the objective can steer the beams together and preserve the dimensions of the overlapping focal volume as long as no aberrations are introduced, a good approximation when the maximum angle of deflection during scanning is small compared to θ. Note that it would be difficult to use postobjective scanning with a conventional single axis microscope because of the short WD. Because the two separate beams are incident to the tissue at an angle, a Teflon amorphous fluoropolymer (AF) prism (P), n = 1.31, is placed in the optical path to reduce the aberrations that occur from the beam being incident at an angle to the tissue. Note that because the two beams are not scanned through the objectives, corrective elements are not required proximally, and simple, low-NA lenses that are easy to miniaturize can be used.
Fig. 2.
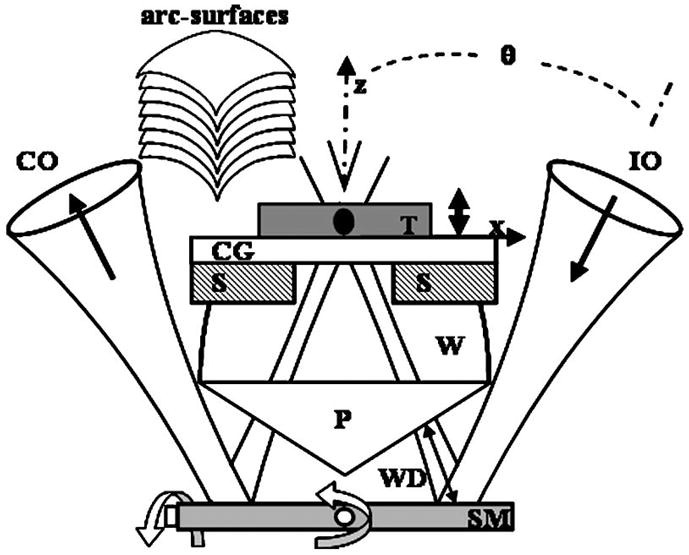
Schematic with the biaxial postobjective SM located distal to objectives to create images along arc-surfaces within tissue (T) placed on a cover glass (CG) that is sitting on a stage (S). The bead of water (W) provides index matching.
4 System Design
We constructed a benchtop prototype with an inverted configuration, as shown by the schematic in Fig. 3. The axes of illumination and collection are oriented at θ = 30 deg to the midline. A frequency-doubled semiconductor laser (Coherent Sapphire) delivers illumination at λ = 488 nm into a single-mode polarization-maintaining (PM) optical fiber SMF1 with a mode field diameter (MFD) of 2.9 μm and NA = 0.11. The polarized light from the fiber is collimated and focused by two gradium lenses L1 (25 mm diameter, focal length f = 60 mm) and L2 (10 mm diameter, f = 30 mm). The illumination aperture of L2 is overfilled to approximate uniform illumination and thereby reduces the illumination spot size. From the expanded view in Fig. 2, the specimen sits on a CG that rests on stage (S) whose height is adjusted by a piezoactuator with submicrometer accuracy. The bead of water (W) reduces the mismatch in refractive index in the space between the prism and the tissue. The CG represents a mismatch in refractive index between water and tissue, and introduces aberrations such as coma and astigmatism. To focus deeper into the tissue, we lower the height of the CG, and the space filled with water decreases. Since water and tissue have almost the same refractive index, the total optical path length (OPL) of the illumination and collection beams remains approximately constant, thus avoiding defocus and misalignment of the beams at different imaging depths. The scanning distance of the system beyond the scanning mirror is ~19 mm.
Fig. 3.
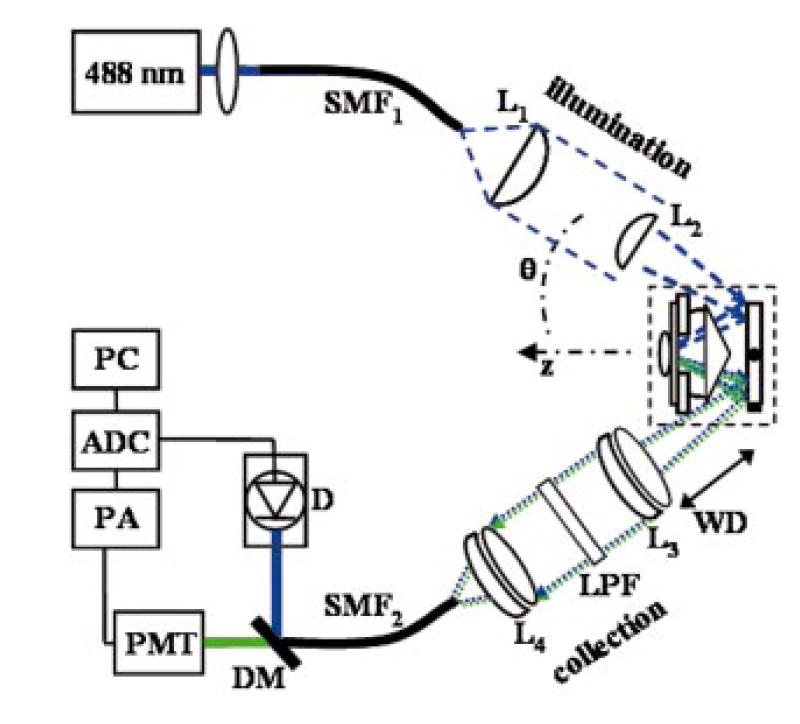
Schematic of dual-axis prototype details are discussed in text.
Biaxial scanning is obtained simultaneously by driving the scan mirror (GSI Lumonics) with a 50-Hz sinusoidal waveform and a 0.1-Hz linear ramp waveform along the fast and slow axes, respectively, resulting in a raster scan having a FOV of ~500 μm after clipping the nonlinear portions at the edges of the sinusoidal scan. The fluorescence generated from the tissue is collected by a pair of achromats L3 and L4 (25 mm diameter, f = 50 mm), which collimate and focus the beam into a second single-mode fiber SMF2 with MFD of 3.4 μm and NA = 0.11. A long-pass filter (LPF) with a sharp cutoff at 505 nm blocks the excitation light, and fluorescence is detected by the photomultiplier tube (PMT, Electron Tubes 9125SB). The detection bandwidth of the preamp (PA) is 60 kHz, the images are digitized [with an analog-to-digital converter (ADC)] in dc-coupled variable scan mode (Data Translation DT3152) using DT Vision Foundry software to 480 ×480 pixels. The image was centered by adjusting the horizontal synchronization with a digital delay (SRS DG535), and displayed on a computer (PC). By removing the LPF, we can also collect reflectance images that are spatially coregistered with that of the fluorescence images using the dichroic mirror (DM) and silicon detector (D).
5 Materials and Methods
5.1 Biaxial Scanning
The fluorescence images were collected with the specimen placed in a single well-chambered CG made from #1 German borosilicate (~160 μm thick). The power incident on the specimen was ~500 μW. Each image was collected in 10 s, and averaged over nine frames to improve the SNR. Images were collected over a range of axial depths by adjusting the piezoactuator. The SNR at a given point in the image was determined by taking a ratio of the mean intensity and the standard deviation of the surrounding 3×3-pixel array. The contrast ratio between two regions of tissue was determined by dividing the mean intensity of three sites in one region with that of three sites in the other.
The effect of aberrations created by biaxial postobjective scanning was calculated by ray trace analysis of the illumination half of the optical system using Zemax, an optical modeling software. In this simulation, rays of light at wavelength λ = 488 nm emerge from the single-mode illumination fiber as a spherical wavefront over a range of angles spanning the fiber NA. The SM is deflected ±0.5 deg in either direction to deflect the beam over a FOV of 600×600 μm2. After collimation and focusing, the converging rays pass through the air, 3 mm of the Teflon AF prism, 1 mm of water, a 160-μm CG, and finally through 300 μm of tissue before coming to a focus (see Fig. 2). The deviation of the aberrated wavefront from an ideal spherical wavefront is calculated at nine positions arranged in a 3×3 array of object illumination points in the x and y directions spanning the FOV of the image. The wavefront aberration at each point is defined as the peak-to-valley, or worst, deviation from the ideal spherical wavefront at the exit pupil of the optical system.
5.2 DSH-293 GFP Cells
Stable cell lines of DSH-293 cells were first transfected with an enhanced GFP (S65T) reporter expressed from a cytomeglovirus (CMV) promotor on a plasmid containing a neomycin resistance gene.29 After transfection via lipofectamine (Invitrogen Life Technologies) per manufacturer’s recommendations, transfected cells were selected in G418 and sorted by fluorescence-activated cell sorter (FACS) for fluorescence intensity. A monolayer of cells was grown on a chambered CG, and covered with media. In the dual-axis, the illumination intensity (energy per unit volume) Was ~0.3 mJ/μm3. For purposes of comparison, fluorescence images were also collected with a conventional single-axis confocal microscope (Bio-Rad MRC 1024) using a 1.2-NA oil immersion lens. This objective has transverse and axial resolutions of 0.4 and 0.9 μm, respectively, and a WD of ~100 μm. A neutral density filter was used to adjust the excitation power at 488 nm to ~500 μW, and the frame collection time was 1 s. These parameters resulted in an intensity of ; ~3 mJ/μm3.
5.3 Transgenic GFP Mouse Model
A transgenic mouse that expresses GFP under the control of a β-actin-CMV promoter-enhancer30 was sacrificed, and the cerebellum was excised and divided sagitally on either side of the vermis. The cortex was placed face down on the cover glass and covered with a drop of fluorescence mounting medium (Vectashield) for index matching. Horizontal scans were collected at increasing axial depths up to ~100 μm, beyond which no signal was detected. On completion of imaging, the specimen was immersed in 10% formalin and processed for standard histology. Similarly, skeletal muscle was excised from the quadriceps of the transgenic mouse model, and placed on the chambered CG and covered with Vectashield. Horizontal scans were collected up to an axial depth of ~200 μm.
5.4 GFP Drosophila Embryos
Fluorescence images from Drosophila melanogaster embryos that expressed the engrailed gene labeled with GFP, a marker of developmental regulation,31 were also collected. Engrailed is driven by the UAS/GAL4 promoter-enhancer system, and is expressed as stripes on the outer surface of the embryo.32 Embryos in stages 10 and 11 were rinsed with tap water, and then soaked in 50% bleach to remove the chorion. Live embryos were then placed on the chambered CG with a drop of Vectashield. The embryos are cylindrical in shape with dimensions of ~200 μm in diameter by ~500 μm in length. A series of transverse 2-dimensional (2-D) scans were collected at increasing axial depths in 10-μm increments through the thickness of the embryo, and 3-dimensional (3-D) reconstructed images were created using Amira volume modeling software. Fluorescence images were also collected with a conventional single-axis confocal microscope (Bio-Rad MRC 1024) for comparison.
6 Results
6.1 Biaxial Scanning
The wavefront aberration (WA) calculated for the array of object illumination points at the nine representative scan positions given by x and y coordinates of −300, 0, and 300 μm is shown in Table 1. The results reveal that the WA increases in the −x direction (from 0.74λ to 0.96λ in the outer rows and from 0.81λ to 1.04λ in the center row), and decreases in the x direction. Furthermore, the WA increases as the beam moves along either the y or −y direction, but not to the same extent as that along the x direction. The maximum difference in the WA for any two points is 0.30λ, thus biaxial postobjective scanning does not produce significant differences over the image FOV. The relative aberrations induced by the changing scan angle can be seen in the reflectance image of a standard resolution test chart, shown in Fig. 4. The set of horizontal bars resolved by scanning in the yz plane (arrow) appear sharper and narrower than the vertical bars, which are resolved by scanning along the xz plane (arrowhead). The smallest group of parallel bars oriented in either direction can be resolved, representing a transverse resolution better than 4.4 μms. Note also that the reflected intensity is most prominent near the center of the image than in the periphery. This effect is produced by the intersection of the arc surface produced by biaxial postobjective scanning with the plane surface of the test chart.
Table 1.
WAs as a fraction of λ for an array of points spanning the image FOV.
|
x |
|||
|---|---|---|---|
| y | −300 | 0 | 300 |
| −300 | 1.04 | 0.91 | 0.81 |
| 0 | 0.96 | 0.84 | 0.74 |
| 300 | 1.04 | 0.91 | 0.81 |
Fig. 4.
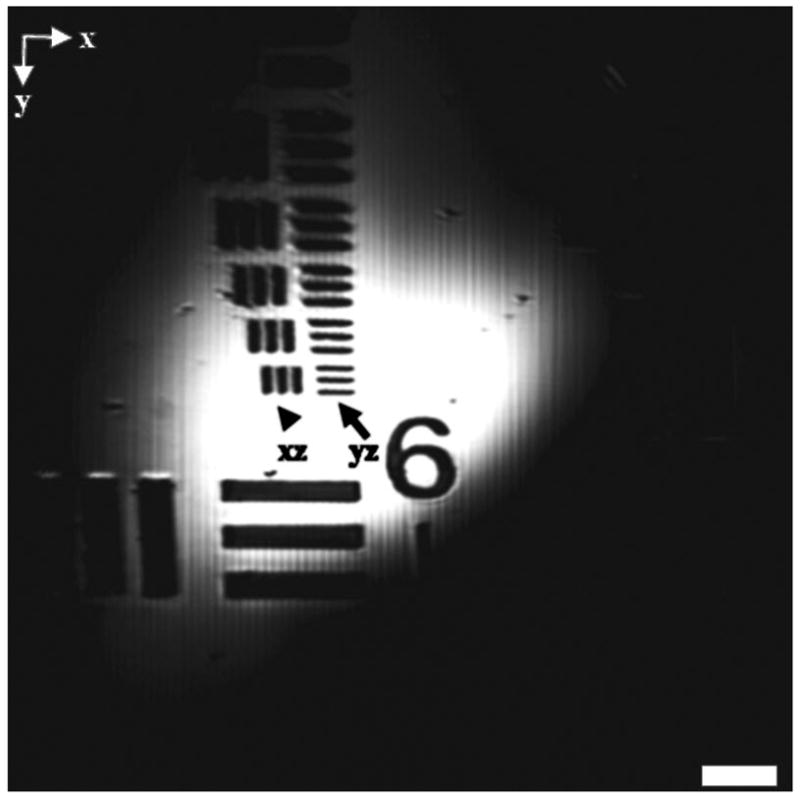
Reflectance image collected with standard resolution test chart (scale bar 50 is μm). Better resolution is observed for scanning in yz plane (arrow) compared to xz plane (arrowhead). The bright region in the center is created by intersection of arc surface with plane target.
6.2 DSH-293 Cells Expressing GFP
A fluorescence image of a monolayer of DSH-293 cells expressing GFP is shown in Fig. 5. The cytoplasm appears bright and the cell has sharp borders. The nuclei (arrows) Can be distinguished by the relative absence of fluorescence. The SNR of the cytoplasm is 13±5, and the contrast ratio between the cytoplasm and nuclei is 1.6. Fluorescence images were also collected from these cells with the single-axis confocal microscope, and resulted in an SNR of 12±6 from the cytoplasm, and a contrast ratio between the cytoplasm and nuclei of 1.8. However, because low-NA lenses are used with dual-axis, the illumination intensity and light collection efficiency are not as high, and longer integration times are required. There was no evidence of photobleaching at these fluences for either microscope. A comparison of the image parameters between the dual-axis and single-axis microscopes is shown in Table 2.
Fig. 5.
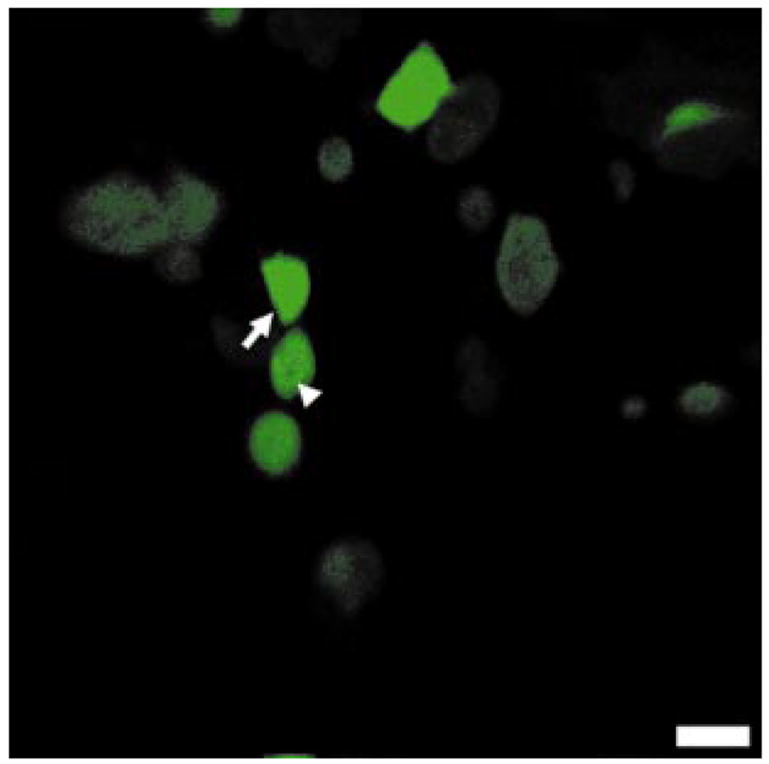
Fluorescence image of DSH-293 cell monolayer demonstrates high SNR and resolution. Nuclei (arrowhead) and cell borders (arrow) can be distinguished; FOV is 500 μm and scale bar is 50 μm.
Table 2.
Comparison of the performance between the dual-axis and single axis confocal microscopes.
| Parameter | Dual Axes | Single Axis |
|---|---|---|
| NA | 0.11 | 1.2 |
| Power (mW) | 0.50 | 0.50 |
| Collection time (s) | 90 | 1.0 |
| Resolution (μm) | 4 | 0.4 |
| SNR | 13±5 | 12±6 |
| Contrast ratio | 1.6 | 1.8 |
| Distance (mm) | 19 | 0.1 |
6.3 Transgenic GFP Mouse Model
A fluorescence image collected from mouse cerebellum at a depth of z = 30 μm is shown in Fig. 6(a). Larger round structures (arrows) with high fluorescence intensity, ~20 μm in diameter, are consistent with Purkinje cell bodies and are seen aligned side by side in a row. The corresponding H&E (hematoxylin and eosin) section shown in Fig. 6(b) shows three layers. The granule (G) layer (upper diagonal half) demonstrates dense cellularity, the intervening Purkinje (P) layer reveals several aligned neuronal cell bodies (arrowheads), and the molecular (M) layer (lower diagonal half) contains relatively few cells. From fluorescence, the SNR for the Purkinje cells and molecular and internal granule layers is 13.1±0.5, 4.4±0.3, and 4.3±0.4, respectively. The contrast ratio between the Purkinje cells and that of the molecular layer and internal granule layer is 3.0 and 3.1, respectively. In addition, fluorescence images of skeletal muscle from the quadriceps at z = 0 and 100 μm are shown in Figs. 7(a) and 7(b), respectively. Individual muscle fibers (arrows) and cell nuclei (arrowheads) can be seen. At z = 0, the SNR of the cytoplasm is 4.8±0.5, and the contrast ratio between the cytoplasm and nuclei is 3.5. At z = 100 μm, the SNR of the cytoplasm is 1.6±0.3. Signal is observed above the noise floor at an axial distance up to ~200 μm.
Fig. 6.
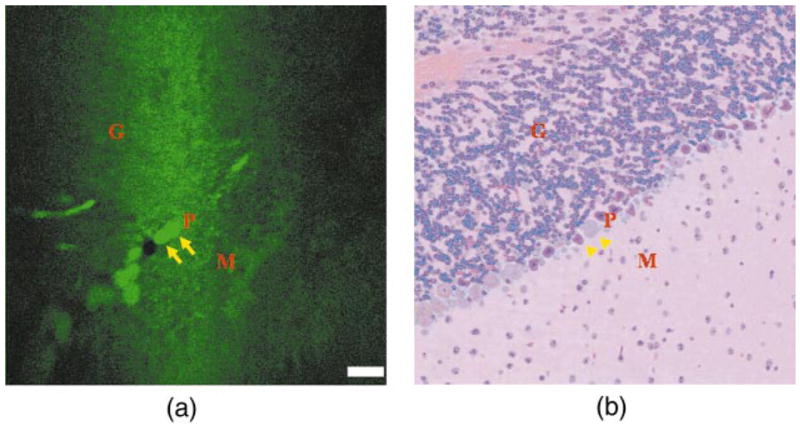
(a) Fluorescence image from mouse cerebellar cortex showing Purkinje (P) cell bodies (arrows) separating the granule (G) and molecular (M) layers where FOV is 500 μm and scale bar is 50 μm, and (b) corresponding H&E section.
Fig. 7.
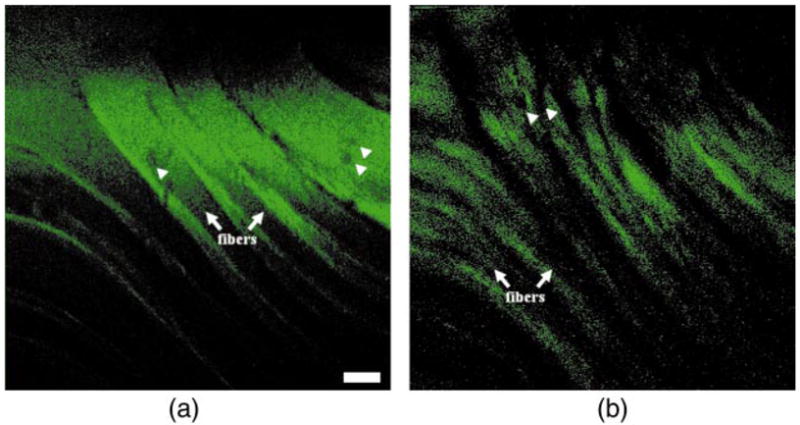
Fluorescence images from mouse quadriceps show nuclei (arrowheads) and muscle fibers (arrows) at axial distance of (a) z = 0 and (b) z = 100 μm, with a scale bar of 50 μm.
6.4 GFP Drosophila Embryos
A fluorescence image collected from a transgenic Drosophila embryo at a depth of z = 100 μm is shown in Fig. 8(a) with a scale bar of 50 μm. There are 14 stripes of engrailed (arrows) with single lines of cells marking the posterior parts of the segments. The posterior midgut (pmg) is seen invaginating from the dorsal (d) and ventral (υ) sides. The SNR of the stripes is 15±3, and the contrast ratio between the stripes and the embryo protoplasm is 115. A 2-D projection of a 3-D reconstructed image from 18 horizontal sections is shown in Fig. 8(b). In the single-axis confocal image [shown in Fig. 8(c)], the stripes of engrailed have similar intensity and are equally spaced. However, in the dual-axis image, the middle stripes (arrows) are more intense and the spacing appears somewhat irregular. These differences occur because the image is collected over an arc surface rather than a plane. These differences can be corrected with appropriate image processing software, if desired. The SNRs and contrast ratios for fluorescence images collected at various depths with the dual-axis prototype are summarized in Table 3.
Fig. 8.
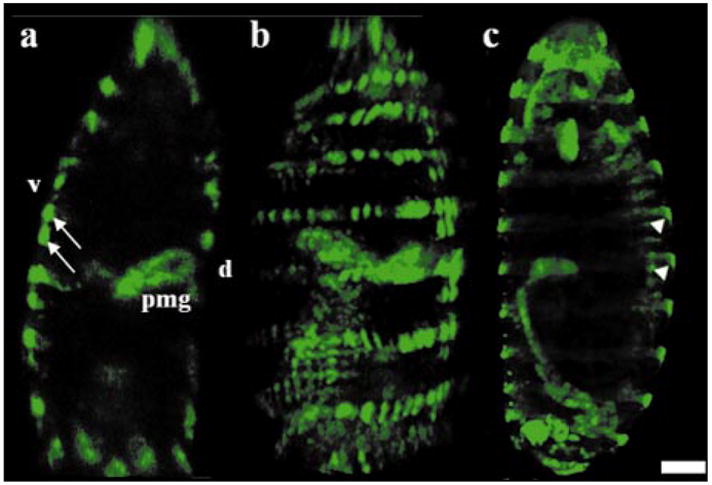
Fluorescence images of Drosophila embryo expressing stripes of engrailed collected at a depth of z = 100 μm with (a) dual axes (arrows) followed by (b) 2-D projection of a 3-D reconstructed image, and (c) single axis confocal microscope (arrowheads); the scale bar is 50 μm.
Table 3.
Summary of SNRs and contrast ratios for the fluorescence collected from several transgenic specimens expressing GFP.
| Parameter | Depth (μm) | SNR | Contrast Ratio |
|---|---|---|---|
| DSH-293 cells | 0 | 13±5 | 1.6 |
| Purkinje cell bodies | 30 | 13.1±0.5 | 3.1 |
| Muscle cells | 0 | 4.8±0.5 | 3.5 |
| Drosophila embryos | 100 | 15±3 | 115 |
7 Discussion
We demonstrated a confocal microscope that collects fluorescence images from biological specimens expressing GFP using low-NA objectives with high resolution, SNR, and contrast ratio with deep tissue penetration over a large FOV. Subcellular structures such as nuclei and cell membranes can be distinguished from cells in a monolayer and within bulk tissue specimens over axial depths of several hundred micrometers. The collection of light off-axis selects against light scattered along the illumination beam, thus reducing the image noise. Combined with fiber optic coupling, this instrument can be reduced in size to millimeter dimensions and used for in vivo collection of fluorescence images in transgenic models. With postobjective scanning, scaling down the dual axes architecture will change the WD and FOV, but not the image resolution. A miniature confocal microscope can be used for in vivo molecular and cellular imaging as a handheld device or as an implanted instrument. The long WD provides greater ease of use for imaging from the surface of the skin or from surgically exposed fields. Also, for longitudinal studies, this instrument can be inserted through an implanted cannula cemented to the outer surface of a transgenic mouse, such as the cranium, and a sterile obturator can be inserted to maintain patency of the cannula when the microscope is not in use. The microscope can be mechanically translated deeper into the tissue to image remote structures. While the imaging performance of the dual-axis does not equal to that of the single-axis instrument, these images along with its suitability for miniaturization demonstrate the potential for in vivo biological investigations.
The biaxial scanning mechanism and the simple objective lenses are the key features that enable scalability of the dimensions. Scanning the illumination and collection beams behind the objectives rather than in front eliminates the need for additional optical elements to correct for off-axis aberrations. Thus, we can use low-NA lenses that are simple to fabricate, low in cost, and easy to miniaturize. Furthermore, the differences in wavefront aberration created by biaxial postobjective scanning are small. The aberrations caused by misalignment are more apparent when scanning the beams across the width of the prism (xz plane) than along its length (yz plane). This occurs because scanning in the xz plane creates a larger misalignment in the overlap of the two beams, as the refraction of the separate beams at the air-prism interface occurs in the opposite direction as opposed to the same. For diffraction-limited performance, we expect the WA<0.25λ at all points in the image; however, we do not achieve this value here because we have used readily available optics to demonstrate the proof of principle of this method. We will use custom optics for diffraction-limited performance in future systems.
Furthermore, a larger residual aberration is seen to exist in the illumination beam that is not associated with the scan position. This is a result of a combination of spherical aberration, coma, and astigmatism. The spherical aberration is caused primarily by the converging beam passing through the several-millimeter-thick layer of Teflon AF and 1 mm of water, and the coma and astigmatism is caused mostly by the 30-deg incidence angle of the beam at the slight refractive index mismatch between the water-Teflon AF interface, and the large index mismatches between the water-CG and CG-tissue interfaces. These aberrations can be improved by custom fabrication of the objective lenses, by using a prism material that is more closely matched to the index of water (n = 1.33), and by eliminating the cover glass, which is not needed in the miniaturized in vivo instrument.
For this technique to be used in vivo in anesthetized animals, we desire the image collection time to be less than 2 s to avoid motion artifacts. The fluorescence images shown were collected in 90 s, an interval that can be reduced significantly by optimizing the system design. To achieve the same SNR as that in the images shown, we can increase the fluorescence detection efficiency by using (1) a PMT with a multialkali rather than bialkali photocathode, increasing the detector quantum efficiency by a factor of ~2 and (2) objective and optical fibers with total collection NA>0.20 (compared to NA = 0.11), gaining a factor of ~4. We can also generate more fluorescence photons by (3) increasing the laser power by a factor of ~2; and (4) decreasing the overfill of illumination aperture, gaining a factor of ~4. These changes alone can increase the fluorescence signal by a factor of ~60. In addition, we can accept images with a lower SNR, and develop novel reporters such as quantum dots that promise significantly greater fluorescence quantum yield.33 We will implement these changes in the future MEMS prototype.
Acknowledgments
We thank Matthew P. Scott and Ljiljana Milenkovic for insightful discussions and Alan Zhu for technical support. This research is supported, in part, by grants from the National Institutes of Health including T32DK07056-27 (T. D. Wang), 1 R43 GM64028-01 (M. J. Mandella), CA88303, CA92862, and CA86312 (C. H. Contag), and unrestricted gifts from the Bio-X Program at Stanford and the Johnson Center for Perinatal Research as part of Lucille Packard Foundation’s Child Health Initiative.
References
- 1.Pawley J, editor. Handbook of Biological Confocal Microscopy. 3. Plenum; New York: 1996. [Google Scholar]
- 2.Anikijenko P, Vo LT, Murr ER, Carrasco J, McLaren WJ, Chen Q, Thomas SG, Delaney PM, King RG. In vivo detection of small subsurface melanomas in athymic mice using noninvasive fiber optic confocal imaging. J Invest Dermatol. 2001;117:1442–1448. doi: 10.1046/j.0022-202x.2001.01592.x. [DOI] [PubMed] [Google Scholar]
- 3.Vo LT, Papworth GD, Delaney PM, Barkla DH, King RG. In vivo mapping of the vascular changes in skin burns of anaesthetised mice by fibre optic confocal imaging (FOCI) J Dermatol Sci. 2000;23:46–52. doi: 10.1016/s0923-1811(99)00089-4. [DOI] [PubMed] [Google Scholar]
- 4.White PJ, Fogarty RD, Liepe IJ, Delaney PM, Werther GA, Wraight CJ. Live confocal microscopy of oligonucleotide uptake by keratinocytes in human skin grafts on nude mice. J Invest Dermatol. 1999;112:887–892. doi: 10.1046/j.1523-1747.1999.00593.x. [DOI] [PubMed] [Google Scholar]
- 5.Vo LT, Papworth GD, Delaney PM, Barkla DH, King RG. A study of vascular response to thermal injury on hairless mice by fibre optic confocal imaging, laser doppler flowmetry and conventional histology. Burns. 1998;24:319–324. doi: 10.1016/s0305-4179(98)00028-x. [DOI] [PubMed] [Google Scholar]
- 6.Bussau LJ, Vo LT, Delaney PM, Papworth GD, Barkla DH, King RG. Fibre optic confocal imaging (FOCI) of keratinocytes, blood vessels and nerves in hairless mouse skin in vivo. J Anat. 1998;192:187–194. doi: 10.1046/j.1469-7580.1998.19220187.x. [DOI] [PMC free article] [PubMed] [Google Scholar]
- 7.Corle TR, Kino GS. Confocal Scanning Optical Microscopy and Related Imaging Systems. Academic Press; Boston: 1996. [Google Scholar]
- 8.Dickensheets DL, Kino GS. Silicon-micromachined scanning confocal optical microscope. J MEMS. 1998;7:38–47. doi: 10.1364/ol.21.000764. [DOI] [PubMed] [Google Scholar]
- 9.Dickensheets DL, Kino GS. A micromachined scanning confocal optical microscope. Opt Lett. 1996;21:764 –766. doi: 10.1364/ol.21.000764. [DOI] [PubMed] [Google Scholar]
- 10.Wang TD, Mandella MJ, Contag CH, Kino GS. Dual-axis confocal microscope for high-resolution in vivo imaging. Opt Lett. 2003;28:414 –416. doi: 10.1364/ol.28.000414. [DOI] [PMC free article] [PubMed] [Google Scholar]
- 11.Wang TD, Contag CH, Mandella MJ, Chan NY, Kino GS. Dual axes confocal microscopy with post-objective scanning and low coherence heterodyne detection. Opt Lett. doi: 10.1364/ol.28.001915. (in press) [DOI] [PMC free article] [PubMed] [Google Scholar]
- 12.Tsien RY. The green fluorescent protein. Annu Rev Biochem. 1998;67:509–544. doi: 10.1146/annurev.biochem.67.1.509. [DOI] [PubMed] [Google Scholar]
- 13.Chalfie M, Tu Y, Euskirchen G, Ward WW, Prasher DC. Green fluorescent protein as a marker for gene expression. Science. 1994;263:802–805. doi: 10.1126/science.8303295. [DOI] [PubMed] [Google Scholar]
- 14.Wysocka A, Krawczyk Z. Green fluorescent protein as a marker for monitoring activity of stress-inducible hsp70 rat gene promoter. Mol Cell Biochem. 2000;215:153–156. doi: 10.1023/a:1026523305294. [DOI] [PubMed] [Google Scholar]
- 15.Baumann CT, Lim CS, Hager GL. Simultaneous visualization of the yellow and green forms of the green fluorescent protein in living cells. J Histochem Cytochem. 1998;46:1073–1076. doi: 10.1177/002215549804600911. [DOI] [PubMed] [Google Scholar]
- 16.Xia Z, Liu Y. Reliable and global measurement of fluorescence resonance energy transfer using fluorescence microscopes. Biophys J. 2001;81:2395–2402. doi: 10.1016/S0006-3495(01)75886-9. [DOI] [PMC free article] [PubMed] [Google Scholar]
- 17.Potter SM, Wang CM, Garrity PA, Fraser SE. Intravital imaging of green fluorescent protein using two-photon laser-scanning microscopy. Gene. 1996;173:25–31. doi: 10.1016/0378-1119(95)00681-8. [DOI] [PubMed] [Google Scholar]
- 18.Mainen ZF, Maletic-Savatic M, Shi SH, Hayashi Y, Malinow R, Svoboda K. Two-photon imaging in living brain slices. Methods. 1999;18:231–239. doi: 10.1006/meth.1999.0776. [DOI] [PubMed] [Google Scholar]
- 19.Zernicka-Goetz M, Pines J. Use of green fluorescent protein in mouse embryos. Methods. 2001;24:55–60. doi: 10.1006/meth.2001.1157. [DOI] [PubMed] [Google Scholar]
- 20.Zernicka-Goetz M, Pines J, McLean Hunter S, Dixon JP, Siemering KR, Haseloff J, Evans MJ. Following cell fate in the living mouse embryo. Development. 1997;124:1133–1137. doi: 10.1242/dev.124.6.1133. [DOI] [PubMed] [Google Scholar]
- 21.Ikawa M, Kominami K, Yoshimura Y, Tanaka K, Nishimune Y, Okabe M. A rapid and non-invasive selection of transgenic embryos before implantation using green fluorescent protein (GFP) FEBS Lett. 1995;375:125–128. doi: 10.1016/0014-5793(95)01162-8. [DOI] [PubMed] [Google Scholar]
- 22.Hoffman RM. Visualization of GFP-expressing tumors and metastasis in vivo. BioTechniques. 2001;30:1016–1026. doi: 10.2144/01305bi01. [DOI] [PubMed] [Google Scholar]
- 23.Hoffman RM. Green fluorescent protein imaging of tumour growth, metastasis, and angiogenesis in mouse models. Lancet. 2002;3:546–556. doi: 10.1016/s1470-2045(02)00848-3. [DOI] [PubMed] [Google Scholar]
- 24.Hasegawa S, Yang M, Chishima T, Miyagi Y, Shimada H, Moossa AR, Hoffman RM. In vivo tumor delivery of the green fluorescent protein gene to report future occurrence of metastasis. Cancer Gene Ther. 2000;7:1336–1340. doi: 10.1038/sj.cgt.7700244. [DOI] [PubMed] [Google Scholar]
- 25.Webb RH, Rogomentich F. Confocal microscope with large field and working distance. Appl Opt. 1999;38:4870–4875. doi: 10.1364/ao.38.004870. [DOI] [PubMed] [Google Scholar]
- 26.Lindek S, Stelzer EHK. Optical transfer functions for confocal theta fluorescence microscopy. J Opt Soc Am A. 1996;13:479–482. [Google Scholar]
- 27.Stelzer EHK, Lindek S, Albrecht S, Pick R, Ritter G, Salmon N, Stricker R. A new tool for the observation of embryos and other large specimens: confocal theta fluorescence microscopy. J Microsc. 1995;179:1–10. [Google Scholar]
- 28.Stelzer EHK, Lindek S. Fundamental reduction of the observation volume in far-field light microscopy by detection orthogonal to the illumination axis: confocal theta microscopy. Opt Commun. 1994;111:536–547. [Google Scholar]
- 29.Heim R, Prasher DC, Tsien RY. Wavelength mutations and posttranslational autoxidation of green fluorescent protein. Proc Natl Acad Sci USA. 1994;91:12501–12504. doi: 10.1073/pnas.91.26.12501. [DOI] [PMC free article] [PubMed] [Google Scholar]
- 30.Hadjantonakis AK, Gertsenstein M, Ikawa M, Okabe M, Nagy A. Generating green fluorescent mice by germline transmission of green fluorescent ES cells. Mech Dev. 1998;76:79–90. doi: 10.1016/s0925-4773(98)00093-8. [DOI] [PubMed] [Google Scholar]
- 31.Yeh E, Gustafson K, Boulianne GL. Green fluorescent protein as a vital marker and reporter of gene expression in Drosophila. Proc Natl Acad Sci USA. 1995;92:7036–7040. doi: 10.1073/pnas.92.15.7036. [DOI] [PMC free article] [PubMed] [Google Scholar]
- 32.Orihara M, Hosono C, Kojima T, Saigo K. Identification of engrailed promoter elements essential for interactions with a stripe enhancer in Drosophila embryos. Genes Cells. 1999;4:205–218. doi: 10.1046/j.1365-2443.1999.00254.x. [DOI] [PubMed] [Google Scholar]
- 33.Chan WC, Nie S. Quantum dot bioconjugates for ultrasensitive nonisotopic detection. Science. 1998;281:2016–2018. doi: 10.1126/science.281.5385.2016. [DOI] [PubMed] [Google Scholar]