

Abstract
The findings on health effects of ambient fine particles (PM2.5) and coarse particles (PM10-2.5) remain inconsistent. In China, PM2.5 and PM10-2.5 are not the criteria air pollutants, and their monitoring data are scarce. There have been no epidemiological studies of health effects of PM2.5 and PM10-2.5 simultaneously in China. We conducted a time series study to examine the acute effects of PM2.5 and PM10-2.5 on daily mortality in Shanghai, China from Mar. 4, 2004 to Dec. 31, 2005. We used the generalized additive model (GAM) with penalized splines to analyze the mortality, air pollution and covariate data. The average concentrations of PM2.5 and PM10-2.5 were 56.4µg/m3 and 52.3µg/m3 in our study period, and PM2.5 constituted around 53.0% of the PM10 mass. Compared with the Global Air Quality Guidelines set by World Health Organization (10µg/m3 for annual mean) and U.S. National Ambient Air Quality Standards (15µg/m3 for annual mean), the PM2.5 level in Shanghai was much higher. We found that PM2.5 was associated with the death rates from all causes and from cardio-respiratory diseases in Shanghai. We did not find a significant effect of PM10-2.5 on mortality outcomes. A10µg/m3 increase in the 2-day moving average (lag01) concentration of PM2.5 corresponded to 0.36% (95%CI 0.11%, 0.61%), 0.41% (95% CI 0.01%, 0.82%) and 0.95% (95% CI 0.16%, 1.73%) increase of total, cardiovascular and respiratory mortality. For PM10-2.5, the effects were attenuated and less precise. Our analyses provide the first statistically significant evidence in China that PM2.5 has an adverse effect on population health and strengthen the rationale for further limiting levels of PM2.5 in outdoor air in Shanghai.
Keywords: air pollution, fine particles, coarse particles, PM2.5, mortality
1. Introduction
Numerous epidemiological studies during the past 20 years have confirmed that short-term exposure to outdoor air pollution contributes to increased cardiorespiratory mortality and morbidity (Brunekreef and Holgate 2002). Among the pollutants in the ambient mix, particulate matter (PM) has the most consistent association with mortality (Bell et al. 2004). PM consists of discrete particles that are categorized by sizes spanning several orders of magnitude: PM10, or inhalable particles (defined as particulate matter less than 10 microns in aerodynamic diameter); PM2.5, or fine particles (defined as those particles less than 2.5 microns in aerodynamic diameter); PM10-2.5, also known as coarse particles (defined as those particles between 10 and 2.5 microns in aerodynamic diameter); and ultrafine particles (UFPs) (defined as those less than 0.1 microns). Most prior studies have used PM10 and PM2.5 as particle measurements.
While many epidemiological studies have reported associations of mortality and morbidity with ambient PM2.5 or PM10 (Pope and Dockery 2006), fewer studies have evaluated associations with PM10-2.5, which is largely due to lack of monitoring data. Not surprisingly, findings with PM10-2.5 are thus inconsistent (Brunekreef and Forsberg 2005; Ostro et al. 2000; Ostro et al. 1999; Schwartz and Neas 2000; Smith et al. 2000; Wilson and Suh 1997). Some reports suggest that PM2.5 might be a better measure of the component of particulates responsible for increased mortality than are PM10 or PM10-2.5 (Bell et al. 2004; Englert 2004). In addition, most studies were conducted in the developed countries, with only a small number of studies conducted in Asia (Health Effects Institute 2004). There remains a need for studies in cities of developing countries, where characteristics of outdoor air pollution (e.g. air pollution level, chemical composition and size of particles, and fate and transport of pollutants), meteorological conditions, and socio-demographic status of local residents (e.g. disease pattern, age structure, and social economic status), may be different from developed countries.
PM2.5 is composed of many organic and inorganic compounds, including sulfate, nitrate, organic carbon and elemental carbon, earthen dust and biological materials (pollen pieces); in contrast, PM10-2.5 is predominately composed of crustal-related materials such as calcium, aluminum, silicon, magnesium, and iron, and primary organic materials such as pollen, spores, and plant and animal debris (Fang et al. 2000; Lin et al. 2005; Lin et al. 2006; Wang and Shooter 2005). Some components, such as nitrate and potassium, are common to both PM2.5 and PM10-2.5, although the source or formation processes are different. These characteristics, combined with a different pattern of deposition in the lung, support the hypothesis that PM2.5 and PM10-2.5 may have different biologic effects and toxicity.
In China, the largest developing country, the relation between ambient particles and daily mortality has been examined in several large cities, including Beijing (Dong et al. 1996; Xu et al. 1994), Shenyang (Xu et al. 2000), Chongqin (Venners et al. 2003) and Shanghai (Kan and Chen 2003; Kan and Chen 2003). Most of these studies examined total suspended particle (TSP) (Dong et al. 1996; Xu et al. 1994; Xu et al. 2000) or PM10 (Kan and Chen 2003; Kan and Chen 2003) as particle measures. Only one study examined the acute effect of PM2.5 on daily mortality (Venners et al. 2003); however, that study was limited in duration (213 days) and the observed association was statistically insignificant. To our knowledge, there have been no epidemiological studies investigating the health effect of PM10-2.5 in China. Currently, the China National Air Quality Standard sets the limits of particles only for PM10: 50µg/m3 for daily (24hr) average, and 150µg/m3 for annual average. In setting air quality standards for PM2.5 and PM10-2.5, it is important to identify their health effects from local data.
In the current study, we conducted a time-series analysis to examine the effects of PM2.5 and PM10-2.5 on daily mortality in Shanghai, China.
2. Materials and Methods
2.1 Data
Shanghai, the most populous city in China, is located at the tip of the Yangtze River Delta in eastern China. The city comprises urban/suburban districts and counties, with a total area of 6,341 square kilometres (km2), and had a population of 13.1 million by the end of 2004, representing about 1% of China's total. Our study area was limited to the traditional nine urban Districts of Shanghai (289 km2) - Huangpu, Jinan, Luwan, Xuhui, Yangpu, Changnin, Yangpu, Putuo and Zhabei. The target population includes all permanent residents living in the area, around 6.3 million in 2004.
Daily mortality data (excluding accidents & injuries) of residents living in the nine urban districts of Shanghai from Mar. 4, 2004 to Dec. 31, 2005 (668 days) were collected from the database of Shanghai Municipal Center of Disease Control and Prevention (SMCDCP). The death report system in Shanghai was implemented in 1951, and has been computerized since 1990. For both in-home and in-hospital deaths, physicians complete the death certificate cards. The information on the cards is then sent to SMCDCP through their internal computer network. Causes of deaths were coded according to the International Classification of Diseases, Revision 10 (ICD 10), and classified into deaths due to total non-accidental causes (A00-R99), cardiovascular diseases (I00-I99), and respiratory diseases (J00-J98).
Daily air pollution data, including PM10, PM2.5, PM10-2.5 and ozone (O3), were obtained from Shanghai Environmental Monitoring Center (SEMC), the government agency in charge of collection of air pollution data in Shanghai. The daily concentrations for each pollutant were collected from a fixed-site station located in Putuo District which is under China National Quality Control. PM10-2.5 concentrations were estimated by subtracting PM2.5 from PM10 measurements. We extracted the 24-hour average concentrations for PM10, PM2.5, PM10-2.5 and 8-hour (from 10 AM to 6 PM) average concentration for O3. For the calculation of 24-hour average concentration of PM10, PM2.5 and PM10-2.5, at least 75% of the one-hour values on that particular day have to be available. For the 8-hour average of O3, at least six hourly values from 10 AM to 6 PM have to be available. We only used the actual collected data, and did not fill in the missing data of PM2.5 and PM10-2.5.
To allow adjustment for the effect of weather on mortality, daily mean temperature and humidity data were obtained from the Shanghai Meteorological Bureau. The weather data were measured at a fix-site station located in Xuhui District of Shanghai.
2.2 Statistical methods
We used the generalized additive model (GAM) with penalized splines to analyze the mortality, air pollution, and covariate data. Because counts of daily mortality data typically follow a Poisson distribution, the core analysis was a generalized additive model (GAM) with log link and Poisson error that accounted for smooth fluctuations in daily mortality. Consistent with several latest time-series studies (Ostro et al. 2006; Peng et al. 2006; Samoli et al. 2006), we used the penalized spline model for our analysis.
We first built the basic models for various mortality outcomes excluding air pollution and weather variables. We incorporated smoothed spline functions of time, which can accommodate nonlinear and non-monotonic patterns between mortality and time, offering a flexible modeling tool (Hastie and Tibshirani 1990). Day of the week (DOW) was also included as dummy variable in the basic models. In our analysis, partial autocorrelation function (PACF) was used to guide the selection of degrees of freedom (df) for time trend until the absolute values of sum of PACF of the residuals for lags up to 30 reach minimal (Katsouyanni et al. 2001; Peng et al. 2006; Touloumi et al. 2004; Touloumi et al. 2006). Peng et al (2006) found the df which minimizes the absolute value of the sum of PACF of the residuals corresponds closely with the df that leads a test for white noise to fail to reject the null hypothesis. For the specific cause of death, a minimum of one df per year was required (Samoli et al. 2006). In this way, 10, 9, and 9 df for time trend (for all our research period) were selected in our analyses for total, cardiovascular, and respiratory mortality, respectively. Residuals of the basic models were also examined to check whether there were discernable patterns and autocorrelation by means of residual plots and PACF plots.
After we established the basic models, we introduced the pollutant and weather variables (daily mean temperature and relative humidity) and analyzed their effects on mortality outcomes. Based on the previous literature (Bell et al. 2004; Dominici et al. 2006; Samet et al. 2000), 3 df (whole period of study) for mean temperature and relative humidity could control well for their effects on mortality and was used in the model. To examine the independent effects of PM2.5 and PM10-2.5, O3 was also controlled in the regression models because our previous study showed that O3 had independent effect on daily mortality in Shanghai and the correlation between PM and O3 was low (Zhang et al. 2006). We did not adjust for sulfur dioxide (SO2) and nitrogen dioxide (NO2) in our regression models because PM was highly correlated with SO2 and NO2 in Shanghai (Zhang et al. 2006) and simultaneously entering SO2 (or NO2) into the models can yield unstable parameter estimates when the pollutants involved suffer high inter-correlation (Roberts 2006).
Briefly, we fit the following log-linear generalized additive model to obtain the estimated log-relative rate β of particles in Shanghai.
Here E(Yt) means the expected number of deaths at day t; β represents the log-relative rate of mortality associated with a unit increase of particles; Zt and O3t indicates the particle and ozone concentrations at day t; DOW is day of the week effect; ps(time,df) is the penalized spline function of calendar time; and ps(temperature/humidity,3) is the penalized spline function for current-day temperature/humidity with 3 degrees of freedom.
PM10, PM2.5, and PM10-2.5 were investigated separately. Single-day lag models underestimate the cumulative effect of pollutants on mortality (Bell et al. 2004); therefore, in our primary analysis, we used the two-day moving average of current and previous day concentrations of particles (lag=01). As a sensitivity analysis, we also examined the effect of particles with different lag structures including both single-day lag and multi-day lag. Given that it is not easy to determine the optimal values of df for time trend and weather conditions in the models whether from statistical or biological plausibility perspectives, we did sensitivity analysis to test the impact of df selection on the regression results. In addition to the whole-period (Mar. 4, 2004 to Dec. 31, 2005) analysis, we also did sensitivity analysis excluding days with extremely high or low particle concentrations (the highest and lowest 1% values).
Because the assumption of the linearity between the log of mortality and particles may not be justified, we used the smoothing function to graphically analyze their relations (Bell et al. 2006; Daniels et al. 2004).
All analyses were conducted in R 2.1.1 using the MGCV package (R Development Core Team 2005). The results are presented as the percent change in daily mortality per 10 µg/m3 increase of particles.
3. Results
3.1 Data description
From Mar. 4, 2004 to Dec. 31, 2005, a total of 79,530 deaths (41,857 males and 37,673 females) were recorded in the study population. The percentages of total deaths by age group were 0.2% for 0-4, 2.4% for 5-44, 13.9% for 45-64 and 83.4% for 65+, respectively. On average, there were 119 non-accidental deaths per day, including 46 from cardiovascular diseases, and 13 from respiratory diseases (Table 1). Cardiopulmonary disease accounted for 49.4% of the total non-accidental deaths for the urban residents in Shanghai.
Table 1.
Summary statistics of daily deaths, air pollutant concentrations and weather conditions in Shanghai (Mar. 4, 2004-Dec. 30, 2005)
| No. | Mean ± S.E. | Min | P(25) | Median | P(75) | Max | |
|---|---|---|---|---|---|---|---|
| Daily death counts | |||||||
| Total (non-accident) | 668 | 119.1 ± 0.87 | 54.0 | 104.0 | 115.0 | 131.0 | 191.0 |
| Cardiovascular | 668 | 45.7 ± 0.45 | 22.0 | 37.0 | 44.0 | 52.0 | 82.0 |
| Respiratory | 668 | 13.1 ± 0.21 | 3.0 | 9.0 | 12.0 | 16.0 | 35.0 |
| Air pollutants concentrations a | |||||||
| PM10 (µg/m3) | 668 | 107.9 ± 2.39 | 22.0 | 63.0 | 93.5 | 135.8 | 403.0 |
| PM2.5 (µg/m3) | 661 | 56.4 ± 1.34 | 8.3 | 32.5 | 49.0 | 72.4 | 235.0 |
| PM10-2.5 (µg/m3) | 661 | 52.3 ± 1.57 | 2.0 | 28.5 | 42.0 | 66.0 | 330.3 |
| O3 (µg/m3) | 668 | 65.2 ± 2.89 | 5.6 | 36.7 | 58.3 | 84.6 | 253.1 |
| Meterologic measures | |||||||
| Mean Temperature (°C) | 668 | 18.8 ± 0.34 | -2.8 | 12.3 | 19.8 | 26.2 | 35.0 |
| Relative humility (%) | 668 | 69.2 ± 0.46 | 33.0 | 61.5 | 70.0 | 76.8 | 94.8 |
24-hr average for PM10, PM2.5 and PM10-2.5; 8-hr (10 AM to 6 PM) average for O3.
During our research period, the mean daily concentrations of PM2.5 and PM10-2.5 were 56.4µg/m3 and 52.3µg/m3 respectively. PM2.5 accounted for a substantial part of PM10 in Shanghai: the ratio of daily concentrations of PM2.5 and PM10 ranged from 12% to 97%, with an average of 53.0%. Meanwhile, the mean 8-hr average O3 concentrations were 65.2µg/m3.
Compared with the Global Air Quality Guidelines set by World Health Organization (10µg/m3 for annual mean and 25µg/m3 for 24-hour mean) and U.S. National Ambient Air Quality Standards (15µg/m3 for annual mean and 35µg/m3 for 24-hour mean), the PM2.5 level in Shanghai was much higher. The PM10 level in Shanghai was also above the Global Air Quality Guidelines (20µg/m3 for annual mean and 50µg/m3 for 24-hour mean) and China National Air Quality Standard for residential area (100µg/m3 for annual mean and 150µg/m3 for 24-hour mean).
Generally, PM10 was strongly correlated with both PM2.5 (correlation coefficient, r=0.84) and PM10-2.5 (r=0.88); PM2.5 and PM10-2.5 were only moderately correlated (r=0.48) (Table 2). O3 was not strongly correlated with any of the three measures, with the weakest correlations for PM10-2.5 (r=0.07).
Table 2.
Correlation coefficients between daily air pollutant concentrations and weather conditions in Metropolitan Shanghai (Mar. 4, 2004-Dec. 30, 2005)
| PM2.5 | PM10-2.5 | O3 | Temperature | Relative humidity | |
|---|---|---|---|---|---|
| PM10 | 0.84 | 0.88 | 0.21 | -0.19 | -0.36 |
| PM2.5 | 0.48 | 0.31 | -0.06 | -0.19 | |
| PM10-2.5 | 0.07 | -0.25 | -0.41 | ||
| O3 | 0.49 | -0.33 | |||
| Temperature | 0.23 |
3.2 Regression results
Table 3 summarizes the effect of particles of various sizes on total and cause-specific mortality after controlling for long-term trend of mortality, DOW, weather conditions and O3. For total and cardiovascular mortality, we found significant effects of both PM10 and PM2.5; for respiratory mortality, only PM2.5 had a significant association. For an increase of 10µg/m3 in particle concentration, total mortality increased 0.16% (95%CI 0.02% - 0.30%) for PM10, 0.36% (95%CI 0.11% - 0.61%) for PM2.5 and 0.12% (95%CI -0.13% - 0.36%) for PM10-2.5. We did not find significant associations of PM10-2.5 with total and respiratory mortality outcomes; however, PM10-2.5 was marginally associated with cardiovascular mortality (Table 3).
Table 3.
Percent increase of mortality outcomes of Shanghai residents associated with 10µg/m3 increase in particle concentrations *
| % | 95% CI | ||
|---|---|---|---|
| PM10 | Total mortality | 0.16 | 0.02 to 0.30 |
| Cardiovascular mortality | 0.31 | 0.10 to 0.53 | |
| Respiratory mortality | 0.33 | -0.08 to 0.75 | |
|
| |||
| PM2.5 | Total mortality | 0.36 | 0.11 to 0.61 |
| Cardiovascular mortality | 0.41 | 0.01 to 0.82 | |
| Respiratory mortality | 0.95 | 0.16 to 1.73 | |
|
| |||
| PM10-2.5 | Total mortality | 0.12 | -0.13 to 0.36 |
| Cardiovascular mortality | 0.34 | -0.05 to 0.73 | |
| Respiratory mortality | 0.40 | -0.34 to 1.13 | |
Current day temperature and relative humidity (lag=0), and two-day moving average of air pollutants concentrations (lag=01) were used; 10, 9, and 9 df for time trend (during all our research period) were used for total, cardiovascular and respiratory mortality; 3 df were applied to temperature and relative humidity respectively.
The effects of PM2.5 on total and cardiovascular mortality were statistically significant in single-day lag 0 and multi-day lag 01 (Figures 1a and 1b). For respiratory mortality, the effect of PM2.5 was significant on single-day lag 1 and multi-day lag 01 (Figure 1c). We did not observe significant effects of PM10-2.5 on mortality outcomes in all the lags we examined.
Figure 1.


Percent increase in numbers of deaths due to all, cardiovascular, and respiratory causes per 10 ug/m3 increase in particle concentration for different lag days. (a: total mortality; b: cardiovascular mortality; c: respiratory mortality)*
* Current-day temperature and relative humidity (lag=0) were used; 3 df were applied to temperature and relative humidity respectively.
Figure 2 graphically presents the exposure-response relationships between PM2.5 and mortality outcomes. For total and cardiovascular mortality, the exposure–response curves associated with PM2.5 exposure present positive nonlinear relationships, although the risks did not increase monotonically. The curves tend to become nonlinear and flat at lower and higher concentrations (Figures 2a and 2b). An almost linear relationship between PM2.5 and respiratory mortality was observed for most PM2.5 levels represented in our data (chi-square test for linearity, p value >0.05) (Figure 2c).
Figure 2.


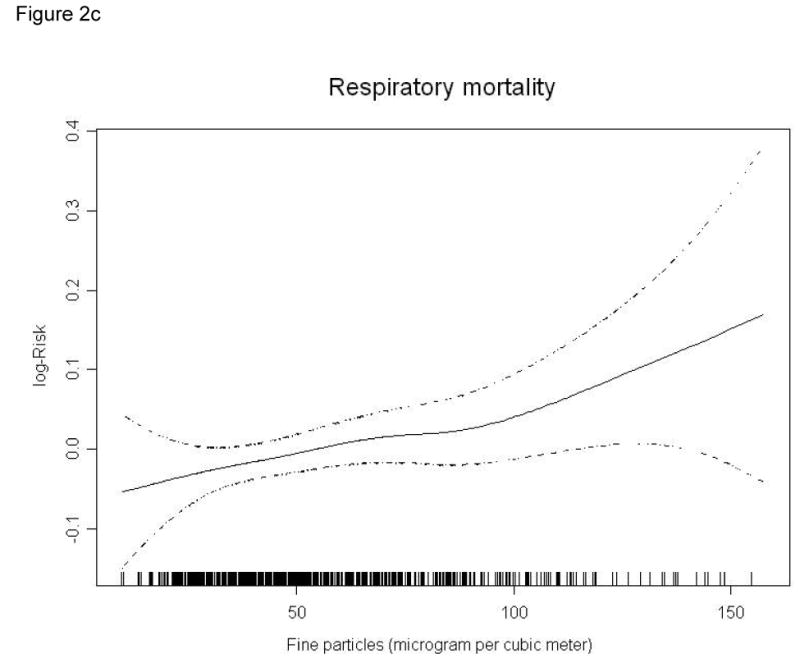
Smoothing plots of fine particles against mortality risk (df=3). X-axis is the 2-day average (lag 01) PM2.5 concentrations (µg/m3). The estimated mean percentage of change in daily mortality is shown by the solid line, and the dotted lines represent twice the point-wise standard error* (a: total mortality; b: cardiovascular mortality; c: respiratory mortality)
* Current-day temperature and relative humidity (lag=0) were used; 3 df were applied to temperature and relative humidity respectively.
Figures 3a, 3b and 3c depict the percent increase of total mortality associated with a 10µg/m3 increase in particle concentrations, under different df for time trend, temperature and relative humidity. Clearly, the changes of df for time trend (within the range of 5-25) and for weather conditions (within the range of 3-12) do not affect the regression results much, which suggest that our findings on the effects of particle concentrations on total morality are relatively robust in this respect.
Figure 3.


Effects of varying the df for time trend and weather conditions on the percent increase of total mortality associated with a 10µg/m3 increase of 2-day average (lag01) PM2.5 and PM10-2.5 (a: time trend; b: mean temperature; c: relative humidity)*
* The df value used in the core models; current-day temperature and relative humidity (lag=0) were used.
Figure 4 compares the estimate effects of PM2.5 and PM10-2.5 on total mortality before and after excluding days with extremely high and low concentrations. Generally, the regression results did not change significantly, although the estimated effects of PM2.5 and PM10-2.5 increased slightly after excluding extreme concentrations.
Figure 4.

Percent increase in total mortality per 10 ug/m3 increase in 2-day average (lag01) particle concentration before and after excluding days with extremely high and low concentrations*
* Model 1: whole period analysis; model 2: analysis excluding days with extremely high and low concentrations; current-day temperature and relative humidity (lag=0) were used; 3 df were applied to temperature and relative humidity respectively.
4. Discussion
We found that the current level of PM2.5 was associated with elevated death rates from all causes and from cardio-respiratory diseases in Shanghai. We did not find significant effects of PM10-2.5 on mortality outcomes. To our knowledge, this is the first study in China to differentiate the effects of PM2.5 and PM10-2.5 on daily mortality, and our results should contribute to the understanding of pollution level of PM2.5 and PM10-2.5, and particle-related health effects in China.
We used data from the continuous monitoring of PM2.5 and PM10-2.5 in Shanghai and had data for 668 consecutive days. The published data on PM2.5 pollution in China are scarce to date (Feng et al. 2005; Feng et al. 2006; He et al. 2006; Sun et al. 2006; Wang et al. 2004; Yang et al. 2005; Yang et al. 2005). These studies measured PM2.5 concentrations weekly, with monitoring duration no more than one year. In addition, our measurement was conducted at a fix-site monitoring station under China National Quality Control. The station is mandated to not be in direct proximity to traffic, industrial sources, buildings or residential sources of emissions from the burning of coal-, waste-, or oil. Thus our monitoring results reflect the background urban particle level in Shanghai.
Shanghai offers advantages for the investigation of the particle-mortality relationship. Our study area, nine urban districts of Shanghai, is densely populated. More than six-million permanent residents reside within 279 square kilometers. In addition, compared with the residents in North America, a lower proportion of Shanghai residents have access to or use air conditioning. Thus, the monitored air pollution data from the summer months may be more closely associated with average population exposures in Shanghai than in cities in North America. Another advantage of our study is the ability to use cumulative exposure to PM, which is not always possible in the United States where PM is often measured every few days.
In the current analysis, a 10µg/m3 increase in the 2-day moving average (lag01) concentrations of PM10, PM2.5 and PM10-2.5 corresponded to 0.16% (95%CI 0.02% - 0.30%), 0.36% (95%CI 0.11% - 0.61%), and 0.12% (95%CI -0.13% - 0.36%) increase of total mortality. In a meta-analysis of 109 time-series studies of air pollution and daily mortality, mostly conducted in North America and Europe, Stieb et al estimated that the excess in all-cause mortality (single-pollutant models) associated with an increase in PM10 of 10µg/m3 was 0.64% (95% CI 0.48% - 0.77%) (Stieb et al. 2002; Stieb et al. 2003). A meta-analysis of Asian literature indicated that a 10µg/m3 increase in PM10 was associated with a 0.49% (95%CI 0.23% - 0.76%) increase in total mortality (Health Effects Institute 2004). Recent large-scale multi-city time-series analyses, which avoid potential publication bias of meta-analysis, estimated that a 10µg/m3 increase in PM10 corresponded to a 0.60% (95%CI 0.40%-0.80%) increase of total mortality in Europe (Katsouyanni et al. 2001), and a 0.41% (95%CI 0.29%-0.53%) increase in the U.S. (Samet et al. 2000; Samet et al. 2000). Regarding PM2.5, Ostro et al estimated that a 10-µg/m3 change in 2-day average PM2.5 concentration corresponded to a 0.6% (95% confidence interval, 0.2-1.0%) increase in total mortality in Nine California Counties (Ostro et al. 2006). In their reanalysis of the Six Cities study, Schwartz et al. estimated a 1.29% (95% CI 0.88%–1.70%) and 1.13% (95% CI 0.70%–1.56%) increase of total mortality per 10 µg/m3 increase of PM2.5 using natural spline and penalized spline models respectively (Schwartz et al. 1996).
Compared with the prior results from both meta and multi-city analyses mentioned above, our estimates in Shanghai were lower. This fact may reflect differences in the different characteristics of the study sites as well as the statistical techniques we used. Local PM level, population sensitivity to PM, age distribution and especially different particle components may strongly affect the exposure-response relationships. Compared with developed countries, particle levels in Shanghai are much higher. It is well-known that the exposure-response curve of air pollution tends to become flat at higher concentration (Katsouyanni et al. 1997). In addition, the composition of the motor vehicle fleet in developed countries differs substantially from that in Shanghai. This, together with other differences as the widespread use of coal in Shanghai, implies that the particle mixture differs substantially between Shanghai and the areas where most time-series studies were conducted. In addition, consistent with several latest time-series studies (Ostro et al. 2006; Peng et al. 2006; Samoli et al. 2006), we used the penalized spline model (in R software) for our data analysis. Most prior air pollution time-series studies have been based on the GAM model in S-PLUS. Earlier simulation studies have shown that various regression models and parameter setting in the models (e.g. df selection, convergence criteria) would affect the regression coefficients (Dominici et al. 2002; Peng et al. 2006).
Consistent with most prior studies (Englert 2004), we found significant effects of PM2.5 on both total and cardio-respiratory outcomes. Of additional interest is the magnitude of the association of PM2.5 with cardio-respiratory mortality relative to that for total mortality. Our study confirmed previous findings that fine particle was more strongly associated with cardio-respiratory mortality than with all-cause mortality risk (Ostro et al. 2006; Stolzel et al. 2006; Wichmann et al. 2000). Many recent studies have addressed potential mechanisms linking particulate matter and cardiovascular diseases (Brook et al. 2004). For example, ambient particles have been associated with increased plasma viscosity (Peters et al. 1997), sequestration of red cells in the circulation (Seaton et al. 1999), and indicators of cardiac autonomic dysfunction including increased heart rate, decreased heart rate variability, and increased cardiac arrhythmias (Dockery 2001). These findings provide possible pathways by which PM2.5 can affect the cardiovascular system. Subjects who develop COPD, an important cause of respiratory mortality, may have weakened antioxidant defenses (Rahman et al. 1996), and PM2.5 can produce oxidative stress, in part because of lung inflammation (Dagher et al. 2005; Zeka et al. 2006). COPD patients may also be susceptible to particulate air pollution because obstructive airways disease leads to enhanced deposition of inhaled particles (Kim and Kang 1997). Consistent with several previous reports (Braga et al. 2001; Penttinen et al. 2004; Zanobetti et al. 2003), we found that the association of PM2.5 with respiratory mortality was stronger than with cardiovascular mortality.
Of note, we did not find a significant effect of PM10-2.5 on either total or respiratory mortality. This is consistent with most prior studies (Anderson et al. 2001; Fairley 1999; Klemm and Mason 2000; Klemm et al. 2000; Lipfert et al. 2000; Ostro et al. 2000; Schwartz et al. 1996; Villeneuve et al. 2003), but in contrast to several others (Burnett et al. 2000; Cifuentes et al. 2000; Mar et al. 2000). PM10-2.5 is typically mechanically generated by crushing or grinding, and is often dominated by re-suspended dusts and crustal material from paved or unpaved roads or from construction, farming, and mining activities. Generally, these nature-generated particles are less toxic to the cardio-respiratory system than combustion-related particles, such as oil fly ash particles. For instance, Costa et al found that the in vivo pulmonary toxicity of urban particles varied with size, with the greatest toxicity from particles <1.7µm and the lowest toxicity from those >3.5µm (Costa and Dreher 1997). In addition, compared with PM2.5, PM10-2.5 had lower concentrations of soluble transition metals, which might also contribute to the lower toxicity of PM10-2.5 (Dreher et al. 1996). Moreover, most of the particles that deposit in the alveolar region are PM2.5 (Venkataraman and Kao 1999). Particles in the alveolar region are cleared more slowly than in the conducting airways (Oberdorster et al. 1994), which may be one reason for the greater toxic effect of PM2.5.
The limitations of our study should be noted. As in other time-series studies, we used available outdoor monitoring data to represent the population exposure to ambient particles. The resulting measurement error may have implications for interpreting the effect of particles (Zeger et al. 2000), although a study suggested that this measurement error would generally tend to bias estimates downward (Samet et al. 2000). However, we lack information on personal exposure to particles to quantity this bias. Another limitation is that our assessment of ambient particles was derived entirely from one monitoring station. Compared with studies in Europe and North America, the data we collected were also limited by virtue of the single city and limited time period. This may have limited our power to find significant association with PM10-2.5. We only adjusted for the current-day weather conditions; previous study suggests that the acute effect of PM on daily mortality is robust to the lag structure of weather conditions (Samet et al. 2000). As in other time-series study, we did not consider the particles from indoor sources. In Shanghai, little or no indoor air monitoring data are available. However, some studies suggested that the daily population average concentrations of fine particles derived from indoor sources are approximately independent of ambient levels (Wilson and Suh 1997). When this is true, failure to measure indoor sources will not introduce further bias in the estimated effects of ambient particles (Zeger et al. 2000).
5. Conclusions
In summary, we found significant associations of daily mortality with PM2.5, but not with PM10-2.5 in Shanghai. Compared with developed countries, the level of PM2.5 in Shanghai is much higher. Our analyses provide the first statistically significant evidence in China that PM2.5 has adverse effects on the health of the general population and strengthen the rationale for further limiting levels of PM2.5 in outdoor air in Shanghai.
Acknowledgments
The research was supported by Shanghai Municipal Committee of Science and Technology (03DZ05052) and the Division of Intramural Research, National Institute of Environmental Health Sciences, National Institutes of Health, Department of Health and Human Services, US. Haidong Kan has been personally supported by Rising Star Program for Young Investigators of Shanghai Municipal Committee of Science and Technology (04QMX1402) since 2004.
References
- Anderson HR, Bremner SA, Atkinson RW, Harrison RM, Walters S. Particulate matter and daily mortality and hospital admissions in the west midlands conurbation of the United Kingdom: associations with fine and coarse particles, black smoke and sulphate. Occup Environ Med. 2001;58(8):504–510. doi: 10.1136/oem.58.8.504. [DOI] [PMC free article] [PubMed] [Google Scholar]
- Bell ML, McDermott A, Zeger SL, Samet JM, Dominici F. Ozone and short-term mortality in 95 US urban communities, 1987-2000. Jama. 2004;292(19):2372–2378. doi: 10.1001/jama.292.19.2372. [DOI] [PMC free article] [PubMed] [Google Scholar]
- Bell ML, Peng RD, Dominici F. The exposure-response curve for ozone and risk of mortality and the adequacy of current ozone regulations. Environ Health Perspect. 2006;114(4):532–536. doi: 10.1289/ehp.8816. [DOI] [PMC free article] [PubMed] [Google Scholar]
- Bell ML, Samet JM, Dominici F. Time-series studies of particulate matter. Annu Rev Public Health. 2004;25:247–280. doi: 10.1146/annurev.publhealth.25.102802.124329. [DOI] [PubMed] [Google Scholar]
- Braga AL, Zanobetti A, Schwartz J. The lag structure between particulate air pollution and respiratory and cardiovascular deaths in 10 US cities. J Occup Environ Med. 2001;43(11):927–933. doi: 10.1097/00043764-200111000-00001. [DOI] [PubMed] [Google Scholar]
- Brook RD, Franklin B, Cascio W, Hong Y, Howard G, Lipsett M, et al. Air pollution and cardiovascular disease: a statement for healthcare professionals from the Expert Panel on Population and Prevention Science of the American Heart Association. Circulation. 2004;109(21):2655–2671. doi: 10.1161/01.CIR.0000128587.30041.C8. [DOI] [PubMed] [Google Scholar]
- Brunekreef B, Forsberg B. Epidemiological evidence of effects of coarse airborne particles on health. Eur Respir J. 2005;26(2):309–318. doi: 10.1183/09031936.05.00001805. [DOI] [PubMed] [Google Scholar]
- Brunekreef B, Holgate ST. Air pollution and health. Lancet. 2002;360(9341):1233–1242. doi: 10.1016/S0140-6736(02)11274-8. [DOI] [PubMed] [Google Scholar]
- Burnett RT, Brook J, Dann T, Delocla C, Philips O, Cakmak S, et al. Association between particulate- and gas-phase components of urban air pollution and daily mortality in eight Canadian cities. Inhal Toxicol. 2000;12 4:15–39. doi: 10.1080/08958370050164851. [DOI] [PubMed] [Google Scholar]
- Cifuentes LA, Vega J, Kopfer K, Lave LB. Effect of the fine fraction of particulate matter versus the coarse mass and other pollutants on daily mortality in Santiago, Chile. J Air Waste Manag Assoc. 2000;50(8):1287–1298. doi: 10.1080/10473289.2000.10464167. [DOI] [PubMed] [Google Scholar]
- Costa DL, Dreher KL. Bioavailable transition metals in particulate matter mediate cardiopulmonary injury in healthy and compromised animal models. Environ Health Perspect. 1997;105 5:1053–1060. doi: 10.1289/ehp.97105s51053. [DOI] [PMC free article] [PubMed] [Google Scholar]
- Dagher Z, Garcon G, Gosset P, Ledoux F, Surpateanu G, Courcot D, et al. Pro-inflammatory effects of Dunkerque city air pollution particulate matter 2.5 in human epithelial lung cells (L132) in culture. J Appl Toxicol. 2005;25(2):166–175. doi: 10.1002/jat.1050. [DOI] [PubMed] [Google Scholar]
- Daniels MJ, Dominici F, Zeger SL, Samet JM. The National Morbidity, Mortality, and Air Pollution Study. Part III: PM10 concentration-response curves and thresholds for the 20 largest US cities. Res Rep Health Eff Inst. 2004;94(Pt 3):1–21. discussion 23-30. [PubMed] [Google Scholar]
- Dockery DW. Epidemiologic evidence of cardiovascular effects of particulate air pollution. Environ Health Perspect. 2001;109 4:483–486. doi: 10.1289/ehp.01109s4483. [DOI] [PMC free article] [PubMed] [Google Scholar]
- Dominici F, McDermott A, Zeger SL, Samet JM. On the use of generalized additive models in time-series studies of air pollution and health. Am J Epidemiol. 2002;156(3):193–203. doi: 10.1093/aje/kwf062. [DOI] [PubMed] [Google Scholar]
- Dominici F, Peng RD, Bell ML, Pham L, McDermott A, Zeger SL, et al. Fine particulate air pollution and hospital admission for cardiovascular and respiratory diseases. Jama. 2006;295(10):1127–1134. doi: 10.1001/jama.295.10.1127. [DOI] [PMC free article] [PubMed] [Google Scholar]
- Dong JW, Xu XP, Dockery DW. Association of air pollution with unscheduled outpatient visits in Beijing Longfu Hospital, 1991. Zhonghua Liu Xing Bing Xue Za Zhi. 1996;17(1):13–16. [PubMed] [Google Scholar]
- Dreher K, Jaskot R, Kodavanti U, Lehmann J, Winsett D, Costa D. Soluble transition metals mediate the acute pulmonary injury and airway hyperreactivity induced by residual oil fly ash particles. Chest. 1996;109 3:33S–34S. doi: 10.1378/chest.109.3_supplement.33s-a. [DOI] [PubMed] [Google Scholar]
- Englert N. Fine particles and human health--a review of epidemiological studies. Toxicol Lett. 2004;149(13):235–242. doi: 10.1016/j.toxlet.2003.12.035. [DOI] [PubMed] [Google Scholar]
- Fairley D. Daily mortality and air pollution in Santa Clara County, California: 1989-1996. Environ Health Perspect. 1999;107(8):637–641. doi: 10.1289/ehp.99107637. [DOI] [PMC free article] [PubMed] [Google Scholar]
- Fang GC, Chang CN, Wu YS, Wang V, Fu PP, Yang DG, et al. The study of fine and coarse particles, and metallic elements for the daytime and night-time in a suburban area of central Taiwan, Taichung. Chemosphere. 2000;41(5):639–644. doi: 10.1016/s0045-6535(99)00507-x. [DOI] [PubMed] [Google Scholar]
- Feng J, Chan CK, Fang M, Hu M, He L, Tang X. Impact of meteorology and energy structure on solvent extractable organic compounds of PM2.5 in Beijing, China. Chemosphere. 2005;61(5):623–632. doi: 10.1016/j.chemosphere.2005.03.067. [DOI] [PubMed] [Google Scholar]
- Feng J, Chan CK, Fang M, Hu M, He L, Tang X. Characteristics of organic matter in PM2.5 in Shanghai. Chemosphere. 2006;64(8):1393–1400. doi: 10.1016/j.chemosphere.2005.12.026. [DOI] [PubMed] [Google Scholar]
- Hastie TJ, Tibshirani RJ. Generalized Additive Models. London: Chapman & Hall; 1990. [Google Scholar]
- He LY, Hu M, Huang XF, Zhang YH, Tang XY. Seasonal pollution characteristics of organic compounds in atmospheric fine particles in Beijing. Sci Total Environ. 2006;359(13):167–176. doi: 10.1016/j.scitotenv.2005.05.044. [DOI] [PubMed] [Google Scholar]
- Health Effects Institute. Health effects of outdoor air pollution in developing countries of Asia: a literature review. Boston, MA, USA: 2004. [Google Scholar]
- Kan H, Chen B. Air pollution and daily mortality in Shanghai: a time-series study. Arch Environ Health. 2003;58(6):360–367. [PubMed] [Google Scholar]
- Kan H, Chen B. A case-crossover analysis of air pollution and daily mortality in Shanghai. J Occup Health. 2003;45(2):119–124. doi: 10.1539/joh.45.119. [DOI] [PubMed] [Google Scholar]
- Katsouyanni K, Touloumi G, Samoli E, Gryparis A, Le Tertre A, Monopolis Y, et al. Confounding and effect modification in the short-term effects of ambient particles on total mortality: results from 29 European cities within the APHEA2 project. Epidemiology. 2001;12(5):521–531. doi: 10.1097/00001648-200109000-00011. [DOI] [PubMed] [Google Scholar]
- Katsouyanni K, Touloumi G, Spix C, Schwartz J, Balducci F, Medina S, et al. Short-term effects of ambient sulphur dioxide and particulate matter on mortality in 12 European cities: results from time series data from the APHEA project. Air Pollution and Health: a European Approach. Bmj. 1997;314(7095):1658–1663. doi: 10.1136/bmj.314.7095.1658. [DOI] [PMC free article] [PubMed] [Google Scholar]
- Kim CS, Kang TC. Comparative measurement of lung deposition of inhaled fine particles in normal subjects and patients with obstructive airway disease. Am J Respir Crit Care Med. 1997;155(3):899–905. doi: 10.1164/ajrccm.155.3.9117024. [DOI] [PubMed] [Google Scholar]
- Klemm RJ, Mason RM., Jr Aerosol Research and Inhalation Epidemiological Study (ARIES): air quality and daily mortality statistical modeling--interim results. J Air Waste Manag Assoc. 2000;50(8):1433–1439. doi: 10.1080/10473289.2000.10464188. [DOI] [PubMed] [Google Scholar]
- Klemm RJ, Mason RM, Jr, Heilig CM, Neas LM, Dockery DW. Is daily mortality associated specifically with fine particles? Data reconstruction and replication of analyses. J Air Waste Manag Assoc. 2000;50(7):1215–1222. doi: 10.1080/10473289.2000.10464149. [DOI] [PubMed] [Google Scholar]
- Lin CC, Chen SJ, Huang KL, Hwang WI, Chang-Chien GP, Lin WY. Characteristics of metals in nano/ultrafine/fine/coarse particles collected beside a heavily trafficked road. Environ Sci Technol. 2005;39(21):8113–8122. doi: 10.1021/es048182a. [DOI] [PubMed] [Google Scholar]
- Lin CC, Chen SJ, Huang KL, Lee WJ, Lin WY, Liao CJ, et al. Water-soluble ions in nano/ultrafine/fine/coarse particles collected near a busy road and at a rural site. Environ Pollut. 2006 doi: 10.1016/j.envpol.2006.04.023. [DOI] [PubMed] [Google Scholar]
- Lipfert FW, Morris SC, Wyzga RE. Daily mortality in the Philadelphia metropolitan area and size-classified particulate matter. J Air Waste Manag Assoc. 2000;50(8):1501–1513. doi: 10.1080/10473289.2000.10464185. [DOI] [PubMed] [Google Scholar]
- Mar TF, Norris GA, Koenig JQ, Larson TV. Associations between air pollution and mortality in Phoenix, 1995-1997. Environ Health Perspect. 2000;108(4):347–353. doi: 10.1289/ehp.00108347. [DOI] [PMC free article] [PubMed] [Google Scholar]
- Oberdorster G, Ferin J, Lehnert BE. Correlation between particle size, in vivo particle persistence, and lung injury. Environ Health Perspect. 1994;102 5:173–179. doi: 10.1289/ehp.102-1567252. [DOI] [PMC free article] [PubMed] [Google Scholar]
- Ostro B, Broadwin R, Green S, Feng WY, Lipsett M. Fine particulate air pollution and mortality in nine California counties: results from CALFINE. Environ Health Perspect. 2006;114(1):29–33. doi: 10.1289/ehp.8335. [DOI] [PMC free article] [PubMed] [Google Scholar]
- Ostro BD, Broadwin R, Lipsett MJ. Coarse and fine particles and daily mortality in the Coachella Valley, California: a follow-up study. J Expo Anal Environ Epidemiol. 2000;10(5):412–419. doi: 10.1038/sj.jea.7500094. [DOI] [PubMed] [Google Scholar]
- Ostro BD, Hurley S, Lipsett MJ. Air pollution and daily mortality in the Coachella Valley, California: a study of PM10 dominated by coarse particles. Environ Res. 1999;81(3):231–238. doi: 10.1006/enrs.1999.3978. [DOI] [PubMed] [Google Scholar]
- Peng RD, Dominici F, Louis TA. Model choice in time series studies of air pollution and mortality. Journal of the Royal Statistical Society, Series A. 2006;169(2):179–203. [Google Scholar]
- Penttinen P, Tiittanen P, Pekkanen J. Mortality and air pollution in metropolitan Helsinki, 1988--1996. Scand J Work Environ Health. 2004;30 2:19–27. [PubMed] [Google Scholar]
- Peters A, Doring A, Wichmann HE, Koenig W. Increased plasma viscosity during an air pollution episode: a link to mortality? Lancet. 1997;349(9065):1582–1587. doi: 10.1016/S0140-6736(97)01211-7. [DOI] [PubMed] [Google Scholar]
- Pope CA, 3rd, Dockery DW. Health effects of fine particulate air pollution: lines that connect. J Air Waste Manag Assoc. 2006;56(6):709–742. doi: 10.1080/10473289.2006.10464485. [DOI] [PubMed] [Google Scholar]
- R Development Core Team. R: A language and environment for statistical computing. Vienna, Austria: R Foundation for Statistical Computing; 2005. [Google Scholar]
- Rahman I, Morrison D, Donaldson K, MacNee W. Systemic oxidative stress in asthma, COPD, and smokers. Am J Respir Crit Care Med. 1996;154(4 Pt 1):1055–1060. doi: 10.1164/ajrccm.154.4.8887607. [DOI] [PubMed] [Google Scholar]
- Roberts S. A new model for investigating the mortality effects of multiple air pollutants in air pollution mortality time-series studies. J Toxicol Environ Health A. 2006;69(6):417–435. doi: 10.1080/15287390500246761. [DOI] [PubMed] [Google Scholar]
- Samet JM, Dominici F, Curriero FC, Coursac I, Zeger SL. Fine particulate air pollution and mortality in 20 U.S. cities, 1987-1994. N Engl J Med. 2000;343(24):1742–1749. doi: 10.1056/NEJM200012143432401. [DOI] [PubMed] [Google Scholar]
- Samet JM, Dominici F, Zeger SL, Schwartz J, Dockery DW. The National Morbidity, Mortality, and Air Pollution Study. Part I: Methods and methodologic issues. Res Rep Health Eff Inst. 2000;94(Pt 1):5–14. discussion 75-84. [PubMed] [Google Scholar]
- Samet JM, Zeger SL, Dominici F, Curriero F, Coursac I, Dockery DW, et al. The National Morbidity, Mortality, and Air Pollution Study. Part II: Morbidity and mortality from air pollution in the United States. Res Rep Health Eff Inst. 2000;94(Pt 2):5–70. discussion 71-79. [PubMed] [Google Scholar]
- Samoli E, Aga E, Touloumi G, Nisiotis K, Forsberg B, Lefranc A, et al. Short-term effects of nitrogen dioxide on mortality: an analysis within the APHEA project. Eur Respir J. 2006;27(6):1129–1138. doi: 10.1183/09031936.06.00143905. [DOI] [PubMed] [Google Scholar]
- Schwartz J, Dockery DW, Neas LM. Is daily mortality associated specifically with fine particles? J Air Waste Manag Assoc. 1996;46(10):927–939. [PubMed] [Google Scholar]
- Schwartz J, Neas LM. Fine particles are more strongly associated than coarse particles with acute respiratory health effects in schoolchildren. Epidemiology. 2000;11(1):6–10. doi: 10.1097/00001648-200001000-00004. [DOI] [PubMed] [Google Scholar]
- Seaton A, Soutar A, Crawford V, Elton R, McNerlan S, Cherrie J, et al. Particulate air pollution and the blood. Thorax. 1999;54(11):1027–1032. doi: 10.1136/thx.54.11.1027. [DOI] [PMC free article] [PubMed] [Google Scholar]
- Smith RL, Spitzner D, Kim Y, Fuentes M. Threshold dependence of mortality effects for fine and coarse particles in Phoenix, Arizona. J Air Waste Manag Assoc. 2000;50(8):1367–1379. doi: 10.1080/10473289.2000.10464172. [DOI] [PubMed] [Google Scholar]
- Stieb DM, Judek S, Burnett RT. Meta-analysis of time-series studies of air pollution and mortality: effects of gases and particles and the influence of cause of death, age, and season. J Air Waste Manag Assoc. 2002;52(4):470–484. doi: 10.1080/10473289.2002.10470794. [DOI] [PubMed] [Google Scholar]
- Stieb DM, Judek S, Burnett RT. Meta-analysis of time-series studies of air pollution and mortality: update in relation to the use of generalized additive models. J Air Waste Manag Assoc. 2003;53(3):258–261. doi: 10.1080/10473289.2003.10466149. [DOI] [PubMed] [Google Scholar]
- Stolzel M, Breitner S, Cyrys J, Pitz M, Wolke G, Kreyling W, et al. Daily mortality and particulate matter in different size classes in Erfurt, Germany. J Expo Sci Environ Epidemiol. 2006 doi: 10.1038/sj.jes.7500538. advance online publication, 2006. [DOI] [PubMed] [Google Scholar]
- Sun Y, Zhuang G, Tang AA, Wang Y, An Z. Chemical characteristics of PM2.5 and PM10 in haze-fog episodes in Beijing. Environ Sci Technol. 2006;40(10):3148–3155. doi: 10.1021/es051533g. [DOI] [PubMed] [Google Scholar]
- Touloumi G, Atkinson R, Tertre AL, Samoli E, Schwartz J, Schindler C, et al. Analysis of health outcome time series data in epidemiological studies. Environmetrics. 2004;15(2):101–117. [Google Scholar]
- Touloumi G, Samoli E, Pipikou M, Le Tertre A, Atkinson R, Katsouyanni K. Seasonal confounding in air pollution and health time-series studies: effect on air pollution effect estimates. Stat Med 2006. 2006;25(24):4164–4178. doi: 10.1002/sim.2681. [DOI] [PubMed] [Google Scholar]
- Venkataraman C, Kao AS. Comparison of particle lung doses from the fine and coarse fractions of urban PM-10 aerosols. Inhal Toxicol. 1999;11(2):151–169. doi: 10.1080/089583799197221. [DOI] [PubMed] [Google Scholar]
- Venners SA, Wang B, Xu Z, Schlatter Y, Wang L, Xu X. Particulate matter, sulfur dioxide, and daily mortality in Chongqing, China. Environ Health Perspect. 2003;111(4):562–567. doi: 10.1289/ehp.5664. [DOI] [PMC free article] [PubMed] [Google Scholar]
- Villeneuve PJ, Burnett RT, Shi Y, Krewski D, Goldberg MS, Hertzman C, et al. A time-series study of air pollution, socioeconomic status, and mortality in Vancouver, Canada. J Expo Anal Environ Epidemiol. 2003;13(6):427–435. doi: 10.1038/sj.jea.7500292. [DOI] [PubMed] [Google Scholar]
- Wang H, Shooter D. Source apportionment of fine and coarse atmospheric particles in Auckland, New Zealand. Sci Total Environ. 2005;340(13):189–198. doi: 10.1016/j.scitotenv.2004.08.017. [DOI] [PubMed] [Google Scholar]
- Wang JL, Zhang YH, Shao M, Liu XL, Zeng LM, Cheng CL, et al. Chemical composition and quantitative relationship between meteorological condition and fine particles in Beijing. J Environ Sci (China) 2004;16(5):860–864. [PubMed] [Google Scholar]
- Wichmann HE, Spix C, Tuch T, Wolke G, Peters A, Heinrich J, et al. Daily mortality and fine and ultrafine particles in Erfurt, Germany part I: role of particle number and particle mass. Res Rep Health Eff Inst. 2000;(98):5–86. discussion 87-94. [PubMed] [Google Scholar]
- Wilson WE, Suh HH. Fine particles and coarse particles: concentration relationships relevant to epidemiologic studies. J Air Waste Manag Assoc. 1997;47(12):1238–1249. doi: 10.1080/10473289.1997.10464074. [DOI] [PubMed] [Google Scholar]
- Xu X, Gao J, Dockery DW, Chen Y. Air pollution and daily mortality in residential areas of Beijing, China. Arch Environ Health. 1994;49(4):216–222. doi: 10.1080/00039896.1994.9937470. [DOI] [PubMed] [Google Scholar]
- Xu Z, Yu D, Jing L, Xu X. Air pollution and daily mortality in Shenyang, China. Arch Environ Health. 2000;55(2):115–120. doi: 10.1080/00039890009603397. [DOI] [PubMed] [Google Scholar]
- Yang F, He K, Ma Y, Zhang Q, Cadle SH, Chan T, et al. Characterization of carbonaceous species of ambient PM2.5 in Beijing, China. J Air Waste Manag Assoc. 2005;55(7):984–992. doi: 10.1080/10473289.2005.10464699. [DOI] [PubMed] [Google Scholar]
- Yang F, Ye B, He K, Ma Y, Cadle SH, Chan T, et al. Characterization of atmospheric mineral components of PM2.5 in Beijing and Shanghai, China. Sci Total Environ. 2005;343(13):221–230. doi: 10.1016/j.scitotenv.2004.10.017. [DOI] [PubMed] [Google Scholar]
- Zanobetti A, Schwartz J, Samoli E, Gryparis A, Touloumi G, Peacock J, et al. The temporal pattern of respiratory and heart disease mortality in response to air pollution. Environ Health Perspect. 2003;111(9):1188–1193. doi: 10.1289/ehp.5712. [DOI] [PMC free article] [PubMed] [Google Scholar]
- Zeger SL, Thomas D, Dominici F, Samet JM, Schwartz J, Dockery D, et al. Exposure measurement error in time-series studies of air pollution: concepts and consequences. Environ Health Perspect. 2000;108(5):419–426. doi: 10.1289/ehp.00108419. [DOI] [PMC free article] [PubMed] [Google Scholar]
- Zeka A, Sullivan JR, Vokonas PS, Sparrow D, Schwartz J. Inflammatory markers and particulate air pollution: characterizing the pathway to disease. Int J Epidemiol. 2006;35(5):1347–1354. doi: 10.1093/ije/dyl132. [DOI] [PubMed] [Google Scholar]
- Zhang Y, Huang W, London SJ, Song G, Chen G, Jiang L, et al. Ozone and daily mortality in Shanghai, China. Environ Health Perspect. 2006;114(8):1227–1232. doi: 10.1289/ehp.9014. [DOI] [PMC free article] [PubMed] [Google Scholar]