

Abstract
Objective
To develop an immunomagnetic cell separation system for Allogeneic hematopoietic stem cell (HSC) transplantations which can achieve a high level of T-cell depletion (at least 4.0 log10), high level of recovery of hematopoietic stem cells (> 90%), with a high throughput (> 106 cells/s).
Methods
Peripheral blood leukocytes (PBLs) from buffy coats were spiked with CD34 expressing cells (KG1a) to mimic a leukaphoresis product containing stimulated HSCs. T-cells were labeled with anti-CD3+ Dynabeads and separated in a Quadrupole Magnetic Cell Sorter, QMS. The performance of the system with respect to T-cell depletion and recovery of non T-cells and spiked KG1a was determined using four-color, flow cytometry analysis, with the aid of Trucount® cell concentration calibration beads. Limiting dilution assays were also performed to quantify the log10 depletion of clonable T cells.
Results
While the general performance of the QMS system is governed by proven theoretical principles, significant system variability exist, not all of which can be explained by our current understanding. Consequently, a factorial design was employed guided by JMP software to optimize the labeling conditions and operation of the QMS focused on maximizing the depletion of T cell, and recovery of unlabeled cells including KG1a cells. From these studies, an optimized, no wash, immunomagnetic labeling protocol and optimized QMS operating conditions were developed. For an average initial cell concentration of 1.7 × 10⁸ total cells, an average 3.96 ± 0.33 log10 depletion (range of 3.53 to 4.34) of CD3+CD45+ cells with a mean 99.43 ± 4.23% recovery of CD34+CD45+ cells (range of 94.38% to 104.90%) was achieved at a sorting speed of 106 cells/s (n=6). Limiting dilution assays (LDA) on the T-cell depleted fractions, which gave a log10 depletion of 3.51 for the clonable T cells.
Conclusion
We suggest that this system will provide superior performance with respect to T-cell depletion and CD34+ recovery for clinical allogeneic bone marrow transplants. Ongoing studies, on a clinical scale are being conducted to demonstrate this claim.
Introduction
Allogeneic hematopoietic stem cell (HSC) transplantation is the only curative option for many patients with hematological malignancies and various non-malignant diseases. Graft-versus-host disease (GvHD), however, remains a major limitation of treatment, where the risk is dependent on the degree of histocompatibility matching between donor and recipient [1–3]. High-level (4–5 log10) depletion of donor T lymphocytes from the graft can effectively eliminate the risk of GvHD even in a haplotype-mismatched setting [1, 4]. However, to assure successful engraftment, high doses of donor CD34+ cells are needed [1, 4]. A number of methods for T cell depletion have been described, including counter-flow elutriation, lectin agglutination, roseting combined with centrifugation, density gradient separation, immunoaffinity column (CEPRATE System), and flow cytometry based sorting [5–10]. However, the common disadvantage of those methods is either the inability to process very large number of cells or the relatively low log10 depletion of T cells. Therefore, over the last two decades significant effort has been focused on applications of magnetic techniques including the use of the CliniMACS system from Miltenyi Biotec GmbH, Isolex 300 from Baxter, Easysep® from Stemcell separation, and Dynal system from Dynal Biotech [11–14].
From a methodology perspective, cell isolation or depletion can be considered either as positive targeting of the desired cell (i.e. immunomagnetically labeled HSC) and indirectly removing all other cell types, or negative depletion of the undesirable cell (i.e. removal of the T-cell). The systems suggested in the literature for clinical applications can be classified as 1) batch systems (i.e. immunoaffinity or immunomagnetic columns such as MACS columns, rosetting combined with centrifugation), 2) continuous flow through systems (flow cytometry), or 3) a hybrid of the two. For clinical T cell depletion of hematopoietic stem cell grafts, three approaches have predominantly been used: a) a positive selection of CD34+ cells, b) a positive selection of CD34+ followed by a negative depletion of T-cells, or c) a purely negative depletion of T-cells. Table 1 presents a summary of some of the published reports of performance obtained using each approach. While the results presented in this Table are moderately acceptable, from a clinical perspective, not only is a high level of depletion of T-cell desired, but a 100% or nearly 100% recovery of HSC (CD34+ cells) is also desired, since the lower the recovery of HSC, the larger the initial sample that needs to be processed. Finally, a high throughput is desired to minimize the processing time.
Table 1.
Summary of several published studies using positive, or negative selection, to remove T-cells for a bone marrow transplant.
| Type of Separator | Mode of operation | Number of cell separation steps | Antigen targeted | Number of samples | Average number of MNC per sample (× 1010) | Average log10 depletion of T-cells (range) | Average MNC recovery, % (range) | Average CD34+ recovery, % | Reference |
|---|---|---|---|---|---|---|---|---|---|
| CliniMACS | Positive Selection | 1 | CD133 | 20 | 5.5 | 3.75 (3.22–4.1) | 80 (42.4–114) | 13 | |
| CliniMACS | Positive Selection | 1 | CD34 | 18 | 5.7 | 4.1 (3.5–5.6) | 77.3 (40.5–97.7) | 13 | |
| Isolex 300i, MaxSep | Positive and negative | 2 | CD34, CD3 | 10 | 5.1 (4.4 –5.6) | 57 (39–68) | 14 | ||
| CliniMACS | Negative depletion | 1 | CD3, CD19 | 5 | 2.19 | 3.4 (3–3.8) | 70 (54–88) | 69 (52–98) | 15 |
| CliniMACS | Negative depletion | 1 | CD3 | 8 | 3.3 | 3.4 (2.8 – 4.1) | 76 (52–100) | 82 (75–92)* | 16 |
| CliniMACS | Negative depletion | 1 | CD3, CD19 | 103 | 4.6 | 4.15 ± 0.46 | 38 ± 12.5 | 61.2 ± 15.7 | 17 |
only four of eight samples were CD34 measured
To address the shortfalls of previous cell separation systems, we have developed a separation methodology which is relatively simple and fast and provides depletion and recovery results which are promising for clinical applications. Specifically, we report on a novel, “one-step”, no wash, immunomagnetic labeling protocol is used and the cells are sorted at a speed over 1 × 10⁶ cells/s. Under these conditions, a four log10 depletion of T-cells is achieved with a nearly 100 percent recovery of CD34+ cells.
Materials and methods
Cell sources
To facilitate repeated testing at reasonable cost, leukocyte buffy coats obtained from the American Red Cross were treated to simulate cytokine-stimulated leukapheresis products in cellular composition. Buffy coats were purchased from the American Red Cross, Central Ohio Region. The donors of buffy coat are healthy and met American Red Cross criteria for blood donation, including HIV, hepatitis and syphilis testing, regardless of race, ethnic origin and gender. Since significantly more numbers of red blood cells are present with the purchased buffy coats compared to cytokine-stimulated apheresis products, red cell depletion was initially performed. Sixty ml of buffy coat aliquots were diluted with 100 ml of Hank’s balanced salt solution (HBSS, JRH Biosciences), placed on a Ficoll-Hypaque (Fisher Scientifics) density gradient (1.077 g/ml), and spun for 30 minutes at 350×g with the centrifuge brake off. The interface of PBLs was carefully collected and transferred into a clean tube and washed three times using the working buffer (PBS supplemented with 2 mM EDTA and 0.5 % bovine serum albumin). The initial leukocyte count was performed using a hemocytometer, and cell viability was measured using the Trypan blue exclusion technique (Invitrogen Corporation, USA). The manual cell numbers obtained from hemocytometer were used in calculations in the depletion processing until flow cytometry analysis. To mimic the hematopoietic progenitor (CD34+) cell content of the product, CD34+ cells of the cell line KG1a cells (Cat # CCL246.2, ATCC, USA) were added to the red cell depleted buffy coats to a proportion of 0.5–5 % CD34+ cells for subsequent processing.
Immunomagnetic cell labeling
The final labeling protocol used in this study, after optimization, consisted of labeling the cells with anti-CD3 Dynabeads M-450 (Clone spvT3b, Cat # 111.51D, Dynal Biotech, Oslo, Norway) in a one step, no wash process. The actual labeling consisted of adding, sequentially, 100 μl of FcR blocking reagent (Cat# 130-059-901, Miltenyi Biotec, Auburn, CA) and 500 μl CD3 Dynabead suspension directly out of the bottle to a cell suspension of on the order of 108 PBL’s in labeling buffer. The final cell concentration, after the addition of the two reagents, was 1 × 10⁸ cells/ml. The cell suspension was incubated for 30 minutes in the dark at 4 °C. After incubation, 9 ml of buffer was added to obtain the final cell suspension for the immunomagnetic sorting step.
Cell Sorting with Quadrupole Magnetic Sorter
We have previously reported the mechanics of the QMS as developed in our laboratory for depleting unwanted cells [18–20]. Briefly, the system is composed of a column with concentric inlet and outlet splitters to separate the cell suspension injection site (a′) from the carrier injection site (b′). The column is placed into a strong magnet and by the effect of magnetic forces, cells previously labeled with antibody-conjugated magnetic beads are deflected towards stream b. Non-labeled cells are recovered from stream a. Figure 1 presents the design and construction of the Quadrupole Magnetic Sorter (QMS) system described previously [21, 22]. The magnetic field is provided by four neodymium-iron-boron permanent magnets with a maximum magnetic field strength of the quadrupole (B0) of 1.37 T and mean force field strength (Sm) of 2.382 × 10⁸ (T-A)/m2. A disposable, sterile, separation column (prototype # 10597) manufactured by SHOT Inc (Greenville, IN) which came pre-sterilized by gamma radiation in sealed bags with tubing attached. A Watson-Marlow peristaltic pump (Watson Marlow Bretel Inc, Wilmington, MA) which is controlled by a stepping motor. A syringe was connected to the outlet a to collect sorted fractions.
Figure 1.

Schematic drawing of the separation column of the Quadrupole Magnetic Cell Sorter (QMS) showing cell injection port (a′), carrier (sheath fluid) injection port (b′) and elution of non-magnetically labeled cells (a) and magnetically labeled cells deflected by the magnetic field (b).
Flow cytometry analyses
Flow analysis was conducted on a FACS Aria (BD Biosciences, San Jose CA, USA). Cells suspensions, pre and post TCD, were stained with anti-CD3-PE (BD Biosciences, SK7, cat: 347347), anti-CD45-FITC (BD, Cat: 555482), anti-CD34-APC (BD Biosciences, Cat: 340441) and 7-AAD (BD Biosciences, cat: 555815). Anti-PE, FITC, APC non-binding isotype IgG controls (BD Biosciences) were used to perform compensation adjustments, respectively. In all cases, a minimum of 200,000 events were acquired in the selected analysis region.
CD45 FITC was used to distinguish leukocytes from any red blood cells and debris. Living cells were distinguished from dead cells by being negative for 7-AAD. Once gated for a living leukocyte, T cells were determined by being both positive for CD45 and CD3, while KG1a cells were determined by being both positive for CD45 and CD34 cells. The exact cell numbers in the pre- and post- TCD samples were determined by using the parallel control of TruCount analysis method following the manufactures protocol. (BD Biosciences, Cat # 340334)
Evaluation of separation performance
The extent of T cell depletion and cell recovery (including of CD34+ cells) were used as parameters to evaluate the efficacy of performance of the QMS device. The extent of T cell depletion was expressed as:
| (1) |
where NInitial is the initial number of total cells in the injected sample, FT,Initial is the initial fraction of cells that are T-cell, NFinal is the final number of cells in the depleted cell suspension, and FT, Final is the fraction of cells that are the T-cells. Unless otherwise stated, the fractions used were obtained from flow cytometry analysis and the cell numbers were determined by the TruCount method.
Cell recovery was calculated for non-T cells as well as for CD34+ cells, as follows:
| (2) |
| (3) |
where FN,Initial and FC, Initial are the fraction of the non T-cell population and CD34+ expressing cells in the sample injected, respectively.
Limited dilution assays
In addition to flow-cytometric assessment of the extent of T cell depletion, we also performed mixed lymphocyte cultures and limiting dilution assays to assess residual T cell alloreactivity after T cell depletion. We used the methodology of Kawanishi et al. [22] and Kernan et al. [23]. Briefly, the cell suspension in which the presence of T-cells was to be tested was referred to as the responders, or “A” cells, and the stimulator cells as “B”. Cells were maintained in RPMI-1640 medium (ATCC, USA) supplemented with 10 % heated Human AB serum (Invitrogen, USA), 1% penicillin/streptomycin (Invitrogen, USA), 20 μl/ml PHA (BD Biosciences, San Jose CA, USA) and 50 units/well IL-2 (Peprotech, USA). For the pre-T-cell depletion, TCD, sample cells (A) were cultured in a 96-well V bottom tissue culture plate at a final volume of 100 μl and stimulated with 104 irradiated (30Gy) cells (B). Five concentrations of responder cells were used: ranging from 1×10³, 5×10², 1×10², 10, and 1 cells/well. In control cultures, only 104 irradiated stimulator cells, B, were cultured in the wells. For the post-TCD sample, the “A” cells were used at dilutions of: 1×10⁵, 1×10⁴, 1×10³, 1×10² and 10 cells/well, all cultured with 1×10⁵ irradiated (30Gy) cells (B). Correspondingly, 1×10⁵ irradiated cells were cultured as controls. In the experiments, 24 replicate wells were used for each dilution. The culture was incubated at 37 °C with 5% CO2, and 50 μl culture medium was fed for each well on the 6th and 12th day. On the 14th day, the cells were transferred to the flat bottom tissue culture plate, and were labeled with BrdU at a concentration of 10 μM and incubated at 37 °C with 5% CO2 for 4 hours. BrdU is an analogue of thymidine which binds to newly synthesized DNA of replicating cells; thereby labeling actively proliferating (clonable) cells.
On the 15th day, the cells were centrifuged at 300× g for 10 minutes, and the cell pellets were dried. 200 μl/well FixDenat solution was next added into the wells, and the suspension was incubated for 30 minutes at room temperature. After flicking off the FixDenate solution, 100 μl/well anti-BrdU-POD solution was used, and the suspension was incubated for 90 min at room temperature. After rinsing each well with 250 μl washing solution three times, 100 μl/well substrate solution was added into each well. Finally, the absorbance at 370 nm was measured in 30 minutes.
The analysis method of Taswell et al. [24] was employed to quantify the number of clonable T cells in the pre and post TCD fraction using CTLp software (edited by Kaz Matsuki). To limit the probability of false positives, individual wells were considered positive when the BrdU incorporation exceeds the mean of the control samples by at least 3 standard deviations (SD) [24].
Statistical analysis
Unless specially stated, the data are shown as medians and ranges in the text. Statistical analyses on the optimization experiments were performed using JMP software (SAS Institute, Cary, NC, USA) with the significance defined as P value less than 0.05. In addition, difference between log depletion of T cells measured by flow analysis and limiting dilution assay was analyzed by student’s T test (paired testing). P value less than 0.05 was considered to represent statistically significant difference.
Optimization of QMS operation
Previous theoretical and experimental studies have revealed that cell separation performance in the QMS is governed by several key parameters: flow rate, magnetophoretic mobility of the targeted cells, and cell feed concentration. To maximize the performance in this study with respect to cell throughput, the cell feed concentration was set at 107 cells/ml. This left the optimization of the magnetophoretic mobility of the targeted cells and the flow rate through the system.
While theoretical principles guided our choices of the ranges of operational parameters, we have observed significant variability, not all of which can be explained by our current understanding of all of the relevant variables. Consequently, to more rapidly optimize the immunomagnetic labeling and flow rates through the separator, a factorial design was employed guided by JMP software. Two variables with respect to immunomagnetically labeling the cells tested: Dynabead labeling concentration, and labeling times: 50, 100 to 150 μl of Dynabeads solution per 107 cells, and 30, 45, and 60 minutes, respectively. In addition, three flow rates were investigated: 3, 6 and 10 ml/min. To determine the impact of the operating parameters on T cell log10 depletion and recovery of CD34+ cells, which we wish to optimize, the following empirical relationships were used:
| (4) |
or
| (5) |
i=1, 2, 3,…17
Each of the operating variable were normalized, and each Buffy coat was designated with a number, i. The values of unknown coefficients, a, b, c, and vi, were solved by the JMP software by methods of least squares.
Results
A total of 39 separations using the simulated leukaphoresis cell suspension of 3×10⁷ cells/ml from 17 different donors’ buffy coats (note, some buffy coats were split into multiple samples for different separations) was conducted and analyzed using the above equations and JMP software. As would be expected, after removal of red blood cells with a Ficol separation, a coulter counter comparison of the Ficol separated buffy coat to the leukaphoresis product from OSU Bone Marrow Transplant laboratory indicated a similar composition with respect to distribution between cell size (i.e. lymphocytes and monocytes). Specifically, with respect to the type of nucleated cells present: 39.9 versus 45.3% for lymphocytes, 9.2 versus 12.5% for monocytes, and 50.9 versus 42.2% for granulocytes, for buffy coat and leukaphoresis product, respectively. Of even more importance, the average percentage of the nucleated cells that were CD3+CD45+ was 24.2 ± 7.2 percent, while for the leukaphorsis product the average CD3+ population was 31 ± 10.7 percent.
The solution to Equations 4 and 5 provide numerical values to each of the coefficients: a, b, c, vi, and “P” values. From the numerical value of the coefficients and the “P” value, a measure of the relative importance of contribution of the specific variable associated with the specific coefficient can be obtained. Such an analysis indicated that the donor from which the buffy coat originated is the most significant factor effecting the log10 depletion of T cells in QMS separation (P=0.024), but a minor effect on the recovery of spiked HSC (P=0.085). In terms of the variables which the researcher/operator can control, the flow rate was the most significant factor on CD34+CD45+ recovery (P=0.024). No significant influences on the separation performance observed with respect to the immunomagnetic labeling time. Figures 2a and 2b present the effect of flow rate in the QMS on T-cell depletion and CD34+CD45+ recovery.
Figure 2.
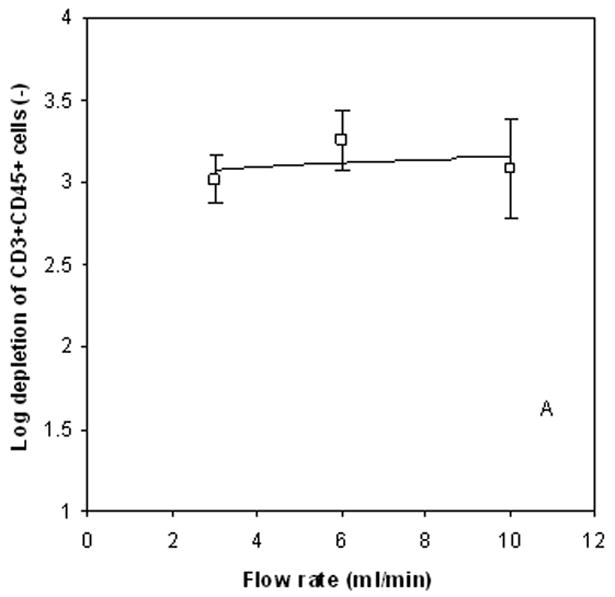

Log10 depletion of CD3+/CD45+ cells as a function of flow rate, 2a, and recovery of spiked CD34+ cells as a function of flow rate, 2b.
From this optimization analysis, and the need to as rapidly as possible process the cell suspension, the following optimized values were chosen for the QMS system: 6 ml/min flow rate, 30 min immunomagnetic labeling time constant, 50 μl Dyanbeads per 107 cells, and 1×10⁷ cells/ml cell feed concentration. These operational conditions correspond to a cell feed to the system of 106 cells/s
Results of T cell depletion using optimized protocol
Typically, 1–3 ×10⁸ PBLs can be collected from one buffy coat after a Ficoll processing step. Thus, to evaluate the reproducibility of the QMS system for T cell depletion using these optimized conditions, six reduplicate experiments utilizing a full buffy coat bag (6 different donors) of modified buffy coats (spiked with KG1a cells in the range of 0.5–5 %) were used to deplete CD3+ cells.
Figure 3 presents a representative FCM analysis implemented to assess T cell depletion as described in the experimental methods above. Figures 3a through 3b show the initial gating used to discriminate between PBLs, red blood cells and debris (3a), and between dead and viable cells (3b). Figures 3c and 3d present events from the gated R2 region of viable T cells and KG1a cells (upper right quadrant), prior to sorting. In contrast, Figures 3e and 3f present the recovered non-magnetic fraction indicating a significant depletion of CD3+ CD45+ cells and a high recovery of CD34+CD45+ cells, respectively.
Figure 3.
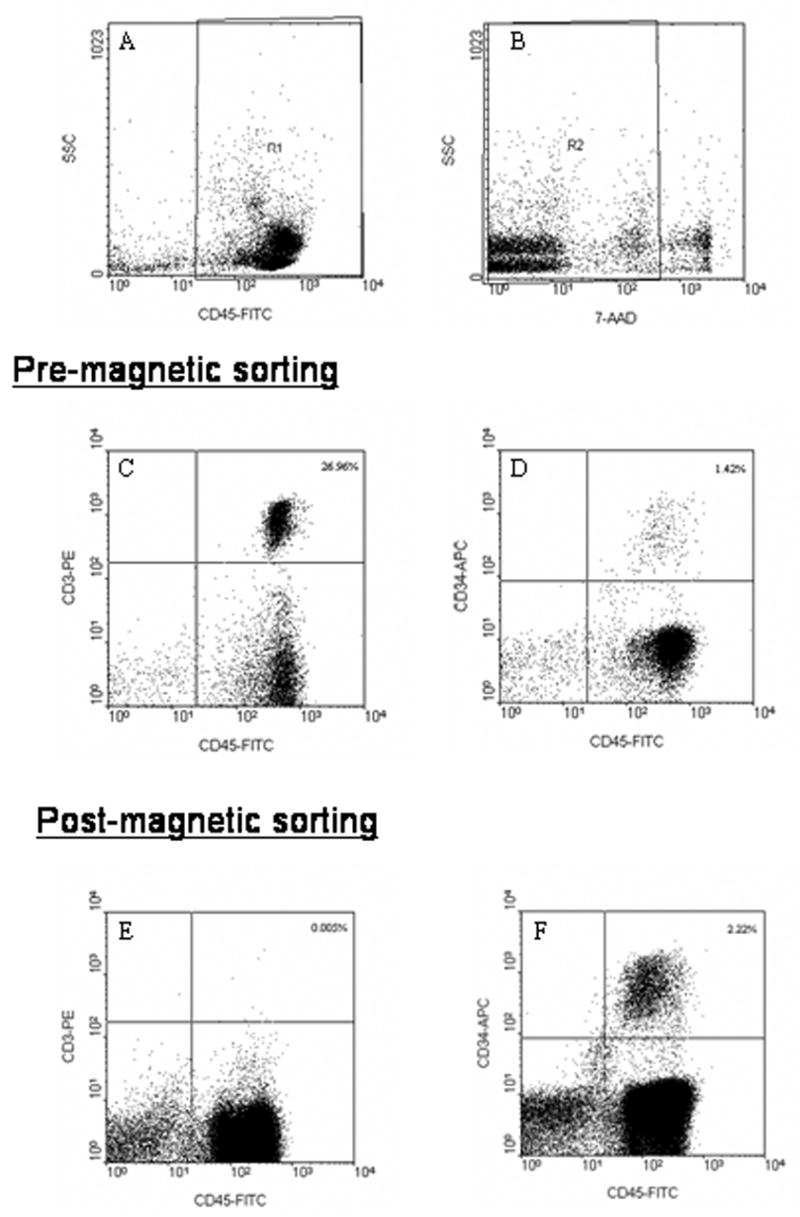
Example of a flow cytometry analysis using a 4-color, 6-parameter analysis methodology: 2a) FITC vs SS; 2b) SS vs 7-ADD. To be counted as a viable T-cell or KG1a cell in the feed (2c and 2d), the non-magnetic fraction (2e or 2f), an event must be in gate R1, it must be 7-ADD negative (belong to R2 gate), and be stained as CD45+/CD3+ (T-cell) or CD45+/CD34+ (KG1a cell), respectively.
A summary of the results from the six, optimized studies is given in Table 2 including means and standard deviations of the initial and separated product. In addition, as a point of comparison, a column of data, next to the right of the mean data of the feed cell suspension, was included of the total number of cells, percent of population that is CD34+ CD45+, and percent of population that is CD3+. This added column of data is from 214 cytokine-mobilized leukaphoresis products obtained at the OSU bone marrow transplant center. The average log10 depletion of CD3+ CD45+ cells in these six experiments was 3.96 ± 0.33 (ranging from 3.53 to 4.34), and an average recovery of the spiked CD34+CD45+ cells of 99.43±4.23% (ranging from 94.38% to 104.90%) at a cell-sorting rate of 1×10⁶ cells/s.
Table 2.
Purity and recovery of CD34+ cells and CD3 cells using QMS with optimized protocol
| 1 | 2 | 3 | 4 | 5 | 6 | Mean ± SD | Mean of Leukaphoresis product (n=214) | |
|---|---|---|---|---|---|---|---|---|
| Starting material | ||||||||
| Cell number to be separated | 1×10⁸ | 1.88×10⁸ | 2.06×10⁸ | 1.85×10⁸ | 1.85×10⁸ | 1.43×10⁸ | 1.68 ± 0.39 × 10⁸ | 297 ± 115 × 108 |
| % nucleated cells CD34+CD45+ | 1.10 | 0.92 | 0.55 | 0.55 | 3.4 | 3.15 | 1.61 ± 1.39 | 0.55 ± 0.35 |
| % nucleated cells CD3+CD45+ | 13.08 | 24.27 | 8.82 | 10.72 | 12.51 | 17.51 | 14.5 ± 5.6 | 31.0 ± 10.7 |
| Total # of CD3+CD45+ cells | 1.33×10⁷ | 4.57×10⁷ | 1.82×10⁷ | 1.98×10⁷ | 2.32×10⁷ | 2.50×10⁷ | 2.42 ± 1.13 × 10⁷ | --- |
| % nucleated cells CD3-CD45+ | 78.73 | 72.62 | 79.97 | 81.31 | 83.70 | 66.53 | 77.1 ± 6.4 | --- |
| Mean frequency of T cell by LDA | 178 | 192 | 57 | 86 | 35 | 128 | 113 ± 64 | --- |
| CD34+CD45+ enriched material | ||||||||
| Cell number after separation | 7.89E×107 | 17.07×10⁷ | 17.68×10⁷ | 15.40×10⁷ | 17.64×10⁷ | 10.69×10⁷ | 1.44 ± 0.14 × 10⁷ | |
| % purity of CD34+CD45+ cells | 1.47 | 0.95 | 0.63 | 0.68 | 3.48 | 4.07 | 1.88 ± 1.51 | |
| % purity of CD3+CD45+ cells | 0.004 | 0.002 | 0.0005 | 0.0009 | 0.004 | 0.003 | 2.4 ± 1.51 × 10⁻³ | |
| CD3+CD45+ cells number | 3.12×10³ | 2.78×10³ | 834 | 1.45×10³ | 6.89×10³ | 3.05×10³ | 3.02 ± 2.11 × 10³ | |
| % purity of CD3-CD45+ cells | 90.16 | 119.69 | 92.51 | 92.71 | 90.68 | 81.20 | 94.5 ± 13 | |
| Log depletion of T cells | 3.62 | 4.22 | 4.34 | 4.13 | 3.53 | 3.91 | 3.96 ± 0.33 | |
| % Recovery of CD34+CD45+ cells | 104.9 | 94.38 | 98.76 | 104.24 | 97.31 | 97.00 | 99.4 ± 4.23 | |
| % Recovery of CD3-CD45+ cells | 90.07 | 114.64 | 99.4 | 94.91 | 103.20 | 91.57 | 99.0 + 9.1 | |
| Mean frequency of T cell by LDA | 615,507 | 632,925 | 281,690 | 408,073 | 57,524 | 261,608 | 3.76 ± 2.2 × 10³ | |
| Log depletion of T cell by LDA | 3.64 | 3.56 | 3.76 | 3.44 | 3.24 | 3.44 | 3.51 ± 0.18 | |
Results of limiting dilution analysis for the clonable T cells
To provide an alternative measure of depletion performance, limiting dilution analysis (LDA) following TCD was performed to estimate the frequencies of remaining T lymphocyte capable of alloreactivity against randomly selected donor leucocytes.
Limiting dilution assay (LDA) has been proven to be a useful tool in the measurement of alloreactive T cell content of the TCD component [25, 26]. In addition, it has been reported that the frequency of total clonable T cells determined by LDA is consistently lower than the total CD3+ cell concentration obtained by flow cytometry analysis [22, 27]. This is believed to be true because not all T-cells are clonable in response to alloreactive stimulation.
The results of LDA are also shown in Table 3. The mean frequency of the clonable T cells in the pre-TCD sample was 1:113 ± 64 (range from 35 to 192), whereas the mean frequency of the residual clonable T cells in the post-TCD sample was 1:376,221±222,625 (range from 57,524 to 632,925). In terms of the corresponding cell yields for each sample, the mean log depletion of the clonable T cells was obtained to be 3.51 ± 0.18.
Table 3.
Cloning efficiency of T cell depletion using flow cytometry analysis and LDA.
| 1 | 2 | 3 | 4 | 5 | 6 | Mean ± SD | |
|---|---|---|---|---|---|---|---|
| Pre-TCD sample | |||||||
| % flow cytometry T cell frequency | 13.08 | 24.27 | 8.82 | 10.72 | 12.51 | 17.51 | |
| % LDA T cell frequency | 0.56 | 0.52 | 1.75 | 1.16 | 2.86 | 0.78 | |
| % Clonable frequency | 4.30 | 2.15 | 19.89 | 10.85 | 22.84 | 4.46 | 10.75±8.77 |
| Post-TCD sample | |||||||
| % flow cytometry T cell frequency | 0.004 | 0.002 | 0.0005 | 0.0009 | 0.004 | 0.003 | |
| % LDA T cell frequency | 0.00016 | 0.00016 | 0.00036 | 0.00025 | 0.0017 | 0.00038 | |
| % Clonable frequency | 4.06 | 7.90 | 71.00 | 27.23 | 43.46 | 12.74 | 27.73±25.68 |
Figure 4 compares the results of the two analysis methods with respect to the log10 depletion of T cells. A Student’s t test, P value (<0.01) confirmed that a significant difference of log depletion exists between the two analysis methods (The analyzed data are presented in Table 3) exists.
Figure 4.
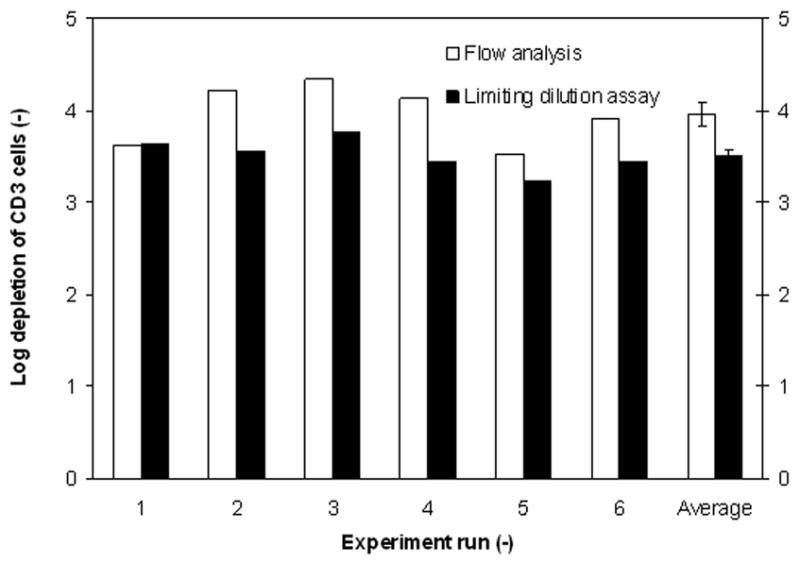
Comparison of flow cytometry and LDA analysis of the log10 depletion of T cells. The last column represents the mean log depletion of each analysis technicque. The error bars represent one SEM from the mean.
A number of potential reasons exist for this difference. First, it has been suggested that back stimulation is possible as a result of IL-2 produced by HLA class II+ (DR+) T-cells present in the stimulator cells. Despite gamma irradiation of these stimulator cells, if these cells had been previously stimulated (i.e. for some reason the donor had stimulated T-cells) the cells would continue to release IL-2, even after gamma irradiation. Honrnick et al. [28] suggested that the depletion of HLA class II+ cells from the irradiated stimulator cells could increase the sensitivity and specificity of the LDA. Second, it has been suggested that a correction factor could be used to relate T-cell content calculated by flow cytometry as compared to LDA, thereby eliminating the variability between flow cytometry and LDA [22, 23]. Such an example of a correction factor is the cloning efficiencies, which for our T cell depletion studies is given by (summarized in Table 3):
| (6) |
As presented in Table 3, the cloning efficiency of pre-TCD samples is 10.75±8.77 %, while the cloning efficiency of post-TCD samples increased to 27.73±25.68 % (n=6). Kawanishi et al. [22] indicated that the cloning efficiency could be improved with addition of IL-4 in LDA culture medium. These potential variables indicate that the complexity of using LDA as an accurate measure of log depletion. However, the final concentration of clonable T-cells is a significant measure of potential of the TCD to mount a GvHD response, and the average number of clonable T-cells is over an order of magnitude lower than that measured by flow cytometry (0.0005 versus 0.0024 %).
Discussions
While there are extensive reports of the use of commercial immunomagnetic cell sorting systems for positive selection of cells, including clinical scale selections of CD34+ cells for transplantation, fewer reports exist of the approach taken in this work, namely, the one step depletion of CD3+ T-cells. However, as mentioned previously, several of the more relevant studies are summarized in Table 1. A cell separation process which produces a highly depleted T-cell product, with a high recovery of HSC, with a high cell throughput, would be a highly valuable, clinical process. While a high level of depletion of T-cells on a clinical scale have been obtained, the level of recovery of CD34+ cells is sub optimal, requiring larger samples to be sorted to obtain a sufficient number of CD34+ cells for a transplant.
It has been suggested that a successful bone marrow transplant requires a dose of CD34+ cells of ≥1 × 10⁶/kg of patient body weight. Given a body weight of 80 kg, that would require ≥ 8 × 10⁷ CD34+ cells. Figure 5 is a plot of the total number of nucleated cells needed for sorting as a function of the initial CD34+ concentration. The total number of CD34+ assumed in the final product was 1 × 10⁸, and the three lines correspond to different percent recoveries of the CD34+ cells in the final product. The right y-axis is the time it would take, in minutes, based on the sorting speed achieve in this manuscript, 1 × 10⁶ cells/s.
Figure 5.
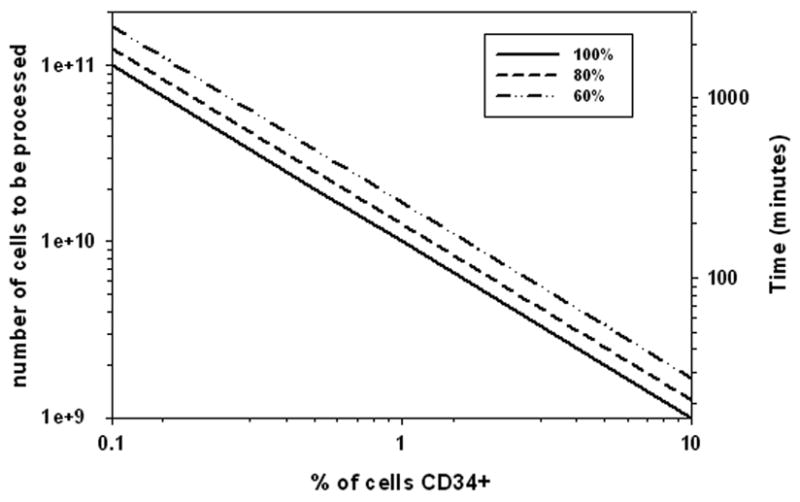
A plot of the total number of nucleated cells needed for sorting as a function of the initial CD34+ concentration. The total number of CD34+ assumed in the final product was 1 × 10⁸, and the three lines correspond to different percent recoveries of the CD34+ cells in the final product.
Clearly, both the percent of CD34+ cells in the feed and the percent recovery is important with respect to the size of the initial sample to be sorted. While the initial percent of CD34+ cells is independent of the separator performance, the difference between 60 and 100% recovery, which is a function of the separator performance, has an important effect (approximately two fold) on the both the size of the initial sample, and correspondingly, the time it takes.
Using a conservative estimate of 90% recovery of the CD34+ cells (note we achieved 99% recovery in this study) and an initial estimate of only 0.5% CD34+ cells in the donor sample (See Table 2), a total nucleated sample size of 2 × 10¹⁰ cells would need to be sorted. Also, at a final T-cell content of 0.0024 %, 4.32 × 10⁷ T-cells would be infused into the patient, or 5.3 × 10³ T-cells/kg body weight based on flow cytometry. At the current sorting rate presented above with the QMS system, the sorting of 2.0 × 10¹⁰ cells will take approximately 300 minutes.
Given the importance of removing T-cells from a potential transplant, in this study we used a more advanced flow cytometry analysis methodology which included the use of a BD FACSAria. This fully digital FACSAria allows automatic compensations for the four-color analysis after the input of appropriate single color controls. It is suggested that the gating strategy used, namely, for an event to be considered a T-cell it must be viable, CD45 positive, and CD3 positive, the use of automatic (as opposed to operator) color compensation, and the collection of 200,000 events provides more accurate measures of T-cell composition, both prior and after magnetic depletion than is typically obtained. Given the routine use and speed of FACS, the improved FACS analysis methodology used in this study, and inherit variability of LDA, we believe that FACS methodology is a superior analysis methodology.
The entire volume of the flow channel used in our QMS system is 16.7 ml, and if we assume the diameter of a PBLs is 8 μm, the average percentage of CD3+ T cells in PBLs is 30%, and 40% of the volume in the cell pellet is void, we found that the volume of unwanted T cells deposited in the flow column of QMS system is only 4.2 mls. Therefore, one disposable flow channel could be employed for one clinical sample.
In summary, a number of points should be made. First, a simple, one step, no wash labeling protocol was used which only takes on the order of 30 minutes to label the cells. Second, on the order of a four log10 depletion of T-cells was obtained. Third, a 99% recovery of a spiked, surrogate, HSC was obtained. Fourth, this performance was obtained at a rate of 1 × 10⁶ cells/s. We suggest that this system will provide superior performance with respect to T-cell depletion and CD34+ recovery for clinical allogenic bone marrow transplant s. Ongoing studies, on a clinical scale are being conducted to demonstrate this claim.
Acknowledgments
This work has been supported in part by the National Science Foundation (BES-0124897 to J.J.C.) the National Cancer Institute (R01 CA62349 to M.Z., R01 CA97391-01A1 to J.J.C.) and the National Institute of Allergy and Infectious Diseases (R01 AI056318 to S.S.F.).
Footnotes
Publisher's Disclaimer: This is a PDF file of an unedited manuscript that has been accepted for publication. As a service to our customers we are providing this early version of the manuscript. The manuscript will undergo copyediting, typesetting, and review of the resulting proof before it is published in its final citable form. Please note that during the production process errors may be discovered which could affect the content, and all legal disclaimers that apply to the journal pertain.
References
- Aversa F, Martelli MF. Transplantation of haploidentically mismatched stem cells for the treatment of malignant disease. Springer Semin Immun. 2004;26:155–168. doi: 10.1007/s00281-004-0161-7. [DOI] [PubMed] [Google Scholar]
- Aversa F, Tabilio A, Terenzi A, et al. Successful engraftment of T-cell-depleted haploidentical “three-loci” incompatible transplants in leukemia patients by addition of recombinant human granulocyte colony-stimulating factor-mobilized peripheral blood progenitor cells to bone marrow inoculum. Blood. 1994;84(11):3948–3955. [PubMed] [Google Scholar]
- Aversa F, Tabilio A, Velardi A, et al. Treatment of High-Risk Acute Leukemia with T-Cell–Depleted Stem Cells from Related Donors with One Fully Mismatched HLA Haplotype. The New England Journal of Medicine. 1998;339:1186–1193. doi: 10.1056/NEJM199810223391702. [DOI] [PubMed] [Google Scholar]
- Barfield RC, Otto M, Houston J, et al. A one-step large-scale method for T- and B-cell depletion of mobilized PBSC for Allogeneic transplantation. Cytotherapy. 2004;6:1–6. doi: 10.1080/14653240310004411. [DOI] [PubMed] [Google Scholar]
- Barnett D, Janossy G, Lubenko A, et al. Guideline for the flow cytometric enumeration of CD34+ haematopoietic stem cells. Prepared by the CD34+ haematopoietic stem cell working party. General Haematology Task Force of the British Committee for Standards in Haematology. Clin Lab Haematol. 1999;21(5):301–308. doi: 10.1046/j.1365-2257.1999.00253.x. [DOI] [PubMed] [Google Scholar]
- Clarke E, Potter MN, Oakhill A, et al. A laboratory comparison of T cell depletion by CD34+ cell immunoaffinity selection and in vitro Campath-1M treatment: clinical implications for bone marrow transplantation and donor leukocyte therapy. Bone Marrow Transplant. 1997;20(7):599–605. doi: 10.1038/sj.bmt.1700937. [DOI] [PubMed] [Google Scholar]
- Debelak J, Shlomchik MJ, Snyder EL, et al. Isolation and flow cytometric analysis of T-cell-depleted CD34+ PBPCs. Transfusion. 2000;40(12):1475–1481. doi: 10.1046/j.1537-2995.2000.40121475.x. [DOI] [PubMed] [Google Scholar]
- De Haan A, Van Der GI, Van Der BW, et al. Detection of alloreactive T cells by flow cytometry: a new test compared with limiting dilution assay. Transplantation. 2002;74(4):562–570. doi: 10.1097/00007890-200208270-00023. [DOI] [PubMed] [Google Scholar]
- Gaipa G, Dassi M, Perseghin P, et al. Allogeneic bone marrow stem cell transplantation following CD34+ immunomagnetic enrichment in patients with inherited metabolic storage diseases. Bone marrow transplantation. 2003;31(10):857–860. doi: 10.1038/sj.bmt.1704024. [DOI] [PubMed] [Google Scholar]
- Gordon PR, Leimig T, Mueller I, et al. A large-scale method for T cell depletion: towards graft engineering of mobilized peripheral blood stem cells. Bone Marrow Transplantation. 2002;30:69–74. doi: 10.1038/sj.bmt.1703619. [DOI] [PubMed] [Google Scholar]
- Hornick PI, Brookes PA, Mason PD, et al. Optimizing a limiting dilution culture system for quantifying the frequency of interleukin-2-producing alloreactive T helper lymphocytes. Transplantation. 1997;15:472–479. doi: 10.1097/00007890-199708150-00017. [DOI] [PubMed] [Google Scholar]
- Hoyos M, McCloskey K, Moore L, et al. Pulse-injection studies of blood progenitor cells in a quadrupole magnetic flow sorter. J Separation Science and Technology. 2002;37(4):1–23. [Google Scholar]
- Hoyos M, Moore LR, McCloskey KE, et al. Study of magnetic particles pulsed-injected into an annular SPLITT-like channel inside a quadrupole magnetic field. J Chromatogr A. 2000;903(1–2):99–116. doi: 10.1016/s0021-9673(00)00879-7. [DOI] [PubMed] [Google Scholar]
- Jing Y, Moore LR, Schneider T, et al. Negative Selection of Hematopoietic Progenitor Cells by Continuous Magnetophoresis. Experimental Hematology. 2007;35(4):662–672. doi: 10.1016/j.exphem.2006.12.009. [DOI] [PubMed] [Google Scholar]
- Kawanishi Y, Passweg J, Drobyski WR, et al. Effect of T cell subset dose on outcome of T cell-depleted bone marrow transplantation. Bone marrow Transplantation. 1997;19:1069–1077. doi: 10.1038/sj.bmt.1700807. [DOI] [PubMed] [Google Scholar]
- Keever-Taylor CA, Craig A, Molter M, et al. Complement-mediated T-cell depletion of bone marrow: comparison of T10B9.1A-31 and Muromonab-Orthoclone OKT3. Cytotherapy. 2001;3(6):467–481. doi: 10.1080/146532401317248072. [DOI] [PubMed] [Google Scholar]
- Keran NA, Flomberg N, Collins N, et al. Quantitation of T-lymphocytes in human bone marrow by a limiting dilution assay. Tansplantation. 1985;40:317–322. doi: 10.1097/00007890-198509000-00019. [DOI] [PubMed] [Google Scholar]
- Lacerda JF, Martins C, Carmo JA, et al. Haploidentical stem cell transplantation with purified CD34 cells after a chemotherapy-alone conditioning regimen. Biol Blood Marrow Transplant. 2003;9(10):633–642. doi: 10.1016/s1083-8791(03)00263-5. [DOI] [PubMed] [Google Scholar]
- Lang P, Bader P, Schumm M, et al. Transplantation of a combination of CD133+ and CD34+ selected progenitor cells from alternative donors. Br J Haematol. 2004;124(1):72–79. doi: 10.1046/j.1365-2141.2003.04747.x. [DOI] [PubMed] [Google Scholar]
- Lang P, Schumm M, Greil J, et al. A comparison between three graft manipulation methods for haploidentical stem cell transplantation in pediatric patients: preliminary results of a pilot study. Klin Padiatr. 2005;217(6):334–338. doi: 10.1055/s-2005-872529. [DOI] [PubMed] [Google Scholar]
- Lara O, Tong X, Zborowski M, et al. Enrichment of rare cancer cells through depletion of normal cells using density and flow-through, immunomagnetic cell separation. Exp Hematol. 2004;32(10):891–904. doi: 10.1016/j.exphem.2004.07.007. [DOI] [PubMed] [Google Scholar]
- Lara O, Tong X, Zborowski M, et al. Comparison of two immunomagnetic separation technologies to deplete T cells from human blood samples. Biotechnol Bioeng. 2006;94(1):66–80. doi: 10.1002/bit.20807. [DOI] [PubMed] [Google Scholar]
- Martin-Henao GA, Picon M, Amill B, et al. Combined positive and negative selection from allogeneic peripheral blood progenitor cells (PBPC) by use of immunomagnetic methods. Bone Marrow Transplant. 2001;27:683–687. doi: 10.1038/sj.bmt.1702860. [DOI] [PubMed] [Google Scholar]
- Russell CA, Brondsted L, Vindelov LL. Design of limiting dilution analysis experiments for helper T lymphocyte precursor frequency determination in the context of allogeneic bone marrow transplantation. J Immunol Methods. 1999;225(1–2):113–124. doi: 10.1016/s0022-1759(99)00035-6. [DOI] [PubMed] [Google Scholar]
- Schattenberg A, Witte TD, Preijers F, et al. Allogeneic bone marrow transplantation for leukemia with marrow grafts depleted of lymphocytes by counterflow centrifugation. Blood. 1990;75(6):1356–1363. [PubMed] [Google Scholar]
- Schumm M, Handgretinger R, Pfeiffer M, et al. Determination of residual T- and B-cell content after immunomagentic depletion: proposal for flow cytometric analysis and results from 103 separations. Cytotherapy. 2006;8:465–472. doi: 10.1080/14653240600932787. [DOI] [PubMed] [Google Scholar]
- Taswell C. Limiting dilution assays for the determination of immunocompetent cell frequencies. I. Data analysis. The Journal of Immunology. 1981;126(4):1614–1619. [PubMed] [Google Scholar]
- Vij R, Brown R, Shenoy S, et al. Allogeneic peripheral blood stem cell transplantation following CD34+ enrichment by density gradient separation. Bone Marrow Transplantation. 2000;25:1223–1228. doi: 10.1038/sj.bmt.1702427. [DOI] [PubMed] [Google Scholar]
- Young JW, Papadopoulos EB, Cunningham I, et al. T-cell-depleted allogeneic bone marrow transplantation in adults with acute nonlymphocytic leukemia in first remission. Blood. 1992;79(12):3380–3387. [PubMed] [Google Scholar]