Abstract
PURPOSE Long-term shifts in specialty choice and health workforce policy have raised concern about the future of primary care in the United States. The objective of this study was to examine current use of primary and specialty care across the US population for policy-relevant subgroups, such as disadvantaged populations and persons with chronic illness.
METHODS Data from the Medical Expenditure Panel Survey from 2004 were analyzed using a probability sample patients or other participants from the noninstitutionalized US population in 2004 (N = 34,403). The main and secondary outcome measures were the estimates of the proportion of Americans who accessed different types of primary care and specialty physicians and midlevel practitioners, as well as the fraction of ambulatory visits accounted for by the different clinician types. Data were disaggregated by income, health insurance status, race/ethnicity, rural or urban residence, and presence of 5 common chronic diseases.
RESULTS Family physicians were the most common clinician type accessed by adults, seniors, and reproductive-age women, and they were second to pediatricians for children. Disadvantaged adults with 3 markers of disadvantage (poverty, disadvantaged minority, uninsured) received 45.6% (95% CI, 40.4%–50.7%) of their ambulatory visits from family physicians vs 30.5% (95% CI, 30.0%–32.1%) for adults with no markers. For children with 3 vs 0 markers of disadvantage, the proportion of visits from family physicians roughly doubled from 16.5% (95% CI, 14.4%–18.6%) to 30.1% (95% CI, 18.8%–41.2%). Family physicians constitute the only clinician group that does not show income disparities in access. Multivariate analyses show that patterns of access to family physicians and nurse-practitioners are more equitable than for other clinician types.
CONCLUSIONS: Primary care clinicians, especially family physicians, deliver a disproportionate share of ambulatory care to disadvantaged populations. A diminished primary care workforce will leave considerable gaps in US health care equity. Health care workforce policy should reflect this important population-level function of primary care.
Keywords: Access to health care, delivery of health care, health services research
INTRODUCTION
Long-term shifts in physician specialty choice and recent market trends in health care delivery have raised concern about the future of primary care in the United States.1 The promise of an institutionalized role for primary care in managed care organizations has evaporated, leaving only the residue of a gatekeeping backlash.2 Declaring that primary care “lacks broad consumer support,”3 the Council on Graduate Medical Education has abandoned its goal of expanding the primary care physician workforce.3–6 Entry of US medical graduates into generalist residency positions is declining,3,7 and unlike the ground-shaking Institute of Medicine reports on quality of care that followed it, the 1996 report on “Primary Care in a New Era” seems to have not motivated much change.8
An important shortcoming of the workforce debate has been its individualistic, market-based focus on current health care utilization and future projections,9 which ignore a critical feature of primary care: over and above its role in delivering direct care to individual patients, primary care has important systems-level effects for populations and health systems.10,11 Examples include enhancing the effectiveness of downstream clinicians by evaluating and triaging patients at their point of entry to the health care system,12 supporting the health system’s adaptive capacity to buffer workforce shortages across specialty domains, and increasing health care equity by facilitating access for patients who are underserved because of geography or economic disadvantage.13,14 Certain important indicators such as equity can, in fact, be defined only at the system-level and lack an individual-level counterpart.
Within that context, the purpose of this study was to perform a population-based assessment of the extent to which Americans access both primary and specialty ambulatory care, and to examine how equitable contact with different types of clinicians is across demographic and policy-relevant subgroups, such as those disadvantaged by low income, minority status, or uninsurance, as well as persons with chronic illness.15
Equity can be defined as “the absence of systematic disparities in health (or in the major social determinants of health) between social groups who have different levels of underlying social advantage.”16 Equity in health care entails “equal utilization for equal need.”17 In this study, the benchmark for equity was equal utilization of ambulatory care among advantaged and disadvantaged groups. This benchmark for health system performance is conservative because need—morbidity—is strongly associated with social and economic disadvantage.18–22 At the population level, this association is one of the most robust findings in the epidemiologic literature.
By disaggregating visits to specific types of clinicians (including medical and surgical specialists, primary care physicians, nurses, and physician’s assistants), an access profile for demographic subpopulations can be examined for each clinician type. As a de facto summary outcome measure reflecting the many determinants of differential access across population subgroups, the access profile can shed light on the contributions of different clinician types to health care equity, one of many important considerations in the health care workforce debate.
METHODS
The data source is the 2004 Medical Expenditure Panel Survey (MEPS). Fielded annually since 1996, MEPS surveys a multistage probability sample of the civilian, noninstitutionalized US population and gathers data on health care use, expenditures, insurance coverage, and sources of payment.23 I used demographic data from the MEPS Household Component and data on visits to clinician offices and outpatient facilities from 2 files in the Medical Provider Component. For the latter, MEPS surveyors augment household-reported data on health care use with information obtained directly from the relevant clinicians. Thus I ultimately linked data on 34,403 persons in the household file with 111,987 office visits and 7,159 outpatient facility visits (including hospital-based) to physicians, nurse-practitioners, and physician’s assistants. Only face-to-face visits were counted. The overall response rate for the 2004 MEPS was 64%.
The Medical Provider Component files identify the type of clinician seen for the ambulatory visit, specified by household respondents from a list of 34 clinician types. The following original MEPS clinician categories were retained: general internists, pediatricians, obstetrician-gynecologists, psychiatrists, nurses, and physician’s assistants. New categories were created for family physicians (combining family practice and general practice), medical specialists (combining allergy/immunology, cardiology, dermatology, endocrinology, hematology, nephrology, neurology, oncology, pulmonology, and rheumatology), surgical specialists (combining anesthesiology, general surgery, ophthalmology, otorhinolaryngology, plastic surgery, proctology, thoracic surgery, and urology), and other specialists (combining nuclear medicine, pathology, physical medicine and rehabilitation, radiology, other unspecified). Although osteopath was a separate category, only 1% of adults and 0.4% of children reported any visit with them. As osteopaths account for 8.1% of physician office visits,24 it is likely that osteopaths were identified by their specialty rather than their degree.
There were several challenges when categorizing clinicians. Separate categories for general and subspecialty pediatricians were not available in the MEPS, precluding any definitive differentiation (Approximately 70% of pediatricians are generalists.25). It is likely, however, that the pediatrician label was applied mainly to general pediatricians, because 18.9% of children saw medical, surgical, or other specialists as categorized above, a rate consistent with the 18.6% to 28.8% range observed in a recent study.26 Visits to nonphysician practitioners introduced 2 problems. First, the MEPS did not differentiate nurse-practitioners from registered nurses. To help distinguish visits to these 2 nursing roles, I examined data on visit content that ascertained the visits’ primary activity. Many activities would clearly fall within the scope of advanced practice nursing, eg, checkups, diagnosis or treatment, emergency care, psychotherapy or counseling, maternity care, or well-child care; but 2 categories did not: immunizations/shots and “other.” The primary activity for nurse visits was immunizations in 19% of visits compared with only 1.6% for physician visits. The “other” category was used for 9% of nurse visits and 2% of physician visits. Because I could not justify deleting these visits for nurses and not physicians, I chose to retain them in our analyses, realizing that doing so may overestimate the contact rate for nurse clinicians by approximately 20% to 25%. Second, the roles of nurses or physician’s assistants as generalists or specialists were not defined. Although 77.5% of nurse-practitioners work in family practice,27 general internal medicine, or general pediatric practices, less than one-half (45.6%) of physician’s assistants work in such settings.
Analysis
The analytical objectives were (1) to ascertain the fraction of each demographic subpopulation (see below) with at least 1 ambulatory visit to a given type of clinician, and the fraction of all ambulatory visits for each subpopulation that was accounted for by a given type of clinician; and (2) to develop, for each type of clinician, a profile comparing probability of access among the more- and less-advantaged demographic subpopulations. The purpose of this profile was to measure utilization of different clinician types by different subpopulations. Intended as a summary outcome of all the access determinants that differentially affect demographic subpopulations, it should not be construed as a measure of preferential or discriminatory behavior by clinicians.
After categorizing the clinician types, I summed the number of office and outpatient visits for each person in the data set to generate the total number of ambulatory visits to each type of clinician and created a summary dichotomous variable of whether each person had or had not visited that type of clinician in 2004.
I then calculated a series of age- and sex-adjusted point estimates and 95% confidence intervals across population subgroups of 2 primary analytic measures: (1) the proportion of persons in subgroup categories with any visit in 2004 to a specified type of clinician, and (2) visits to each clinician type as a proportion of all ambulatory visits in 2004. The subgroups examined were adults (aged 18 years and older), children (aged less than 18 years), older adults (aged 65 years and older), and women aged 18 to 44 years; income categories; race/ethnicity; rural or urban residence; health insurance status; and presence of a chronic disease. The income measure was family income as a percentage of the census-defined poverty level for a specific family size. The 5 levels examined were less than 100% of poverty level, 100% to 124%, 125% to 199%, 200% to 399% and 400% or greater. Race/ethnicity was also coded into 5 categories based on self-identification: Hispanics, and 4 groups of non-Hispanics: blacks, whites, Asians, and other race. Only Hispanics, non-Hispanic blacks, and non-Hispanic whites were included in analyses of race/ethnicity because of small numbers in the “other” categories. Insurance status was coded into 3 categories: uninsured all of 2004, public insurance all of 2004, or any private insurance (including TRICARE [a military health system] and Veterans Affairs) in 2004. Urban or rural residence was defined by living inside or outside a Metropolitan Statistical Area.
Use of care by persons with specific chronic diseases was examined using MEPS questions asking whether respondents had ever been given the diagnosis of diabetes mellitus, myocardial infarction, stroke, emphysema, or asthma. The first 4 conditions represent 4 of the top 6 causes of death in the United States, whereas asthma is the leading chronic disease of childhood.28
To assess the independent effects of the demographic variables on visits to each type of clinician, I created a separate logistic regression equation for each clinician type, in which any use was the dependent variable, with the independent variables age, sex, income, insurance status, race/ethnicity, and rural or urban residence. For each independent variable, odds ratios of access in less-advantaged groups were compared with the most advantaged reference group.29 Estimates were weighted to represent the noninstitutionalized US population. The effect of the complex survey design on estimated standard errors was accounted for with Taylor series linearization30 using the Stata survey estimation modules (Version 9, Stata-Corp, College Station, Tex).
The analyses used publicly available data files and documentation obtained from the MEPS Web site at the Agency for Healthcare Research and Quality.
RESULTS
In 2004, Americans made 1.12 billion face-to-face medical office and outpatient department visits to physicians or midlevel practitioners, of which 457 million, or 41%, were to family and general practitioners (hereafter referred to as family physicians), general internists, or pediatricians. Nurse-practitioners accounted for 92.5 million visits and physician’s assistants for 13.6 million visits. Table 1 ▶ displays the fraction of US adults who had any contact with primary or specialty ambulatory care in 2004. Family physicians had the highest probability of having had any visit with adults overall, older adults, and reproductive-age women, whereas pediatricians had the highest probability of any visit with children.
1.
Fraction of US Population That Visited Specific Clinician Types in 2004
| Population Group* | Type of Service or Clinician | Any Visit†% (95% CI) |
| Adults | ||
| Any ambulatory visit | 69.6 (68.7–70.6) | |
| Family physician/general practitioner | 43.4 (42.3–44.6) | |
| Surgical specialty | 23.7 (22.8–24.6) | |
| Medical specialty | 20.6 (19.8–21.4) | |
| General internist | 13.5 (12.7–14.3) | |
| Nurse-practitioner | 10.8 (10.0–11.4) | |
| Other specialty | 8.7 (8.2–9.2) | |
| Psychiatrist | 2.9 (2.6–3.2) | |
| Physician’s assistant | 2.8 (2.4–3.2) | |
| Seniors | ||
| Any ambulatory visit | 92.2 (91.1,93.3) | |
| Family physician/general practitioner | 62.7 (60.4–65.0) | |
| Surgical specialty | 49.3 (46.9–51.8) | |
| Medical specialty | 44.7 (42.5–46.8) | |
| General internist | 28.9 (26.7–31.1) | |
| Nurse-practitioner | 18.5 (16.6–20.3) | |
| Other specialty | 16.7 (15.2–18.2) | |
| Physician’s assistant | 3.2 (2.5–3.8) | |
| Psychiatrist | 1.7 (1.1–2.3) | |
| Women aged 18–44 y | ||
| Any ambulatory visit | 71.5 (70.1–72.9) | |
| Family physician/general practitioner | 39.0 (37.3–40.7) | |
| Obstetrician/gynecologist | 31.0 (29.5–32.6) | |
| Surgical specialty | 14.0 (12.9–15.1) | |
| Nurse-practitioner | 12.7 (11.6–13.9) | |
| Medical specialty | 11.2 (10.3–12.2) | |
| General internist | 6.7 (5.8–7.6) | |
| Other specialty | 6.2 (5.4–7.1) | |
| Physician’s assistant | 3.5 (2.8–4.2) | |
| Psychiatrist | 3.0 (2.4–3.5) | |
| Children | ||
| Any ambulatory visit | 70.4 (69.0–71.9) | |
| Pediatrician | 45.3 (43.5–47.3) | |
| Family physician/general practitioner | 20.2 (18.7–21.8) | |
| Surgical specialty | 12.3 (11.2–13.3) | |
| Medical specialty | 6.3 (5.5–7.0) | |
| Other specialty | 2.9 (2.4–3.4) | |
| Nurse-practitioner | 6.4 (5.5–7.2) | |
Note: Percentages sum to more than 100% because persons may have visited multiple clinician types. All estimates weighted to represent civilian noninstitutionalized US population.
CI = confidence interval.
* Adults are persons aged 18 years and older; seniors are persons aged 65 years and older; children are persons aged 0–17 years. Seniors and women aged 18–44 y categories are subsets of the adult category.
† Percentage of specified group with any visit to that type of clinician in an ambulatory setting (office or outpatient department) in 2004.
Next I examined the probability of ambulatory medical care contact for subgroups defined by income, race/ethnicity, rural or urban residence, insurance status, and presence of a chronic disease. Across all 5 income levels, family physicians had contact with 42.5% to 44.8% of adults; only this clinician type had no statistically significant decreases in probability of contact for less-affluent groups (Figure 1a ▶).
Figure 1.
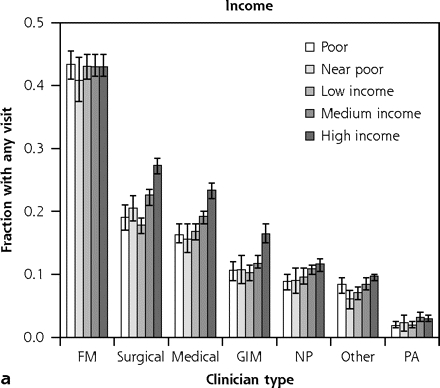
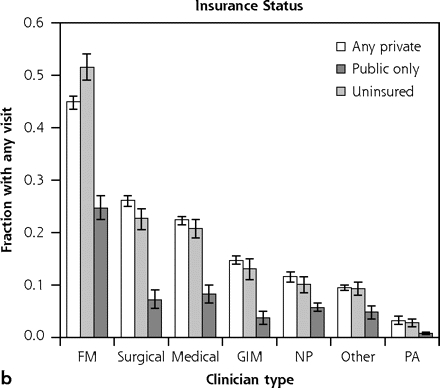
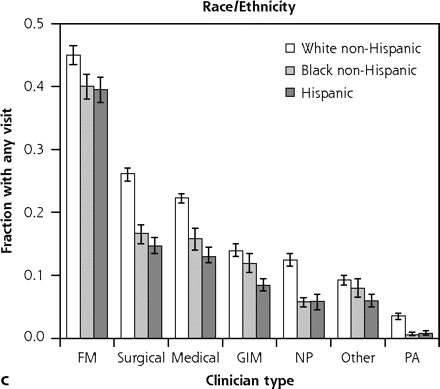
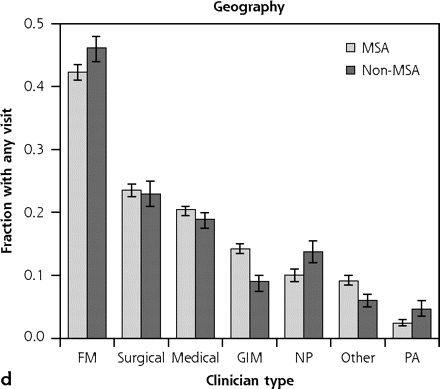
Fraction of population with any access of specified clinician type—adults: disaggregated by income, insurance status, race/ethnicity, and rural or urban residence.
Note: Age- and sex-adjusted estimates, by population subgroups, of the fraction of adults who made any visit in 2004 to specific clinician types. Error bars display 95% confidence intervals for the point estimates.
FM = family medicine; GIM = general internal medicine; MSA = metropolitan statistical area; NP = nurse-practitioner; PA = physician’s assistant.
Contact with all types of clinicians was less common among uninsured adults than for those with public or private insurance (Figure 1b ▶). Adults with public insurance were also less likely than those with private insurance to have had any ambulatory visit with a surgical specialist; trends in a similar direction were evident for clinicians other than family physicians but did not reach statistical significance. In contrast, contact with family physicians was more likely among adults with public than with private insurance.
Black and Hispanic adults were generally less likely to have had an ambulatory visit with any of the clinician types (Figure 1c ▶). For general internists, contact with black patients was not statistically less than for white patients.
The ambulatory visit experiences of children display consistent patterns (Figures 2a,b,d ▶). Children who are less affluent, have public or no insurance, or live in rural areas are significantly less likely to have any visit with a pediatrician. In contrast, there was no gradient for family physician or nurse-practitioner visits by income or insurance status, and rural children were more likely than urban children to have seen these clinician types. Disparities for black and Hispanic children, however, were evident for all 3 clinician categories (Figure 2c ▶).
Figure 2.
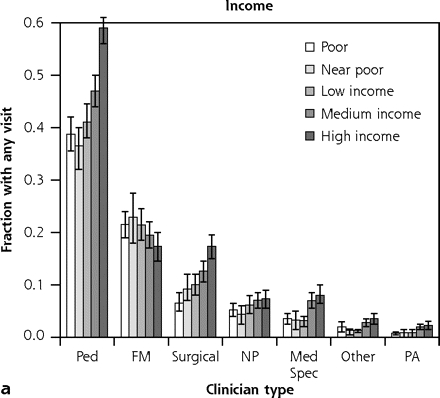
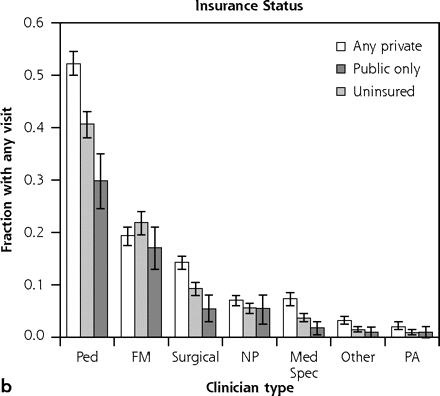
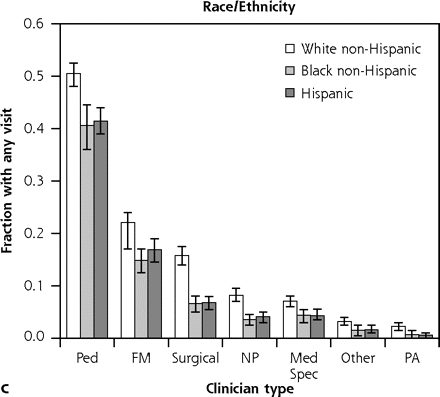
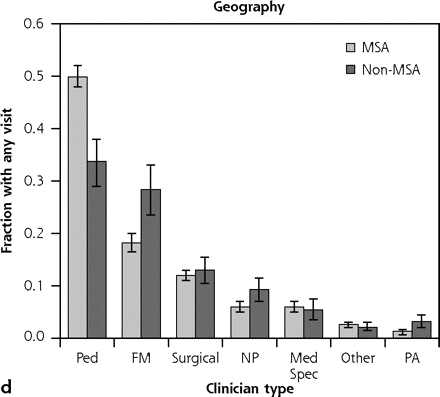
Fraction of population with any access of specified clinician type—children: disaggregated by income, insurance status, race/ethnicity, and rural or urban residence.
Note: Age- and sex-adjusted estimates, by population subgroup, of the fraction of children who made any visit in 2004 to specific clinician types. Error bars display 95% confidence intervals for the point estimates.
FM = family medicine; MSA = metropolitan statistical area; NP = nurse practitioner; PA = physician‘s assistant; Ped = pediatrics;
For both adults and children, the average number of visits displayed similar trends to the probability of any visit (data not shown). This combination resulted in a general pattern of visits to family physicians accounting for a greater proportion of all ambulatory visits at greater levels of disadvantage (Table 2 ▶).
2.
Visits to Family Physicians as Percentage of All Ambulatory Visits
| Subgroup | Adults % (95% CI) | Children % (95% CI) |
| Income as % poverty level | ||
| <100% | 34.1 (31.0–37.2) | 25.1 (21.3–28.9) |
| 100%–124% | 37.3 (33.1–41.6) | 24.0 (18.1–29.1) |
| 125%–199% | 38.1 (35.2–41.2) | 25.6 (20.1–31.0) |
| 200%–399% | 33.8 (31.8–35.9) | 17.1 (14.3–19.8) |
| ≥400% | 27.8 (26.0–29.4) | 13.0 (10.8–15.1) |
| Insurance status | ||
| Any private | 30.4 (29.1–31.8) | 15.9 (14.0–17.8) |
| Public only | 32.7 (29.4–36.0) | 23.3 (19.9–26.7) |
| Uninsured all 2004 | 38.0 (34.7–41.1) | 27.2 (20.0–34.5) |
| Race/ethnicity | ||
| Non-Hispanic white | 30.9 (29.3–32.4) | 17.8 (15.7–19.9) |
| Non-Hispanic black | 32.0 (29.5–34.5) | 16.9 (13.4–20.3) |
| Hispanic | 38.1 (34.9–41.2) | 20.6 (17.1–24.0) |
| Geography | ||
| MSA | 30.2 (28.8–31.5) | 16.1 (14.4–17.8) |
| Non-MSA | 38.6 (36.1–40.1) | 29.3 (23.1–35.4) |
Note: The numerator is number of ambulatory visits by persons in specified subgroup to family physicians; the denominator is number of ambulatory visits by persons in specified subgroup to any type of clinician. Estimates are adjusted for age and sex and weighted to represent the noninstitutionalized US population. χ2 for trend all P <.001, except for race/ethnicity in children, which is P=.83
CI = confidence interval.; MSA: metropolitan statistical area.
In an analysis that examined the cumulative effects of disadvantage, adults without any markers of disadvantage (income below poverty level, uninsured, black or Hispanic race/ethnicity, rural residence) saw family physicians for 30.5% of their ambulatory visits (95% CI, 30.0%–32.1%); for adults with 3 markers of disadvantage, this fraction increased to 45.6% (95% CI, 40.4%–50.7%). Among disadvantaged children, the proportion of visits accounted for by family physicians approximately doubled among children with 3 markers (30.1%; 95% CI, 18.8%–41.2%) compared with no markers of disadvantage (16.5%; 95% CI, 14.4%–18.6%).
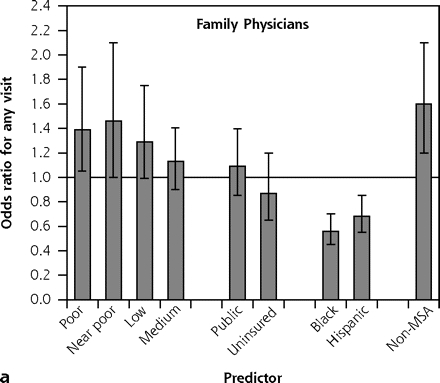
The results of multivariate analyses were generally consistent with the bivariate results. After controlling for age, sex, and the other demographic covariates, family physicians remained the only clinician type with higher odds of use among less-affluent adults (Figure 3 ▶). Blacks were less likely than whites to access any clinician type except general internists and the “other” category of specialists, whereas Hispanics were less likely to access any type of clinician. Among children, those who were less affluent, uninsured, black, Hispanic, or residing in rural areas were much less likely to visit pediatricians than were the comparison groups (Figure 4 ▶). In contrast, rural children were more likely than nonrural children to have visited nurse-practitioners and family physicians, and less-affluent children were more likely than the more-affluent children to have visited family physicians.
Figure 3.
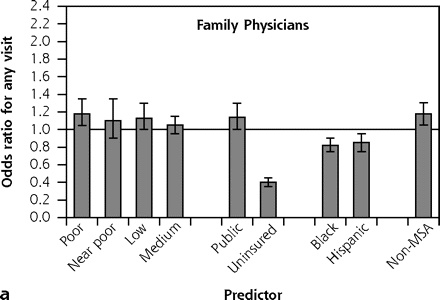
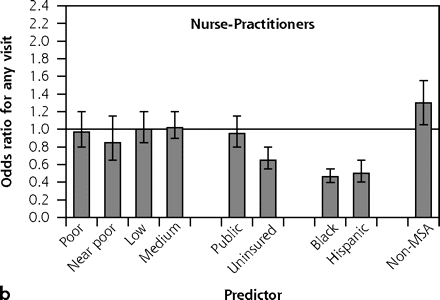
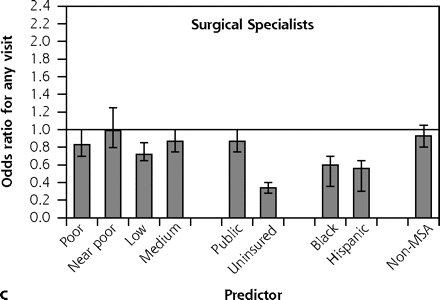
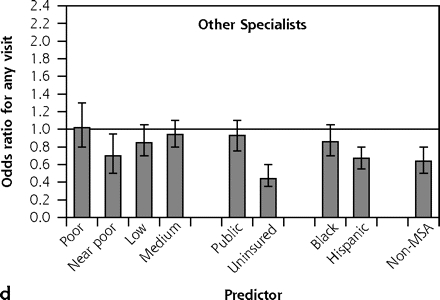
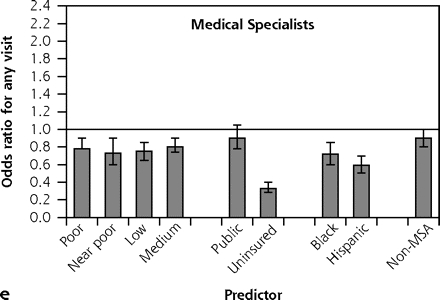
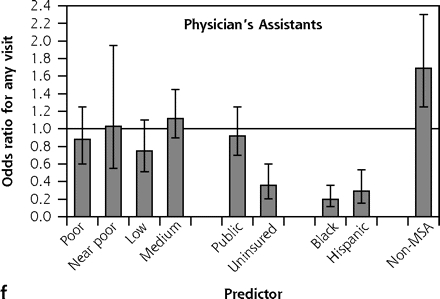
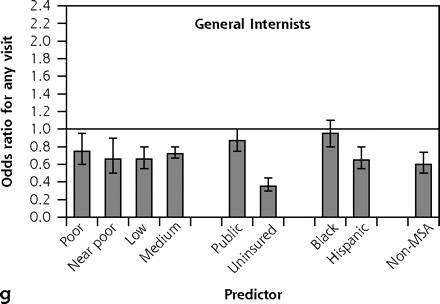
Odds ratios of any access by clinician type—adults.
Note: Each panel displays results from a separate multivariate logistic regression equation; the dependent variable was any visit to the specified clinician type in 2004. Adjusted odds ratios appear on the y-axis, simultaneously adjusting for age, sex, income, health insurance status, race/ethnicity, and rural/urban residence. Reference groups were, respectively, high income, private insurance, white non-Hispanic, and MSA resident. Error bars display 95% confidence intervals for the odds ratios. Horizontal line is drawn at odds ratio = 1.
MSA=metropolitan statistical area.
Figure 4.
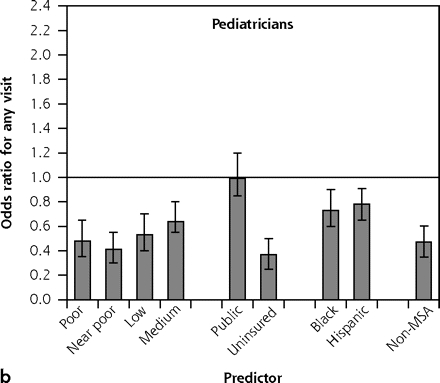
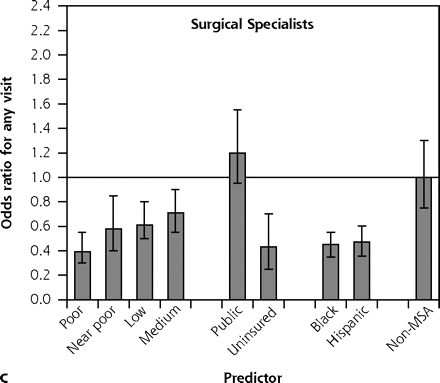
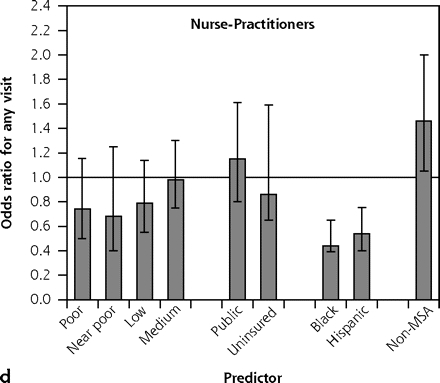
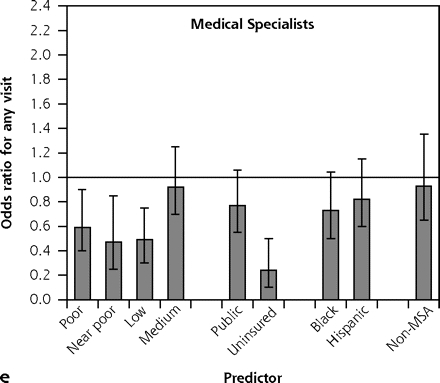
Odds ratios of any access by clinician type—children.
Note: Each panel displays results from a separate multivariate logistic regression equation; the dependent variable was any visit to the specified clinician type in 2004. Adjusted odds ratios appear on the y-axis, simultaneously adjusting for age, sex, income, health insurance status, race/ethnicity, and rural/urban residence. Reference groups were, respectively, high income, private insurance, white non-Hispanic, and MSA resident. Error bars display 95% confidence intervals for the odds ratios. Horizontal line is drawn at odds ratio = 1.
MSA = metropolitan statistical area.
Adults who reported a history of heart attack, stroke, diabetes mellitus, emphysema, or asthma were much more likely to have seen a family physician or general internist than, respectively, a cardiologist, neurologist, endocrinologist, pulmonologist, or for asthma, an allergist or pulmonologist (Table 3 ▶). The only exception to this pattern was that patients who reported having had a heart attack were more likely to have made any visit to a cardiologist than a general internist.
3.
Fraction of Persons with Chronic Diseases Who Visited Specific Clinician Types in 2004
| Patient Group* | Type of Clinician | Any Visit†% (95% CI) |
| Myocardial infarction | Family physician | 54.2 (48.1–60.3) |
| General internist | 24.2 (17.5–38.8) | |
| Cardiologist | 35.6 (27.9–43.2) | |
| Stroke | Family physician/ general practitioner | 62.7 (58.5–67.0) |
| General internist | 15.1 (11.9–19.2) | |
| Neurologist | 11.8 (7.3–16.3) | |
| Diabetes mellitus | Family physician/ general practitioner | 57.7 (53.4–62.0) |
| General internist | 19.8 (16.7–22.9) | |
| Endocrinologist | 13.6 (9.7–17.3) | |
| Emphysema | Family physician | 56.0 (50.0–62.0) |
| General internist | 21.7 (15.0–28.4) | |
| Pulmonologist | 10.7 (7.6–13.7) | |
| Asthma | Family physician | 55.8 (52.5–59.2) |
| General internist | 17.5 (15.1–19.8) | |
| Allergist/Immunologist | 8.1 (6.1–10.0) | |
| Pulmonologist | 7.4 (5.9–9.0)1 |
Note: All analyses adjusted for age and sex; all estimates weighted to represent civilian noninstitutionalized US population.
CI = confidence interval.
* Persons who self-reported the specified disease.
† Percentage of specified group with any visit to that type of clinician in an ambulatory setting (office or outpatient department) in 2004.
DISCUSSION
This study was designed to evaluate the extent to which various types of clinicians are accessed for ambulatory care by policy-relevant demographic subgroups. Our major findings are that primary care clinicians, especially family physicians, are a vital source of care for disadvantaged groups in the United States. In some instances, visits to family physicians and nurse-practitioners display patterns that overturn the inverse care law articulated by Julian Tudor Hart, in which persons with the greatest need for health care have the least access.31 For example, a striking finding is that family physicians and nurse-practitioners do not display an access gradient for low-income or uninsured children. In fact, adults with lower incomes, public insurance, or rural residence are actually more likely to have visited a family physician than those with higher incomes, private insurance, or urban location. In contrast, utilization of general internists by disadvantaged groups resembles their use of medical specialists more than family physicians.
Although the workforce contribution to disparities between urban and rural health care access have been most studied,32,33 there has been less attention paid to different clinicians’ roles in providing access across other subpopulations. In this context, the study supplies individual-level data to support the ecological-level studies that link greater primary care manpower to reduced area-level disparities.11,14,34 A potential explanation for improving population outcomes is that by enhancing access to care for vulnerable populations, primary care clinicians move people from “no care” to “any care” status, the area of the health care utilization curve where benefits of care are steepest.35 Primary care clinicians, especially family physicians, also play an important role in staffing community health centers, an important source of care for disadvantaged populations.36
Overall, 55% of Americans made any visit to a primary care physician in 2004, a contact rate lower than that in many other developed countries. For comparison, the rates in the United Kingdom and the Netherlands, where there is population-based registration with primary care physicians, are, respectively, 78% and 77%, though these data are not as current.37,38 Data from Canada, which lacks registration, are remarkably similar, with 79% of adults having visited a general practitioner in 2000–2001.39 This gap in primary care use—about one-quarter of US residents—suggests an unexploited potential to realize the population benefits of primary care.
Although the proximate cause of disparities is person-level events, macro-level characteristics of the health care system are important upstream drivers of disparities in care delivery. For example, distributional inequities in where physicians choose to practice make board-certified physicians scarce and referral resources inadequate in many areas with concentrated African American populations, creating structural barriers to receiving high-quality care.40 Even where physicians are available, that disadvantaged minorities are under-represented relative to their share of the population means that care may not be culturally competent.41 Our study suggests that the specialty mix of practicing clinicians is another important structural determinant of health care equity.
Although other studies, predominantly those using the National Ambulatory Medical Care Survey (NAMCS),42 have calculated annual visit rates for primary care and other specialties, the NAMCS design is critically limited in evaluating access because it samples only users of ambulatory care, thus precluding estimates of the population fraction that does not use ambulatory services in a given year. A study using the 1996 Medical Expenditure Panel Survey did include nonusers of ambulatory care, but it did not evaluate the contribution of various clinician types or specialties to the care of vulnerable subpopulations.43
A potential criticism of this study is that need for care was not directly ascertained when drawing conclusions about access disparities. Extensive evidence, however, supports our assumptions that black, Hispanic, less-educated, and less-affluent populations bear a greater burden of morbidity and thus have a greater need for health services; the association between social disadvantage and illness is among the most robust in the epidemiologic literature.20,21,44,45 Based on a benchmark of equal access, the degree of disparity would be, if anything, underestimated. Analysis of chronic disease prevalence and general health status in the current MEPS data set is consistent with these patterns (data not shown). Likewise, available data on health care outcomes support the contention that disparities in health care use reflect some degree of underuse by disadvantaged populations rather than simply overuse by more advantaged groups.46
The study is also subject to other potential limitations. First, as previously noted, nonphysician practitioners could not be classified into generalist or specialist roles. Thus, the analyses that classify them as primary care clinicians overestimate their contribution to primary care utilization. Pediatrician specialty and generalist roles were also susceptible to misclassification, though use of specialists by children in the MEPS is consistent with data from other sources.47,48 Second, advanced-practice nurses could not be separated from other nurses; as discussed previously, the result is a 20% to 25% overestimate of nurse-practitioner ambulatory visits. Third, only ambulatory visits were examined. Patterns of care for hospital admissions may differ.
Strengths of the study include independent verification of health care use in the MEPS and nationally representative data. In summary, the data provide evidence that primary care clinicians are an important source of equity in health care. Together with previous findings, the work supports a policy of developing and enhancing the primary care workforce and infrastructure as an important strategy to reduce disparities.
Paradoxically, in an era when reducing disparities is a major public health priority, the primary care enterprise is in jeopardy. Explicitly considering population-level outcomes such as equity in formulating health workforce policy is critical to the health of our most vulnerable populations.
Conflict of interest: none reported
REFERENCES
- 1.American College of Physicians. The impending collapse of primary care medicine and its implications for the state of the nation’s health care: a report from the American College of Physicians. January 30, 2006. http://www.acponline.org/hpp/statehc06_1.pdf. Accessed March 30, 2006.
- 2.Robinson JC. The end of managed care. JAMA. 2001;285(20): 2622–2628. [DOI] [PubMed] [Google Scholar]
- 3.Philibert I. An interview with Carl Getto, MD. ACGME Bulletin. Spring 2004:10–11.
- 4.Council on Graduate Medical Education. Third Report: Improving Access to Health Care Through Physician Workforce Reform: Directions for the 21st Century. Rockville, MD: US Department of Health and Human Services; 1992.
- 5.Salsberg E. Physician Workforce Policy Guidelines for the U.S. for 2000–2020. Presented to the Council on Graduate Medical Education. Bethesda, MD. September 17–18, 2003.
- 6.US Department of Health and Human Services. Health Resources and Services Administration. Sixteenth Report: Physician Workforce Policy Guidelines for the United States, 2000–2020. Rockville, MD: US Department of Health and Human Services; 2005.
- 7.Pugno PA, Schmittling GT, McGaha AL, Kahn NB. Entry of US medical school graduates into Family Medicine Residencies: 2005–06 and 3-year summary. Fam Med. 2006;38(9):626–636. [PubMed] [Google Scholar]
- 8.Donaldson MS, Yordy KD, Lohr KN, Vanselow NA, eds. Primary Care: America’s Health in a New Era. Washington, DC: National Academy Press; 1996. [PubMed]
- 9.Grumbach K. The ramifications of specialty-dominated medicine. Health Aff (Millwood). 2002;21(1):155–157. [DOI] [PubMed] [Google Scholar]
- 10.Ferrer RL, Hambidge SJ, Maly RC. The essential role of generalists in health care systems. Ann Intern Med. 2005;142(8):691–699. [DOI] [PubMed] [Google Scholar]
- 11.Starfield B, Shi L, Macinko J. Contribution of primary care to health systems and health. Milbank Q. 2005;83(3):457–502. [DOI] [PMC free article] [PubMed] [Google Scholar]
- 12.Sox HC. Decision-making: a comparison of referral practice and primary care. J Fam Pract. 1996;42(2):155–160. [PubMed] [Google Scholar]
- 13.Fryer GE, Green LA, Dovey SM, Phillips RLJ. The United States relies on family physicians, unlike any other specialty. Am Fam Physician. 2000;63(9):1669. [PubMed] [Google Scholar]
- 14.Shi L, Starfield B, Politzer R, Regan J. Primary care, self-rated health, and reduction in social disparities in health. Health Serv Res. 2002;37(3):529–550. [DOI] [PMC free article] [PubMed] [Google Scholar]
- 15.Agency for Healthcare Research and Quality. 2006 National Healthcare Disparities Report. Rockville, MD: US Department of Health and Human Services, Agency for Healthcare Research and Quality; 2006. AHRQ Pub. No. 07–0012.
- 16.Braveman P, Gruskin S. Defining equity in health. J Epidemiol Community Health. 2003;57(4):254–258. [DOI] [PMC free article] [PubMed] [Google Scholar]
- 17.Whitehead M. The concepts and principles of equity and health. Int J Health Serv. 1992;22(3):545–566. [DOI] [PubMed] [Google Scholar]
- 18.Kitagawa EM, Hauser PM. Differential Mortality in the United States: A Study in Socioeconomic Epidemiology. Cambridge, MA: Harvard University Press; 1973.
- 19.Marmot MG, Shipley MJ, Rose G. Inequalities in death: specific explanations of a general pattern? Lancet. 1984(8384):1003–1006. [DOI] [PubMed]
- 20.Adler NE, Boyce T, Chesney MA, et al. Socioeconomic status and health: the challenge of the gradient. Am Psychol. 1994;49(1):15–24. [DOI] [PubMed] [Google Scholar]
- 21.Williams DR, Collins C. US socioeconomic and racial differences in health: patterns and explanations. Annu Rev Sociol. 1995;21:349–386. [Google Scholar]
- 22.National Center for Health Statistics. Health, United States, 2001 With Urban and Rural Health Chartbook. Hyattsville, MD; 2001.
- 23.Cohen JW, Monheit AC, Beauregard KM, et al. The Medical Expenditure Panel Survey: a national health information resource. Inquiry. 1996–1997;33(4):373–389. [PubMed] [Google Scholar]
- 24.Cherry DK, Woodwell DA, Rechtsteiner EA. National Ambulatory Medical Care Survey: 2005 Summary. Hyattsville, MD: National Center for Health Statistics; 2007. No. 387. [PubMed]
- 25.Althouse LA, Stockman JA III. Pediatric workforce: a look at general pediatrics data from the American Board of Pediatrics. J Pediatr. 2006;148(2):166–169. [DOI] [PubMed] [Google Scholar]
- 26.Forrest CB, Majeed A, Weiner JP, Carroll K, Bindman AB. Referral of children to specialists in the United States and United Kingdom. Arch Pediatr Adolesc Med. 2003;157(3):279–285. [DOI] [PubMed] [Google Scholar]
- 27.Hooker RS, Berlin LE. Trends in the supply of physician assistants and nurse practitioners in the United States. Health Aff (Millwood). 2002;21(5):174–181. [DOI] [PubMed] [Google Scholar]
- 28.Minino AM, Heron MP, Smith BL. Deaths: preliminary data for 2004. Natl Vital Stat Rep. 2006;54(19):1–49 [PubMed] [Google Scholar]
- 29.Braveman P. Health disparities and health equity: concepts and measurement. Annu Rev Public Health. 2006;27:167–194. [DOI] [PubMed] [Google Scholar]
- 30.Rust K. Variance estimation for complex estimators in sample surveys. J Off Stat. 1985;1:381–397. [Google Scholar]
- 31.Hart JT. The inverse care law. Lancet. 1971;1(7696):405–412. [DOI] [PubMed] [Google Scholar]
- 32.Council on Graduate Medical Education. Physician Distribution and Health Care Challenges in Rural and Inner-City Areas. Tenth Report. Rockville, MD: US Department of Health and Human Services, Public Health Service, Health Resources and Services Administration; 1998.
- 33.Colwill JM, Cultice JM. The future supply of family physicians: implications for rural America. Health Aff (Millwood). 2003;22(1):190–198. [DOI] [PubMed] [Google Scholar]
- 34.Shi L, Starfield B. Primary care physician supply, income inequality, and racial mortality in U.S. metropolitan areas. Am J Public Health. 2001;91(8):1246–1250. [DOI] [PMC free article] [PubMed] [Google Scholar]
- 35.Donabedian A. The Definition of Quality and Approaches to its Assessment. Ann Arbor, MI: Health Administration Press; 1980.
- 36.Rosenblatt RA, Andrilla CHA, Curtin T, Hart LG. Shortages of medical personnel at community health centers. JAMA. 2006;295(9): 1042–1049. [DOI] [PubMed] [Google Scholar]
- 37.McCormick A, Fleming D, Charlton J. Morbidity Statistics From General Practice. London: HMSO; 1995.
- 38.Schellevis FG, Westert GP, DeBakker DH. The actual role of general practice in the Dutch healthcare system: results of the Second Dutch National Survey of General Practice. Med Klin (Munich). 2005;100(10):656–661. [DOI] [PubMed] [Google Scholar]
- 39.Asada Y, Kephart G. Equity in health services use and intensity of use in Canada. BMC Health Serv Res. 2007;7:41. [DOI] [PMC free article] [PubMed] [Google Scholar]
- 40.Bach PB, Pham HH, Schrag D, Tate RC, Hargraves JL. Primary care physicians who treat blacks and whites. N Engl J Med. 2004;351(6):575–584. [DOI] [PubMed] [Google Scholar]
- 41.Smedley BD, Stith AY, Nelson AR, eds. Unequal Treatment: Confronting Racial and Ethnic Disparities in Health Care. Washington, DC: National Academies Press; 2002. [PubMed]
- 42.Hing E, Cherry DK, Woodwell DA. National Ambulatory Medical Care Survey: 2004.Adv Data. 2006;(374):1–33. [PubMed]
- 43.Fryer GEJ, Green LA, Dovey SM, Yawn BP, Phillips RL, Lanier D. Variation in the ecology of medical care. Ann Fam Med. 2003;1(2):81–89. [DOI] [PMC free article] [PubMed] [Google Scholar]
- 44.Smith GD, Neaton JD, Wentworth D, Stamler R, Stamler J. Socioeconomic differentials in mortality risk among men screened for the Multiple Risk Factor Intervention Trial: I. White Men. Am J Public Health. 1996;86(4):486–496. [DOI] [PMC free article] [PubMed] [Google Scholar]
- 45.Marmot M, Wilkinson RG, eds. Social Determinants of Health. 2nd ed. Oxford: Oxford University Press; 2005.
- 46.Fiscella K, Franks P, Doescher MP, Saver BG. Disparities in health care by race, ethnicity, and language among the insured. Med Care. 2002;40(1):52–59. [DOI] [PubMed] [Google Scholar]
- 47.Forrest CB. Cross-national comparison of primary care practice in Australia, New Zealand, and the United States. Academy Health. http://64.233.167.104/search?q=cache:1huq5s1AKLwJ:www.academyhealth.org/2005/ppt/forrest.ppt+forrest+christopher+primary+care+namcs&hl=en&gl=us&ct=clnk&cd=5&client=safari. Accessed January 10, 2006.
- 48.Kuhlthau K, Nyman RM, Ferris TG, Beal AC, Perrin JP. Correlates of use of specialty care. Pediatrics. 2004;113(3 Pt 1):e249–e255. [DOI] [PubMed] [Google Scholar]


