


Abstract
We developed a simple algorithm, i-Score (inhibitory-Score), to predict active siRNAs by applying a linear regression model to 2431 siRNAs. Our algorithm is exclusively comprised of nucleotide (nt) preferences at each position, and no other parameters are taken into account. Using a validation dataset comprised of 419 siRNAs, we found that the prediction accuracy of i-Score is as good as those of s-Biopredsi, ThermoComposition21 and DSIR, which employ a neural network model or more parameters in a linear regression model. Reynolds and Katoh also predict active siRNAs efficiently, but the numbers of siRNAs predicted to be active are less than one-eighth of that of i-Score. We additionally found that exclusion of thermostable siRNAs, whose whole stacking energy (ΔG) is less than −34.6 kcal/mol, improves the prediction accuracy in i-Score, s-Biopredsi, ThermoComposition21 and DSIR. We also developed a universal target vector, pSELL, with which we can assay an siRNA activity of any sequence in either the sense or antisense direction. We assayed 86 siRNAs in HEK293 cells using pSELL, and validated applicability of i-Score and the whole ΔG value in designing siRNAs.
INTRODUCTION
When we study the molecule of our interest, we up- and down-regulate its expression either in cells or in bodies, and analyze their effects by morphological, physiological and biochemical modalities. Recently, RNA interference (RNAi) has emerged as a simple and robust method to specifically silence a gene expression (1–3). In mammals, 21- to 27-nucleotide (nt) double-stranded RNA or small interfering RNA (siRNA), which is specific to a gene of our interest, is introduced into cells to induce RNAi (4,5).
To achieve efficient and specific gene silencing by siRNA in mammals, an accurate siRNA-designing algorithm is crucial. Numerous algorithms have been reported to date. The algorithm can be arbitrarily divided into two categories: the first-generation algorithms that are based on a small number of observations and the second-generation algorithms that arise from a large number of observations. The first-generation algorithms exploit a variety of siRNA features such as the thermodynamic stability (6,7), base preferences at specific positions (8–12), mRNA secondary structures (13–16) and uniqueness of the target site (17,18). These siRNA features are also summarized in review articles (19–21). The first-generation algorithms disclosed the fundamental requirements for designing active siRNAs.
The prediction accuracies of the first-generation algorithms, however, were not high enough to our satisfaction (22). To improve the prediction accuracy, Huesken and colleagues (23) developed a new algorithm, Biopredsi, by applying an artificial neural network model to 2431 siRNAs. Biopredsi achieved a high correlation coefficient of 0.66 between the observed and predicted siRNA activities. The artificial neural network modeling, on which Biopredsi depends, however, is ‘black box’ in itself, and there is no sense in making further inspections of each parameter.
In the past two years, the second-generation algorithms emerged by analyzing the Huesken's dataset (24–29). Most algorithms, however, employ complicated mathematical models and depend on calculations that cannot be readily traced, which also prevent us from evaluating these algorithms. Matveeva and colleagues (29) recently compared nine siRNA-designing tools, and concluded that Biopredsi, as well as ThermoComposition by Shabalina et al. (24) and DSIR by Vert et al. (27), are the best predictors of active siRNAs. The ThermoComposition and DSIR algorithms employ a linear regression model, which directly indicates nucleotide preferences at each position.
We developed here a simple siRNA prediction algorithm, i-Score (inhibitory-Score), based on a linear regression model. The i-Score algorithm can predict active siRNAs to the similar extents as Biopredsi, ThermoComposition and DSIR, and is better than the six first-generation algorithms. The i-Score algorithm is exclusively composed of the nucleotide preference scores, and is more straightforward than any of the second-generation algorithms. We also found that the whole ΔG value, which represents the stability of the siRNA duplex, ensures accurate prediction of siRNA activities in the four second-generation algorithms, and improves a correlation coefficient to more than 0.7. Additionally, we developed a new validation vector, pSELL, to assay an siRNA activity of any sequence in either the sense or antisense direction simply by synthesizing a pair of oligonucleotides. The synthesized oligonucleotides are inserted into both the pSELL validation vector and the pDual effector vector (30). We validated the efficacy of i-Score, as well as the thermostability threshold, by analyzing 86 siRNAs in HEK293 cells.
MATERIALS AND METHODS
Datasets
Dataset A is comprised of 2431 siRNAs reported by Huesken and colleagues (23). The quality of this dataset is ensured by the Gaussian distribution of their potencies. Dataset A is randomly divided into 1600 and 831 siRNAs (Supplementary Table 3). We made five pairs of subsets from dataset A. After confirming that all five pairs gave rise to similar results, we chose a pair of subsets A1600 and A831 without any bias. Dataset B is comprised of 419 siRNAs reported in five other articles (6,8,9,31,32). Each report shows a small number of siRNAs, and the quality of their datasets is variable from report to report.
Training and validation of prediction algorithms
For both modeling and validation analyses, we employed the ‘standard least square fitting’ functionality of the JMP-IN statistical software Ver. 5.1.1 (SAS Institute, Cary, NC) with its default settings. i-Score and i-Score1600 are trained using dataset A and subset A1600, respectively. As the actual parameters of Biopredsi are not published anywhere, we developed a similar scoring system, s-Biopredsi for simulated Biopredsi, by applying a single-node neural network model on 2182 siRNAs in subset A (Supplementary Table 3), which is identical to those employed to develop Biopredsi (23). We again employed the ‘neural network modeling’ functionality of the JMP-IN software. We found a high correlation coefficient (R = 1.0000) between Biopredsi and s-Biopredsi with the remaining 249 siRNAs in dataset A. We also obtained a total of 400 Biopredsi scores from two independent genes with the Biopredsi web server (http://www.biopredsi.org/), and compared them to our s-Biopredsi scores. Correlation coefficients between Biopredsi and s-Biopredsi were 0.9999 and 0.9995 for these two genes. Hence s-Biopredsi is similar to Biopredsi. s-Biopredsi1600 also employs a single-node neural network modeling, but is trained using subset A1600, so that subset A831 can be used for the validation analysis.
For the receiver operating characteristic (ROC) analysis, we employed the ‘logistic regression’ functionality of the JMP-IN software, as well as the ‘ROC curve’ functionality of the SPSS 15.0.1 software (SAS Institute, Cary, NC).
We developed i-Score designer (Supplementary Data) with Excel VBA on Windows. We implemented 11 algorithms including i-Score by simulating published algorithms and parameters, and confirmed that the i-Score designer gives the same scores as those reported by each article. s-Biopredsi is similar to, but different from, Biopredsi as indicated above. For ThermoComposition19 and ThermoComposition21, the i-Score designer calls executable files that have been developed by Matveeva and colleagues (29).
Construction of pSELL and pDual vectors
To validate the prediction accuracy of i-Score, we developed a universal target vector, pSELL, which can accommodate any target sequences (Figure 5A). We first excised EGFP from pIRES2-EGFP (Clontech, Mountain View, CA, USA) and placed it upstream of IRES. We then inserted the firefly luciferase gene downstream of IRES, and made pCMV-EGFP-IRES-Luc. We additionally inserted a part of the LacZ gene between the target-cloning site and IRES so that IRES-binding proteins do not mask the upstream target sequence. We next substituted the SV40 promoter for the CMV promoter, and made pSV40-EGFP-LacZ-IRES-Luc (pSELL). We mutated an extra HindIII restriction site within IRES, and exploited the BglII, HindIII and BamHI restriction sites between EGFP and IRES to accommodate a target sequence in either the sense or antisense direction.
Figure 5.

In vitro validation of i-Score using pSELL and pDual vectors. (A) The pSELL target vector carries the SV40 promoter, the EGFP gene, the target-cloning site, IRES and the firefly luciferase gene. Synthesized oligonucleotides should carry HindIII- and BamHI/BglII-competent restriction sites at both ends. pSELL can accommodate the synthesized oligonucleotides in either direction. The pDual effector vector harbors the U1 and H1 promoters in opposite directions, and the cloning site between them (30). pDual accommodates the same oligonucleotides as pSELL in the sense direction. siRNA synthesized by pDual works on the target mRNA synthesized by pSELL. We can thus quantify the siRNA activity by measuring the activity of either EGFP or the firefly luciferase. Scattered plots of 86 observed and predicted siRNA activities above (B) and below (C) the whole ΔG value of −34.6 kcal/mol. The correlation coefficient of thermodynamically unstable siRNAs (B) is better than that of thermostable siRNAs (C).
We also constructed an siRNA-generating vector, pDual, according to Zheng and colleagues (30). Briefly, we inserted the mouse U6 promoter and the human H1 promoter in opposite directions in pBluescript SK(-) (Stratagene, La Jolla, CA, USA). We also introduced a BglII site so that the siRNA sequence can be inserted between the HindIII and BglII sites flanked by the U6 and H1 promoters.
Cell culture and transfection
Human embryonic kidney (HEK) 293 cells were maintained in Dulbecco's modified Eagle's medium (DMEM) supplemented with 10% fetal bovine serum. In all assays, 1.5 × 10⁵ HEK293 cells were plated on 24-well dishes 12 h before transfection. Cells were subsequently transfected with 0.3 µg of the pDual effector vector, 0.03 µg of the pSELL target vector and 0.03 µg of phRL-TK encoding the Renilla luciferase (Promega, Madison, WI, USA) using the FuGENE6 Transfection Reagent (Roche Applied Science, Basel, Switzerland). After incubation for 3 days, firefly and Renilla luciferase activities were measured using the Dual-Luciferase Reporter Assay System (Promega). Silencing activity (% inhibition) of each siRNA is calculated by dividing the relative luciferase activity in the presence of the pDual target vector by the relative luciferase activity in the presence of a control pDual vector lacking an insert.
RESULTS
Development of a simple algorithm, i-Score, for prediction of siRNA activities
In order to develop a simple algorithm to predict active siRNAs, we collated two datasets (Supplementary Table 3). We applied a linear regression model to dataset A comprised of 2431 siRNAs to construct a prediction algorithm, i-Score for inhibitory score, and validated it with dataset B comprised of 419 siRNAs. Although dataset A is comprised of 21-nt siRNA sequences, we eliminated 2-nt overhangs at the 3′ end of the antisense strand and employed 19 nt that make an siRNA duplex, in order to validate our algorithm with dataset B, which is comprised of 19-nt sequences. Our preliminary analysis using subsets A1600 and A831 demonstrated that 19-nt analysis is as good as 21-nt analysis in our linear regression model (data not shown).
Our linear regression model determines nucleotide preferences at each position of siRNA, which is then used as scoring parameters to calculate i-Score (Figure 1A). We normalized the scoring parameters to give the best and worst i-Scores of 100 and 0, respectively (Figure 1B and Supplementary Table 1). The scoring parameters directly demonstrate which nucleotides are preferred at which positions. Previous reports address the importance of G/C at positions 18 and 19 on the antisense strand, as well as a stretch of A/T at the 5′ end on the antisense strand (6,7). Our results also conform to this notion. In addition, highly positive and negative scoring parameters in our analysis are located at previously reported preferred and unfavorable nucleotides, respectively (6,23,24,27).
Figure 1.

Definition of i-Score (A) and scoring parameters at each position (B). Parameters are normalized to give the best and the worst i-Scores of 100 and 0, respectively. The average score at each position is 2.60 (dotted line). Scores above 2.60 indicate preferred nucleotides. ‘P’ is a probability score of nucleotide ‘n’ at position ‘m’ on the antisense strand (Supplementary Table 1).
Comparison of i-Score with three other second-generation algorithms of s-Biopredsi, Thermocomposition21 and DSIR
To test how efficiently i-Score predicts siRNA activities, we plotted 419 siRNA activities in dataset B against i-Scores (Figure 2A). We similarly plotted the observed and predicted siRNA activities with s-Biopredsi, Thermocomposition21 and DSIR (Figure 2B–D). None of these algorithms employs dataset B in the process of training parameters. The correlation coefficients indicate that i-Score is as good as the three other second-generation algorithms (Table 1). For all the algorithms, the correlation coefficients with dataset A are superior to those with dataset B, implying possible overfitting with the training dataset A.
Figure 2.

Observed siRNA activities in dataset B are plotted against predicted siRNA activities by i-Score (A), s-Biopredsi (B), ThermoComposition21 (C) and DSIR (D). ‘R’ values represent the Pearson correlation coefficients, which are also indicated in Table 1. (E) ROC curves of the four algorithms. Areas under the curves (AUC) of i-Score, s-Biopredsi, ThermoComposition21 and DSIR are 0.776 (95% confidence interval, 0.732–0.820), 0.770 (0.726–0.814), 0.795 (0.753–0.837) and 0.781 (0.738–0.825), respectively. There are no statistical differences of AUCs among the four algorithms.
Table 1.
Pearson correlation coefficients between observed and predicted siRNA activities by four second-generation algorithms
| Dataset A | Dataset B | |
|---|---|---|
| i-Score | 0.635 | 0.557 |
| s-Biopredsi | 0.665 | 0.546 |
| ThermoComposition21 | 0.635 | 0.577 |
| DSIR | 0.687 | 0.554 |
Dataset A is used to train all the algorithms, whereas dataset B is not used as a training dataset in any algorithms.
The ROC curve is a plot of sensitivity versus 1-specificity, and is widely applied to compare efficiencies of different algorithms in a variety of biomedical fields. The ROC analysis with dataset B also demonstrates that the prediction accuracies of the four algorithms are not statistically different (Figure 2E).
We also examined the correlation coefficients among i-Score, s-Biopredsi, ThermoComposition21 and DSIR, and found that i-Score, s-Biopredsi and DSIR are close to each other, whereas ThermoComposition21 is unique compared to the other three algorithms (Supplementary Table 2).
Table 2.
Comparison of eight algorithms using subset A831
| Threshold | % of effective siRNAsa | No (%) of siRNAs matching the threshold | Pearson correlation coefficient |
|---|---|---|---|
| i-Score1600b,c | 0.592 | ||
| ≥65.9 | 90 | 72 (8.8%) | |
| ≥63.0 | 80 | 117 (14.1%) | |
| ≥59.4 | 75 | 166 (20.0%) | |
| s-Biopredsi1600b,c | 0.618 | ||
| ≥0.807 | 90 | 73 (8.8%) | |
| ≥0.767 | 80 | 141 (17.0%) | |
| ≥0.734 | 75 | 197 (23.7%) | |
| Reynoldsd | N.D. | ||
| ≥9 | 88.9 | 9 (1.1%) | |
| ≥8 | 80.4 | 46 (5.5%) | |
| ≥7 | 71.0 | 107 (12.9%) | |
| Ui-Teid | N.D. | ||
| Ia | 73.4 | 64 (7.7%) | |
| Ia + Ib | 68.0 | 125 (15.0%) | |
| Amarzguiouid | N.D. | ||
| ≥5 | 81.0 | 21 (2.5%) | |
| ≥4 | 61.3 | 80 (9.6%) | |
| ≥3 | 64.8 | 179 (21.5%) | |
| Katohc | 0.427 | ||
| ≥ 101.1 | 90 | 6 (0.7%) | |
| ≥ 87.5 | 80 | 31 (3.7%) | |
| ≥79.5 | 75 | 80 (11.1%) | |
| Hsieh | N.D. | ||
| =4 | 50.0 | 2 (0.2%) | |
| ≥3 | 51.2 | 41 (4.9%) | |
| ≥2 | 52.7 | 184 (22.1%) | |
| Takasaki | 0.174 | ||
| n.a.e | 90 | n.a.e | |
| n.a.e | 80 | n.a.e | |
| ≥17.1 | 75 | 4 (0.5%) |
Note that i-Score1600, s-Boipredsi1600, Reynolds and Katoh predict active siRNAs with ∼90% accuracy, but the chances of predicting such active siRNAs in a given mRNA with Reynolds and Katoh are ∼1/8 and ∼1/12, respectively, of those with i-Score1600 and s-BoiPredSi1600. ThermoComposition21 and DSIR are not included in this analysis, because we cannot avoid overfitting for these two algorithms for subset A831.
aRatios of experimentally proved active siRNAs among siRNAs predicted to be active according to variable thresholds of eight different algorithms. The experimentally proved active siRNAs are arbitrarily defined to those suppressing the gene expression levels to less than 25% of a control.
bThe i-Score1600 and s-Biopredisi1600 scores are different from i-Score and s-Biopredsi. In order to avoid overfitting for these two algorithms, the modeling algorithms of i-Score and s-Biopredsi are applied to subset A1600 to calculate scoring parameters for i-Score1600 and s-Biopredisi1600, respectively. The Pearson correlation coefficients between i-Score and i-Score1600, and s-Biopredsi and s-Biopredsi1600 are 0.990 and 0.985, respectively.
cAs i-Score1600, s-Biopredsi1600, Katoh and Takasaki are continuous numeric scores, thresholds are arbitrarily set so that 90, 80 and 75% siRNAs above the threshold are experimentally proved active. For example, for i-Score1600, all the 831 siRNAs in subset A831 are sorted in descending order of i-Score1600. The ratio of experimentally proved active siRNAs decreases with decreasing i-Score1600. When the lower limit of i-Score1600 is set to 65.9, 72 siRNAs are included in this category and 65 suppress the gene expression levels to less than 25% of a control. This is how we set an i-Score1600 threshold for 90% (65/72). The 72 siRNAs comprise 8.8% of the 831 siRNAs in subset A831. This indicates that when we synthesize an siRNA with i-Score1600 of 65.9 or higher, we can expect that the chance of obtaining an active siRNA is 90%.
dFor algorithms yielding ordinal or nominal numbers, the indicated ranks are used as the thresholds. For example, for Reynolds, the number of siRNAs equal to or higher than the score of 9 is 9, which comprises 1.1% of the 831 siRNAs, and 8 (88.9%) of the 9 siRNAs suppress gene expression levels to less than 25% of a control.
eNo subgroup of siRNAs matches the criteria of ≥90% or ≥80% prediction accuracy.
Comparison of the first- and second-generation algorithms
We next compared i-Score with s-Biopredsi, as well as with six other first-generation algorithms of Reynolds, Ui-Tei, Amarzguioui, Katoh, Hsieh and Takasaki, using subset A831 (Supplementary Figure 1 and Table 2). Both i-Score and s-Biopredsi are classified into the second-generation algorithms, because these are based on dataset A. As subset A831 is included in the training dataset A for i-Score and s-Biopredsi, we employed i-Score1600 and s-Biopredsi1600, which we trained with subset A1600, in order to strictly avoid overfitting.
When we sort siRNAs in descending order of predicted scores and choose siRNAs above a given threshold, the ratio of active siRNAs among the selected siRNAs is inversely correlated with the number of selected siRNAs for all the algorithms (Table 2). Namely, if an algorithm chooses more siRNAs, the chance of obtaining active siRNAs becomes less. siRNAs with i-Score1600 ≥ 65.9 constitute 8.8% of subset A831, and 90% of the siRNAs in this category are active. Similarly, siRNAs with s-Biopredsi1600 ≥ 0.807 comprise 8.8% of subset A831, and 90% are active. In the current analysis, Reynolds and Katoh reach a ∼90% success rate, whereas Ui-Tei, Amarzguioui, Hsieh and Takasaki do not (Table 2). siRNAs with Reynolds ≥ 9 constitute 1.1% of subset A831, and 88.9% are active. Similarly, siRNAs with Katoh > 101.1 comprise 0.7% of subset A831, and 90% are active. Therefore, when we design siRNAs expecting a ∼90% success rate, i-Score1600 and s-Biopredsi1600 would be able to predict at least eight times more numbers of siRNAs compared to Reynolds and Katoh. This likely represents the most beneficial advantage of the second-generation algorithms over the first-generation ones.
Whole ΔG value, as an indicator of thermostability of siRNA duplex, is a key determinant of accurate prediction
We next sought for another parameter that potentially improves the correlation coefficient between the observed and predicted siRNAs with i-Score. In the scattered plot of the observed and predicted siRNA activities, we observe a subgroup of effective siRNAs in which i-Scores are falsely low (area L in Figure 3A and B). As siRNAs in area L make the correlation coefficient low, we searched for a shared feature among siRNAs in area L. For this purpose, we calculated 12 parameters for each siRNA: stacking energy (ΔG) of the secondary structure of siRNA (38), maximum GC stretch within siRNA,%GC contents spanning the antisense positions 1–19, 3–7 and 1–17, and stacking energies (ΔG) spanning the antisense positions 1–19, 3–17, 11–19, 1–9, 11–17, 3–9, 1–5 and 1–17. We divided the 419 siRNAs in dataset B into two subsets by gradually changing the threshold for each parameter, and analyzed the correlation coefficients between the two subsets.
Figure 3.

Contours of the whole ΔG values overlaid on the scatted plots of observed and predicted siRNA activities with (A) or without (B) dots indicating individual siRNAs for dataset B. Area H indicates siRNAs for which i-Score successfully predicts siRNA activities, whereas area L indicates siRNAs for which i-Score falsely predicts inactive siRNAs. Thermodynamically unstable siRNAs with high whole ΔG values tend to align on a linear regression line (data not shown) going from the bottom left up to the top right, and form a cluster of well-predicted siRNAs (area H) at the top right corner. On the other hand, thermostable siRNAs stay away from the regression line, and form a cluster of poorly predicted siRNAs (area L) at the top left corner. The plots are drawn by the ‘contour plot’ functionality of the JMP-IN software. (C) Correlation coefficients between the observed and predicted siRNA activities in subgroups of siRNAs whose whole ΔG values are equal to or more than the indicated values. For example, there are 101 siRNAs whose whole ΔG values are equal to or more than −34.6 kcal/mol. The correlation coefficient of the 101 siRNAs with i-Score is 0.723, and hence 0.723 is plotted on –34.6 (arrow). This is also illustrated in Figure 4. The correlation coefficient tends to go down when the whole ΔG threshold further goes higher, likely because we can include a limited number of siRNAs in the analysis.
This analysis revealed that siRNAs with a stable stacking energy at positions 1–19 (the whole ΔG value) tend to give rise to a low correlation coefficient. A contour plot of the whole ΔG values also illustrates that siRNAs in area L have stable stacking energies of ≤−37 kcal/mol (Figure 3A and B). The contour plot further demonstrates that thermodynamically unstable siRNAs with the whole ΔG values >−31 kcal/mol tend to stay close to the linear regression line, which also points to the notion that exclusion of thermostable siRNAs makes the correlation coefficient high. Indeed, the correlation coefficient goes higher, when we gradually exclude thermostable siRNAs by elevating the threshold of the whole ΔG values from −52.0 up to −34.6 kcal/mol for i-Score, s-Biopredsi, ThermoComposition21 and DSIR (Figure 3C). The correlation coefficient, however, goes down when the whole ΔG threshold goes further up, likely because only a limited number of siRNAs can be included in the analysis. Although the whole ΔG values are well correlated with%GC contents (R = 0.98), the whole ΔG value is a better discriminator than the%GC content (data not shown).
We found that siRNAs with the whole ΔG value of −34.6 kcal/mol and higher result in a correlation coefficient of 0.723 (Figure 4A), whereas the remaining thermostable siRNAs give rise to a correlation coefficient of 0.514 for dataset B (Figure 4B). ROC analysis also demonstrates that a data subset comprised of unstable siRNAs (≥−34.6 kcal/mol) gives rise to a markedly higher AUC than that of stable siRNAs (Figure 4C). These analyses all point to the notion that exclusion of thermostable siRNAs improves the correlation between the observed and predicated siRNA activities in all the algorithms.
Figure 4.
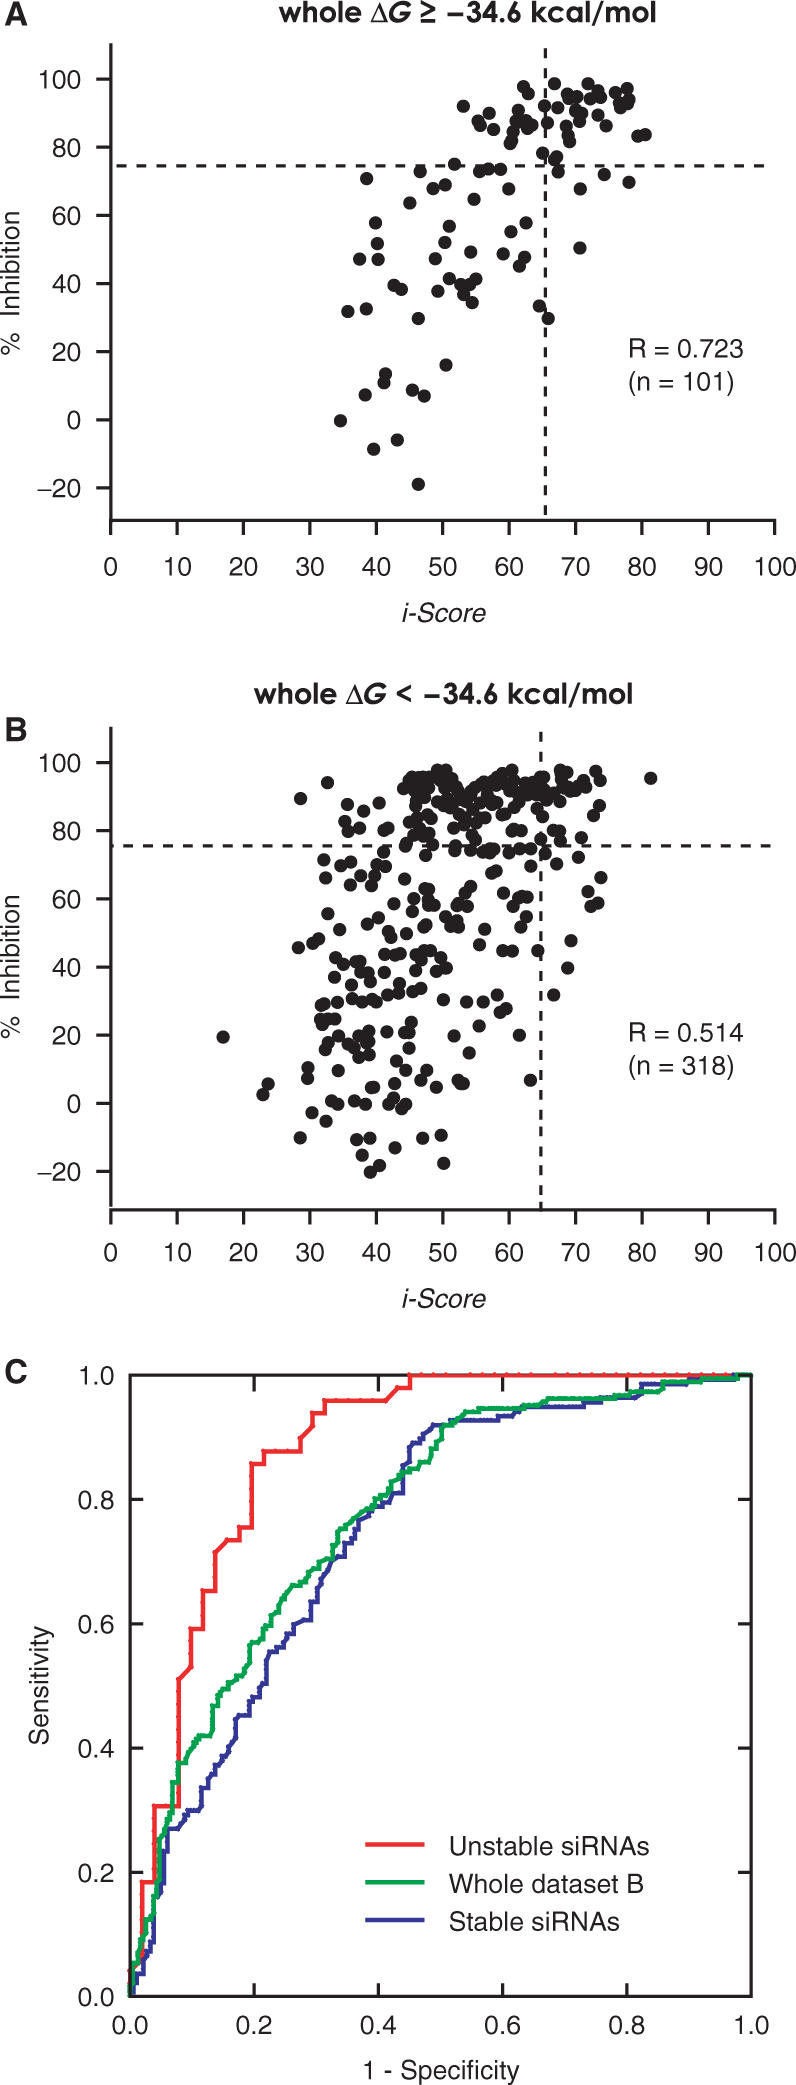
Scattered plots of observed and predicted siRNAs categorized by the whole ΔG values for datasets B. The threshold of whole ΔG values is indicated on top of each panel. i-Score predicts activities of thermodynamically unstable siRNAs (A) more accurately than those of thermostable siRNAs (B). (C) ROC curves of thermodynamically unstable (≥−34.6 kcal/mol) and stable (<−34.6 kcal/mol) siRNAs in dataset B using i-Score. AUCs of unstable and stable siRNAs are 0.882 (95% confidence interval, 0.814–0.950) and 0.750 (0.697–0.803), respectively. AUC of the whole dataset B is 0.776 (0.732–0.820).
Genome-wide prediction of active siRNAs with i-Score
As shown in Table 2, 90% of siRNAs are active, if we choose siRNAs with i-Score1600 ≥65.9 for subset A831. Additionally, as shown in Figure 4, the whole ΔG value of −34.0 kcal/mol differentiates between successfully and falsely predicted siRNAs. We can thus expect that more than 90% of siRNAs are active, if we set the thresholds of i-Score > 66 and the whole ΔG value >−34.0 kcal/mol.
In order to test if i-Score can indeed predict active siRNAs in human genes even after we impose a threshold for the whole ΔG value, we applied variable thresholds of i-Score and the whole ΔG value to all the transcripts in the NCBI RefSeq Database Build 35.1 (Table 3). When we choose siRNAs with i-Score > 65 and the whole ΔG value >−34.0 kcal/mol, we expect to predict 65 active siRNAs per mRNA. Under these conditions, 89.2% of human transcripts are expected to have one or more active siRNAs. These results suggest that i-Score potentially predicts active siRNAs in most human genes.
Table 3.
Genome-wide prediction of active siRNAs by i-Score
| i-Score | Whole ΔG | siRNAs/kba | siRNAs/mRNAb | Best i-Scorec | 10th i-Scored |
|---|---|---|---|---|---|
| >65 | –e | 82.9 | 132 (99.8%) | 82.6 ± 4.3 | 75.6 ± 4.7 |
| >65 | >−34 | 50.5 | 65 (95.9%) | 82.2 ± 5.3 | 74.2 ± 7.2 |
| >65 | >−30 | 26.7 | 33 (89.2%) | 81.8 ± 5.9 | 72.8 ± 7.8 |
| >70 | –e | 34.0 | 53 (98.8%) | –f | –f |
| >70 | >−34 | 24.2 | 33 (94.0%) | –f | –f |
| >70 | >−30 | 14.1 | 19 (86.9%) | –f | –f |
Average number of active siRNAs per kb of the human RefSeq mRNAs. The NCBI RefSeq Database Build 35.1 includes 40 768 mRNAs, and we analyzed each alternatively spliced transcript as an independent mRNA. The total number of nucleotides that we analyzed is 100 738 984, and the mean and SD of the mRNA length is 2471 ± 2039 bases.
Median number of active siRNAs per mRNA in the human RefSeq database. As the numbers of active siRNAs do not follow a Gaussian distribution, median numbers are represented. The number in parenthesis indicates a percentage of mRNAs among the 40 768 transcripts, harboring at least one siRNA meeting the indicated criteria.
Mean and SD of the highest i-Score for each mRNA. mRNAs with no siRNAs above the indicated whole ΔG threshold are excluded from the analysis.
Mean and SD of the 10th highest i-Score for each mRNA. mRNAs with less than 10 siRNAs above the indicated whole ΔG threshold are excluded from the analysis.
No threshold is placed for the whole ΔG.
Because means of the best and the 10th highest i-Scores are independent of the i-Score threshold, values are indicated only on rows of i-Score >65.
i-Score designer
We developed an Excel VBA program, the i-Score designer (Supplementary Data), which calculates 11 different siRNA-designing scores including i-Score for all possible siRNA sequences within a gene of our interest or for individually entered siRNA sequences. The program also calculates the whole ΔG value and five other parameters.
A new validation method for siRNA activity
To validate the prediction accuracy of i-Score, we developed a universal target vector, pSELL, which accommodates any target sequence in either the sense or antisense direction (Figure 5A). We also constructed the pDual effector vector (30). With pSELL and pDual, a single pair of synthesized oligonucleotides can be inserted into both the target and effector vectors. We constructed 86 pairs of pSELL and pDual vectors (Supplementary Table 4), and assayed their effects in HEK293 cells by measuring the luciferase activities. As expected, i-Score predicted siRNA activities more accurately for those with thermodynamically unstable siRNAs (Figure 5B) than those with thermostable siRNAs (Figure 5C).
DISCUSSION
A simple algorithm, i-Score, to predict active siRNAs
We developed a simple siRNA-designing algorithm, i-Score, by applying a linear regression model to 2431 siRNAs. The correlation coefficient that we achieved with dataset B was as high as those of s-Biopredsi (23), ThermoComposition21 (24,29) and DSIR (27). Comparison of i-Score with s-Biopredsi, as well as with Reynolds (8), Ui-Tei (9), Amarzguioui (11), Katoh (33), Hsieh (12) and Takasaki (10), using subset A831 demonstrated that i-Score, s-Biopredsi, Reynolds and Katoh can readily predict active siRNAs with ∼90% accuracy. Additionally, both i-Score and s-Biopredsi predict at least eight times more numbers of active siRNAs than Reynolds and Katoh. We analyzed the prediction efficiencies under conditions where no overfitting is allowed.
The advantage of i-Score over the others is that i-Score only takes into account the nucleotide preferences at each position and employs no other parameters, which makes the calculation of i-Score simple and easy to trace. In addition, we can visually inspect which nucleotides are better than the others at a specific position. Teramoto and colleagues (34) report that short motifs of 1–3 nt without positional information provide enough parameters for designing siRNAs. Vert and colleagues (27) also report that inclusion of short motifs in addition to the position-specific nucleotide preferences improves the prediction accuracy, and made the DSIR scores using a subset of our dataset A. DSIR is indeed superior to i-Score for dataset A according to our analysis (Table 1). With dataset B, however, prediction accuracy of DSIR is not as good as that of i-Score (Table 1). This may represent overfittings of DSIR with dataset A. Otherwise, either i-Score or DSIR is applicable to specific datasets but not to the others, but the underlying causes remain elusive.
Exclusion of thermostable siRNAs improves the prediction accuracy
Ladunga (28) reports that the whole ΔG values are correlated with siRNA activities. We also observe a correlation coefficient of R = 0.279 between the whole ΔG values and the siRNA activities for dataset A. Inclusion of the whole ΔG value as an independent parameter in our linear regression model, however, fails to improve correlation coefficients for our validation datasets (data not shown). This is likely because the whole ΔG value is already represented in i-Score, and indeed the correlation coefficient between these two parameters is 0.445.
We found that exclusion of thermostable siRNAs is beneficial in i-Score, s-Biopredsi, ThermoComposition21 and DSIR (Figure 3C). We also found that even after we impose a threshold of the whole ΔG values, we can predict enough numbers of active siRNAs for all the human transcripts with i-Score (Table 3). Our analysis demonstrates that the whole ΔG value rather serve as a determinant for successful prediction of siRNA activities.
In addition, our analysis demonstrates that some thermostable siRNAs are indeed active (area L in Figure 3A and B), and that no current algorithm can accurately predict their activities. This likely represents the presence of another cluster of siRNAs that potentially requires unidentified parameters to precisely predict their activities. Indeed, Krueger and colleagues (35) recently reported that, in addition to the siRNA sequence and its concentration, unidentified characteristics specific to the target gene are likely to have a significant influence on the siRNA activities.
i-Score designer
i-Score predicts on average 65 active siRNAs per mRNA in the genome-wide analysis (Table 3). Other algorithms would also predict similar numbers of active siRNAs. Among these siRNAs, we usually choose a single algorithm and synthesize one or two siRNAs with the best scores. As no algorithm has achieved ∼100% prediction accuracy, we usually wonder if the selected siRNAs are indeed active or not. If all the siRNAs, whose scores of an algorithm of our choice are above a predefined threshold, can be analyzed by the other algorithms, the chance of obtaining active siRNAs would become high. Most of the currently available siRNA-designing programs, however, do not provide scores of all available siRNAs within a given gene. To overcome this problem, we implemented 11 different scores and six parameters in i-Score designer (Supplementary Data). The i-Score designer readily demonstrates how siRNAs selected by an algorithm of our choice are evaluated by the other algorithms. As far as we know, no siRNA-designing program offers such functionality.
pSELL and pDual as a new validation tool of siRNA activity
To validate the prediction accuracy of siRNA-designing algorithms including i-Score, we developed a universal target vector, pSELL, in which the target sequence can be inserted in the sense or antisense direction. A combination of the pSELL target vector and the pDual effector vector (30) is cost-effective, because a single pair of oligonucleotides spanning an siRNA sequence of our interest can be inserted into both vectors. Hung and colleagues (36) report a similar cost-effective strategy employing pDual. Their target vector carries a reporter gene of either EGFP or luciferase followed by a target sequence in its 3′ untranslated region. On the other hand, pSELL carries EGFP, the target sequence IRES and the luciferase gene (Figure 5A). First, with pSELL, we can substitute our gene of interest for EGFP, and can quantify the siRNA activity against the full-length mRNA by measuring the expression level of the target mRNA as well as the luciferase activity. Second, pSELL enables us to measure both EGFP and luciferase activities in a single experiment. Third, a unique feature of pSELL is that it accommodates the target sequence in either the sense or antisense direction, which facilitates analysis of an effect of an siRNA on the antisense strand. As a large proportion of mammalian genes harbor antisense transcripts, which regulate the expression levels of the sense transcripts (37), the ability to assay an effect of an siRNA on the antisense strand will become more and more essential when we knock down a gene of our interest.
SUPPLEMENTARY DATA
Supplementary Data are available at NAR Online.
ACKNOWLEDGEMENTS
We appreciate Katsumasa Yamanaka, Akira Ando and Keiko Itano for technical assistance. This work was supported by Grants-in-Aid for COE Research, Scientific Research (A, B and C), Scientific Research on Priority Areas, Exploratory Research from the Ministry of Education, Culture, Sports, Science and Technology of Japan, as well as from the Ministry of Health, Labor and Welfare of Japan, and was also supported in part by grants from the Naito Foundation and the Takeda Science Foundation. Funding to pay the Open Access publication charges for this article was provided by Grants-in-Aid for the Scientific Research on Priority Areas ‘System Genomics’ from the Ministry of Education, Culture, Sports, Science and Technology of Japan.
Conflict of interest statement. None declared.
REFERENCES
- 1.McManus MT, Sharp PA. Gene silencing in mammals by small interfering RNAs. Nat. Rev. Genet. 2002;3:737–747. doi: 10.1038/nrg908. [DOI] [PubMed] [Google Scholar]
- 2.Hannon GJ. RNA interference. Nature. 2002;418:244–251. doi: 10.1038/418244a. [DOI] [PubMed] [Google Scholar]
- 3.Dorsett Y, Tuschl T. siRNAs: applications in functional genomics and potential as therapeutics. Nat. Rev. Drug Discov. 2004;3:318–329. doi: 10.1038/nrd1345. [DOI] [PubMed] [Google Scholar]
- 4.Dykxhoorn DM, Novina CD, Sharp PA. Killing the messenger: short RNAs that silence gene expression. Nat. Rev. Mol. Cell Biol. 2003;4:457–467. doi: 10.1038/nrm1129. [DOI] [PubMed] [Google Scholar]
- 5.Kim DH, Rossi JJ. Strategies for silencing human disease using RNA interference. Nat. Rev. Genet. 2007;8:173–184. doi: 10.1038/nrg2006. [DOI] [PubMed] [Google Scholar]
- 6.Khvorova A, Reynolds A, Jayasena SD. Functional siRNAs and miRNAs exhibit strand bias. Cell. 2003;115:209–216. doi: 10.1016/s0092-8674(03)00801-8. [DOI] [PubMed] [Google Scholar]
- 7.Schwarz DS, Hutvagner G, Du T, Xu Z, Aronin N, Zamore PD. Asymmetry in the assembly of the RNAi enzyme complex. Cell. 2003;115:199–208. doi: 10.1016/s0092-8674(03)00759-1. [DOI] [PubMed] [Google Scholar]
- 8.Reynolds A, Leake D, Boese Q, Scaringe S, Marshall WS, Khvorova A. Rational siRNA design for RNA interference. Nat. Biotechnol. 2004;22:326–330. doi: 10.1038/nbt936. [DOI] [PubMed] [Google Scholar]
- 9.Ui-Tei K, Naito Y, Takahashi F, Haraguchi T, Ohki-Hamazaki H, Juni A, Ueda R, Saigo K. Guidelines for the selection of highly effective siRNA sequences for mammalian and chick RNA interference. Nucleic Acids Res. 2004;32:936–948. doi: 10.1093/nar/gkh247. [DOI] [PMC free article] [PubMed] [Google Scholar]
- 10.Takasaki S, Kotani S, Konagaya A. An effective method for selecting siRNA target sequences in mammalian cells. Cell Cycle. 2004;3:790–795. [PubMed] [Google Scholar]
- 11.Amarzguioui M, Prydz H. An algorithm for selection of functional siRNA sequences. Biochem. Biophys. Res. Commun. 2004;316:1050–1058. doi: 10.1016/j.bbrc.2004.02.157. [DOI] [PubMed] [Google Scholar]
- 12.Hsieh AC, Bo R, Manola J, Vazquez F, Bare O, Khvorova A, Scaringe S, Sellers WR. A library of siRNA duplexes targeting the phosphoinositide 3-kinase pathway: determinants of gene silencing for use in cell-based screens. Nucleic Acids Res. 2004;32:893–901. doi: 10.1093/nar/gkh238. [DOI] [PMC free article] [PubMed] [Google Scholar]
- 13.Holen T, Amarzguioui M, Wiiger MT, Babaie E, Prydz H. Positional effects of short interfering RNAs targeting the human coagulation trigger tissue factor. Nucleic Acids Res. 2002;30:1757–1766. doi: 10.1093/nar/30.8.1757. [DOI] [PMC free article] [PubMed] [Google Scholar]
- 14.Luo KQ, Chang DC. The gene-silencing efficiency of siRNA is strongly dependent on the local structure of mRNA at the targeted region. Biochem. Biophys. Res. Commun. 2004;318:303–310. doi: 10.1016/j.bbrc.2004.04.027. [DOI] [PubMed] [Google Scholar]
- 15.Heale BS, Soifer HS, Bowers C, Rossi JJ. siRNA target site secondary structure predictions using local stable substructures. Nucleic Acids Res. 2005;33:e30. doi: 10.1093/nar/gni026. [DOI] [PMC free article] [PubMed] [Google Scholar]
- 16.Schubert S, Grunweller A, Erdmann VA, Kurreck J. Local RNA target structure influences siRNA efficacy: systematic analysis of intentionally designed binding regions. J. Mol. Biol. 2005;348:883–893. doi: 10.1016/j.jmb.2005.03.011. [DOI] [PubMed] [Google Scholar]
- 17.Saetrom P. Predicting the efficacy of short oligonucleotides in antisense and RNAi experiments with boosted genetic programming. Bioinformatics. 2004;20:3055–3063. doi: 10.1093/bioinformatics/bth364. [DOI] [PubMed] [Google Scholar]
- 18.Pancoska P, Moravek Z, Moll UM. Efficient RNA interference depends on global context of the target sequence: quantitative analysis of silencing efficiency using Eulerian graph representation of siRNA. Nucleic Acids Res. 2004;32:1469–1479. doi: 10.1093/nar/gkh314. [DOI] [PMC free article] [PubMed] [Google Scholar]
- 19.Mittal V. Improving the efficiency of RNA interference in mammals. Nat. Rev. Genet. 2004;5:355–365. doi: 10.1038/nrg1323. [DOI] [PubMed] [Google Scholar]
- 20.Sandy P, Ventura A, Jacks T. Mammalian RNAi: a practical guide. Biotechniques. 2005;39:215–224. doi: 10.2144/05392RV01. [DOI] [PubMed] [Google Scholar]
- 21.Gong D, Ferrell JE., Jr Picking a winner: new mechanistic insights into the design of effective siRNAs. Trends Biotechnol. 2004;22:451–454. doi: 10.1016/j.tibtech.2004.07.008. [DOI] [PubMed] [Google Scholar]
- 22.Ren Y, Gong W, Xu Q, Zheng X, Lin D, Wang Y, Li T. siRecords: an extensive database of mammalian siRNAs with efficacy ratings. Bioinformatics. 2006;22:1027–1028. doi: 10.1093/bioinformatics/btl026. [DOI] [PubMed] [Google Scholar]
- 23.Huesken D, Lange J, Mickanin C, Weiler J, Asselbergs F, Warner J, Meloon B, Engel S, Rosenberg A, et al. Design of a genome-wide siRNA library using an artificial neural network. Nat. Biotechnol. 2005;23:995–1001. doi: 10.1038/nbt1118. [DOI] [PubMed] [Google Scholar]
- 24.Shabalina SA, Spiridonov AN, Ogurtsov AY. Computational models with thermodynamic and composition features improve siRNA design. BMC Bioinformatics. 2006;7:65. doi: 10.1186/1471-2105-7-65. [DOI] [PMC free article] [PubMed] [Google Scholar]
- 25.Jia P, Shi T, Cai Y, Li Y. Demonstration of two novel methods for predicting functional siRNA efficiency. BMC Bioinformatics. 2006;7:271. doi: 10.1186/1471-2105-7-271. [DOI] [PMC free article] [PubMed] [Google Scholar]
- 26.Gong W, Ren Y, Xu Q, Wang Y, Lin D, Zhou H, Li T. Integrated siRNA design based on surveying of features associated with high RNAi effectiveness. BMC Bioinformatics. 2006;7:516. doi: 10.1186/1471-2105-7-516. [DOI] [PMC free article] [PubMed] [Google Scholar]
- 27.Vert JP, Foveau N, Lajaunie C, Vandenbrouck Y. An accurate and interpretable model for siRNA efficacy prediction. BMC Bioinformatics. 2006;7:520. doi: 10.1186/1471-2105-7-520. [DOI] [PMC free article] [PubMed] [Google Scholar]
- 28.Ladunga I. More complete gene silencing by fewer siRNAs: transparent optimized design and biophysical signature. Nucleic Acids Res. 2007;35:433–440. doi: 10.1093/nar/gkl1065. [DOI] [PMC free article] [PubMed] [Google Scholar]
- 29.Matveeva O, Nechipurenko Y, Rossi L, Moore B, Saetrom P, Ogurtsov AY, Atkins JF, Shabalina SA. Comparison of approaches for rational siRNA design leading to a new efficient and transparent method. Nucleic Acids Res. 2007;35:e63. doi: 10.1093/nar/gkm088. [DOI] [PMC free article] [PubMed] [Google Scholar]
- 30.Zheng L, Liu J, Batalov S, Zhou D, Orth A, Ding S, Schultz PG. An approach to genomewide screens of expressed small interfering RNAs in mammalian cells. Proc. Natl Acad. Sci. USA. 2004;101:135–140. doi: 10.1073/pnas.2136685100. [DOI] [PMC free article] [PubMed] [Google Scholar]
- 31.Harborth J, Elbashir SM, Vandenburgh K, Manninga H, Scaringe SA, Weber K, Tuschl T. Sequence, chemical, and structural variation of small interfering RNAs and short hairpin RNAs and the effect on mammalian gene silencing. Antisense Nucleic Acid Drug Dev. 2003;13:83–105. doi: 10.1089/108729003321629638. [DOI] [PubMed] [Google Scholar]
- 32.Vickers TA, Koo S, Bennett CF, Crooke ST, Dean NM, Baker BF. Efficient reduction of target RNAs by small interfering RNA and RNase H-dependent antisense agents. A comparative analysis. J. Biol. Chem. 2003;278:7108–7118. doi: 10.1074/jbc.M210326200. [DOI] [PubMed] [Google Scholar]
- 33.Katoh T, Suzuki T. Specific residues at every third position of siRNA shape its efficient RNAi activity. Nucleic Acids Res. 2007;35:e27. doi: 10.1093/nar/gkl1120. [DOI] [PMC free article] [PubMed] [Google Scholar]
- 34.Teramoto R, Aoki M, Kimura T, Kanaoka M. Prediction of siRNA functionality using generalized string kernel and support vector machine. FEBS Lett. 2005;579:2878–2882. doi: 10.1016/j.febslet.2005.04.045. [DOI] [PubMed] [Google Scholar]
- 35.Krueger U, Bergauer T, Kaufmann B, Wolter I, Pilk S, Heider-Fabian M, Kirch S, Artz-Oppitz C, Isselhorst M, et al. Insights into effective RNAi gained from large-scale siRNA validation screening. Oligonucleotides. 2007;17:237–250. doi: 10.1089/oli.2006.0065. [DOI] [PubMed] [Google Scholar]
- 36.Hung CF, Lu KC, Cheng TL, Wu RH, Huang LY, Teng CF, Chang WT. A novel siRNA validation system for functional screening and identification of effective RNAi probes in mammalian cells. Biochem. Biophys. Res. Commun. 2006;346:707–720. doi: 10.1016/j.bbrc.2006.05.164. [DOI] [PMC free article] [PubMed] [Google Scholar]
- 37.Katayama S, Tomaru Y, Kasukawa T, Waki K, Nakanishi M, Nakamura M, Nishida H, Yap CC, Suzuki M, et al. Antisense transcription in the mammalian transcriptome. Science. 2005;309:1564–1566. doi: 10.1126/science.1112009. [DOI] [PubMed] [Google Scholar]
- 38.Zuker M. Mfold web server for nucleic acid folding and hybridization prediction. Nucleic Acids Res. 2003;31:3406–3415. doi: 10.1093/nar/gkg595. [DOI] [PMC free article] [PubMed] [Google Scholar]
Associated Data
This section collects any data citations, data availability statements, or supplementary materials included in this article.