


Abstract
RecQ family helicases are essential in maintaining chromosomal DNA stability and integrity. Despite extensive studies, the mechanisms of these enzymes are still poorly understood. Crystal structures of many helicases reveal a highly conserved arginine residue located near the γ-phosphate of ATP. This residue is widely recognized as an arginine finger, and may sense ATP binding and hydrolysis, and transmit conformational changes. We investigated the existence and role of the arginine finger in the Bloom syndrome protein (BLM), a RecQ family helicase, in ATP hydrolysis and energy coupling. Our studies by combination of structural modelling, site-directed mutagenesis and biochemical and biophysical approaches, demonstrate that mutations of residues interacting with the γ-phosphate of ATP or surrounding the ATP-binding sites result in severe impairment in the ATPase activity of BLM. These mutations also impair BLM's DNA-unwinding activities, but do not affect its ATP and DNA-binding abilities. These data allow us to identify R982 as the residue that functions as a BLM arginine finger. Our findings further indicate how the arginine finger is precisely positioned by the conserved motifs with respect to the γ-phosphate.
INTRODUCTION
DNA helicases play essential roles in nucleic acid metabolism by facilitating cellular processes including genome replication, DNA repair, recombination, transcription and telomere maintenance (1,2). Helicases function as molecular motors. They use the free energy of nucleotide triphosphate (NTP) binding and/or hydrolysis to translocate along and separate the two complementary strands of a nucleic acid duplex (3). A central question remaining is the manner in which energy produced by ATP binding and/or hydrolysis is coupled to helicase function.
Most SF1 and SF2 helicases are folded into two prominent domains, labelled domains 1 and 2, which are separated by a deep cleft. Each domain contains two sub-domains, referred as A and B (4,5). While the domains 1A and 2A are structurally similar, the domains 1B and 2B show no significant similarity to each other (4,6). Domains 1A and 2A constitute the helicase core, and share a common folding pattern and arrangement of secondary structures with RecA, the Escherichia coli recombination strand exchange enzyme (7). Domain 1A contains the ATP-binding motifs 0, I, Ia and II (the Walker A and B motifs), and the ATP hydrolysis motif III. Domain 2A contains motifs IV and V, which are believed to be involved in DNA binding. Domain 2A also contains motif VI, which may coordinate ATPase and helicase activities. These conserved motifs are present at the interface of the two domains, or at the interface with the oligonucleotide and/or ATP. ATP- and oligonucleotide-binding sites are spatially segregated, but the conserved motifs must function together to couple the ATPase cycle and the intra-molecular conformational changes that drive the processive strand displacement or duplex-unwinding activity. Indeed, a comparison of the structures of PcrA helicase in apo-state and in complex with the same DNA, but different nucleotide factors revealed a significant movement of domains 1B and 2B relative to each other and a closure of the cleft between domains 1A and 2A after the binding of DNA and ATP (8). These observations have established the structural basis for ligand-induced conformational changes that are very important for the overall mechanism of helicases.
Several crystal structures of helicases have revealed that a conserved arginine residue, usually termed ‘arginine finger’, may be involved in the communication between the two RecA-like domains of helicases (7–10). An arginine residue that interacts with the γ-phosphate of a bound nucleotide, and that is located distal to the nucleotide-binding site is known as an arginine finger (11,12). Arginine fingers contribute to NTP hydrolysis through stabilization of the transition state of the reaction, and function as a trigger for conformational changes after NTP hydrolysis (11–13). Depending on the enzyme, the arginine finger may be located in a separate activator protein, for example GAP-Ras (14), or it may also be located in an adjacent subunit of an oligomeric protein: F1-ATPase (15), AAV2 Rep40 (16), the bacteriophage T7 gene 4 helicase (17), the replication factor C (18) and the SV40 LTag helicase (19). The arginine finger may also be found in a distinct domain within the protein, as in most SF1 and SF2 helicases. In the structure of PcrA complexed with AMP–PNP, the guanidium groups of residue R287, located between motif III and IV, and of R610, located in motif VI, form a salt bridge with the γ-phosphate of the nucleotide. Mutation analysis has confirmed that both R287 and R610 are involved in ATP hydrolysis (20). Two arginine residues in motif VI are highly conserved in RecQ family helicases and are spatially located close to the ATP γ-phosphate (Figure 1A and B). In the E. coli RecQ atomic resolution structure, both highly conserved Arg326 and Arg329 in motif VI [equivalent to Arg979 and Arg982 in Bloom syndrome protein (BLM)] are near the γ-phosphate of the nucleotide (10,21) (Figure 1B). Comparing the crystallographic structures, the position of Arg326 relative to the ATP-binding sites in RecQ is similar to that of R610 in PcrA; however, it remains to be determined which residue is an arginine finger or whether both residues are involved in stabilizing the γ-phosphate of the nucleotide. In addition, inspection of the crystal structure of the E. coli RecQ helicase and the molecular modelling model of BLM protein indicated that the spatial position of the putative arginine finger residues may be further positioned by several residues at/or near the interface between the two domains. As shown in Figure 1C, the interactions between H798 and Q975 may help to stabilize the position of R979. Similarly, the D983–R959 salt bridge could keep R982 at an appropriate spatial position to coordinate the interaction between the oxygen atom of the γ-phosphate of a bound nucleotide and the guanidinium amine group of R982.
Figure 1.

(A) Schematic presentation of the conserved residues mutated in this study. BLM protein domain/motif organizations are shown above the BLM protein schema. Conserved residues are highlighted in red and the mutated residues are shown at the bottom of the figure. Alignment was performed using CLUSTALW and refined manually. (B) Superposition of the BLM modelled structure (in grey) with the PcrA crystal structure (in cream) showing the side chains of R979 and R982 from BLM (residues highlighted in grey) spatially equivalent to R610 and R287 respectively in PcrA (residues highlighted in cream). The least-squares superposition gave a RMSD of 1.25 Å. Residue numbering for PcrA is indicated besides the label PcrA. In blue and in brackets are the one-letter codes of the analogous residues in RecQ from E. coli. (C) Detailed view of the environment of the R982 arginine finger and the ATP-binding site of the BLM–ATP modelled structure. The molecular structure of BLM in complex with ATP was modelled according Guo et al. (22). The conserved helicase motifs are coloured as follows: motif 0 is drawn in gold, motif I in green, motif II in blue and motif VI in purple. The conserved aromatic-rich loop is in magenta and the rest of the structure is coloured grey. ATP is drawn in cream with a ball-and-stick representation and the manganese ion is in cyan. Residues thought to be involved in ATP binding or hydrolysis are indicated. H798, H805 and Q975, possibly participating in interactions between domains II and VI, are also indicated. The salt bridge linking conserved residues R959 and D983 is indicated in dashed lines. The one-letter codes and positions of the analogous residues in RecQ from E. coli are coloured blue and are in brackets. The red double arrow suggests a motion for R979 side chain. Highlighted in grey are the labels of subdomains 1A and 2A.
Here, we describe studies of the BLM to investigate the role of the postulated ‘arginine finger’ of RecQ family helicases in ATP hydrolysis and energy coupling. Although both arginine residues, R979 and R982, in BLM may be involved in ATP hydrolysis, R982 appears to be crucial in stabilizing the transition state and may act as an arginine finger. Our data provide new insights into how the conserved helicase motifs are spatially organized into a network monitoring the presence or absence of a γ phosphate on the nucleotide, and how this allows communication between the two domains.
MATERIALS AND METHODS
Plasmid construction and site-directed mutagenesis
We created a plasmid for over-producing the BLM helicase core protein, consisting of amino acid residues 642–1290. To produce a recombinant protein bearing six-histidine tag at N-terminal, the gene encoding BLM (642–1290) was inserted between the NdeI and XhoI cloning sites of the expression plasmid pET15b (Novagen). The resulting plasmid, referred to as pET-BLM642–1290, was used as the target plasmid for site-directed mutagenesis. All point mutations were constructed by PCR with primers carrying the desired mutations (Table 1). To verify that there were no undesired mutations, the PCR products were sequenced at MWG (MWG Biotech, Germany) by the fluorescent DNA sequencing method.
Table 1.
Sequences of oligonucleotides used for site-directed mutagenesis and DNA substrates
| BLM | Recombinant or mutagenic PCR primer (5′–3′) | |
|---|---|---|
| WT | F-GGAATTCATATGGAGCGTTTCCAAAGTCTTAGTTTTCCT R-CCGCTCGAGTTACGATGTCCATTCAGAGTATTTCTGTAA | |
| H798A | F-ATTGATGAAGCAATTTGTGTCAGTCAG R-CTGACTGACACAAATTGCTTCATCAAT | |
| R959A | F-GTACAGAAGGACACCCTGACTCAGCTG R-CAGCTGAGTCAGGGTGTCCTTCTGTAC | |
| Q975V | F-GAGGGTTACTACGTAGAATCTGGCAGA R-TCTGCCAGATTCTACGTAGTAACCCTC | |
| R979A | F-TACCAAGAATCTGGCGCAGCTGGAAGAGATGGG R-CCCATCTCTTCCAGCTGCGCCAGATTCTTGGTA | |
| R982A | F-TCTGGCAGAGCTGGAGCAGATGGGGAAATATCT R-AGATATTTCCCCATCTGCTCCAGCTCTGCCAGA | |
| R979/982A | F-TACCAAGAATCTGGCGCAGCTGGAGCAGATGGGGAAATA R-TATTTCCCCATCTGCTCCAGCTGCGCCAGATTCTTGGTA | |
| DNA substrate | length | DNA substrate sequence (5′–3′) |
| A | 44 | GCACTGGCCGTCGTTTTACGGTCGTGACTGGGAAAACCCTGGCG |
| B | 25 | CGCCAGGGTTTTCCCAGTCACGACC |
| C | 36 | ACGTGGGCAAAGTTCGTCAATGGACTGACAGCTGCA |
| D | 21 | Fluo-GGGTTAGGGTTAGGGTTAGGG |
Protein expression and purification
All proteins (BLM642–1290 and its corresponding variant) were purified as described (22). Briefly, a single colony of the E. coli strain (BL21(DE3)-condonplus, Stratagene) producing the corresponding protein was grown overnight in 10 ml of LB containing 80 µg/ml ampicillin and 34 µg/ml chloramphenicol at 37°C. We diluted 0.1 ml of this culture with 1 l of pre-warmed LB. The cells were grown to mid-exponential phase (A600 of 0.5–0.6) at 37°C. Over-production of proteins was induced by the addition of isopropyl-1-thio-α-d-galctopyranoside to a final concentration of 0.25 mM, and the culture was further shaken at 15°C for 18 h. The cells were harvested by centrifugation and suspended in a final volume of 25 ml of the lysis buffer (50 mM Tris–HCl, pH 7.5, 500 mM NaCl, 0.1% Triton X-100, PMSF 0.1 µM and 10% ethylene glycerol). Cells were lysed with a French press and the lysates were sonicated to reduce viscosity. To remove insoluble materials, the cell lysates were centrifuged twice at 15 000g for 45 min. The soluble extract was applied to a column containing 20 ml nickel-coated resin (Novagen) and the subsequent purification procedures were performed with a FPLC system (ÄKTA Purifier) at 18°C. The column was washed with lysis buffer until the UV absorbance at 280 nm stabilized. Bound proteins were eluted with a 300 ml linear gradient of imidazole (0.02–0.4 M). Fractions containing the proteins were identified by SDS–PAGE. Pooled fractions were concentrated and further purified by FPLC size exclusion chromatography (Superdex 200, Amersham Bioscience). The purified proteins were run on SDS–polyacrylamide gels and stained with Coomassie brilliant blue. The concentrations of the purified proteins were determined by the Bio-Rad dye method using bovine serum albumin (BSA) as the standard.
DNA substrates preparation
PAGE-purified DNA substrates were purchased from Proligo (France) (Table 1). Duplex DNA substrates were prepared as described previously (23). Briefly, 250 µM oligonucleotides were denatured in 1× TE, containing 1 M NaCl or 1 M KCl, by incubating at 95°C for 10 min. Denatured oligonucleotide was annealed at 37°C for 48 h. The DNA substrate was further purified using 8% native PAGE containing 10 mM KCl at 4°C for 12 h with constant current of 20 mA. The purified duplex DNA was excised from the gel and incubated with the elution buffer (0.1% SDS, 1 mM EDTA, 0.3 M sodium acetate, pH = 5.2) at room temperature overnight. The eluted duplex DNA was concentrated with ethanol precipitation.
ATPase assay
The ATPase activity was detected by measuring the release of free phosphate during ATP hydrolysis (24,25). The reaction was carried out in ATPase reaction buffer (50 mM Tris–HCl, pH 8.0, 3 mM MgCl2, 0.5 mM DTT) at 37°C in a volume of 100 µl. The reactions were initiated by the addition of enzymes into the reaction mixture containing 0.5 µM ssDNA (nt, 60-mer oligonucleotide) and the indicated concentration of ATP. Eighty-microlitre aliquots were transferred from the reaction mixture every 30 s into a hydrochloric solution of ammonium molybdate, stopping the reaction. The liberated radioactive γ32Pi was extracted with a solution of 2-butanol-benzene-acetoneammonium molybdate (750:750:15:1) saturated with water. An aliquot (60 µl) was removed from the organic phase and the radioactivity was quantified using a liquid scintillation counter.
Helicase assay
Radiometric assay
DNA helicase reactions were incubated at 37°C. The reaction mixtures contained 25 mM HEPES-NaOH, pH 7.5, 25 mM CH3CO2Na, 7.5 mM (CH3CO2)2Mg, 1 mM ATP, 1 mM DTT, 0.1 mg/ml BSA, and the indicated 32P-labelled partial duplex DNA substrate (10 fmol, 3000 c.p.m./fmol). Reactions were initiated by adding various concentrations of BLM proteins at 37°C. Reactions were terminated after 30 min by adding 5 µl of 5× loading buffer (50 mM EDTA, 0.5% SDS, 0.1% xylene cyanol, 0.1% bromophenol blue and 50% glycerol). The products of the helicase reactions were run on a 12% (w/v) polyacrylamide gel (acylamide to bis-acrylamide ratio 19:1) in TBE buffer (90 mM Tris, 90 mM boric acid and 1 mM EDTA, pH 8.3) at 100 V for 2 h at 4°C.
Fluorometric assay
Stopped-flow DNA-unwinding assays were performed as described (26). Briefly, the experiments were performed using a Bio-logic SFM-400 mixer with a 1.5 mm × 1.5 mm cell (Bio-Logic, FC-15) and a Bio-Logic MOS450/AF-CD optical system equipped with a 150-W mercury-xenon lamp. Fluorescein was excited at 492 nm (2-nm slit width), and its emission was monitored at 525 nm using a high pass filter with 20-nm bandwidth (D525/20; Chroma Technology Co.). The experiments were conducted in two-syringe mode, where helicase and duplex DNA substrates were pre-incubated in syringe 1 for 5 min and ATP in syringe 4. Each syringe contained unwinding reaction buffer (25 mM Tris–HCl, pH 7.5 at 25°C, 50 mM NaCl, 1 mM MgCl2 and 0.1 mM DTT) and the unwinding reaction was initiated by rapid mixing of the two syringes. The sequences of the two strands of the 56:16-mer DNA substrate are 5′H-AATCCGTCGAGCAGAG(dT40)-3′, labelled with hexachlorofluorescein (H), and 3′F-TTAGGCAGCTCGTCTC-5′, labelled with fluorescein (F). Due to the unwinding and thus the separation of the two DNA strands, the FRET (fluorescence resonance energy transfer) between the two fluorescent molecules was reduced. As a result, the fluorescence emission, F(t), of the donor fluorescein was increased from an initial (Fini) value to a saturating value (26). Control experiment has shown that in the absence of ATP, no emission change was observed, the same as in the case of RecQ (26). To convert the output data from volts to unwinding amplitude, we performed a calibration experiment in a four-syringe mode where the helicase was in syringe 1, H-labelled ss oligonucleotides in syringe 2, F-labelled ss oligonucleotides in syringe 3 and ATP in syringe 4. Each syringe contained unwinding reaction buffer. After mixing the solutions from the four syringes, the fluorescent signal of the mixed solution was measured, giving a value (F100%) that corresponded to 100% unwinding. The time courses of DNA unwinding was then obtained using A(t) = [F(t) − Fini]/(F100% − Fini). The standard reaction temperature was 25°C and all concentrations listed were after mixing unless noted otherwise. Data were fitted with Equation (1)
| 1 |
where A1 (A2) and kobs,1 (kobs,2) represent, respectively, the unwinding amplitude and rate of the fast (slow) phase.
DNA-binding assay
Electrophoretic mobility shift assay (EMSA)
Binding reactions (20 µl) were performed in standard binding buffer (40 mM Tris–HCl, pH 7.0, 1 mM EDTA, 20 mM NaCl, 8% glycerol and 20 µg/ml BSA). Protein and DNA substrate concentrations are indicated in the figure legends. DNA–protein-binding reaction mixtures were incubated at room temperature for 30 min. After adding 4 µl of native loading dye (0.25% bromophenol blue in 30% glycerol), reaction mixtures were loaded on a 6% non-denaturing polyacrylamide gel (19:1). Electrophoresis was carried out at a constant voltage of 14 V/cm at 4°C in 1× TAE (40 mM Tris acetate, 1 mM EDTA, pH 8.0) for 3 h. The gel was dried and processed for autoradiography.
Fluorescence polarization assay
DNA binding was further analysed by fluorescence polarization as described previously (23). The assays were performed using a Bio-logic auto-titrator (TCU-250) and a Bio-Logic optical system (MOS450/AF-CD) in fluorescence anisotropy mode. Various amounts of protein were added to 1 ml of binding buffer containing 2 or 5 nM DNA substrate. Each sample was allowed to equilibrate in solution for 1.5 min, after which fluorescence polarization was measured. Titrations were performed in a temperature-controlled cuvette at 25°C. The solution was stirred continuously by a small magnetic stir bar during the entire titration process. The binding isotherms were determined and fit to Equation (2).
| 2 |
where A is the fluorescence anisotropy at a given concentration of the enzyme, Amax is the anisotropy at saturation and Amin is the initial anisotropy. ▵ = DT + NPT + Kd, DT is the total concentration of DNA, PT is the concentration of the enzyme in the binding solution.
ATP-binding assays
Nitrocellulose filter-binding assay
The ATP-binding affinities of BLM642–1290 and the mutants were measured by nitrocellulose filter binding as previously described (17). The assays were performed at 4°C. A constant amount of ATP and various concentrations of the proteins were used in the nitrocellulose assays. Nitrocellulose filters (25 mm) were washed with 0.5 M NaOH for 10 min, rinsed with double-distilled water, and then equilibrated in wash buffer (40 mM Tris–HCl, pH 7.5/10 mM MgCl2/50 mM potassium glutamate). The proteins (from 5 to 30 μM) were mixed with 200 μM ATP and [γ-32P]ATP in the absence of DNA in 40 mM Tris–HCl (pH 7.5)/10 mM MgCl2/10 mM DTT/50 mM potassium glutamate/10% glycerol in a total volume of 20 μl. The reaction mixtures were incubated for 30 min on ice or 10 min at room temperature, and 15 μl aliquots were filtered through the nitrocellulose filters. The membranes were washed twice with 2 ml of ice-cold wash buffer. The radioactivity of the nitrocellulose membrane was quantified using a liquid scintillation counter. The ATP-binding stoichiometry was calculated from the radioactivity count.
Fluorometric mantATP-binding assays
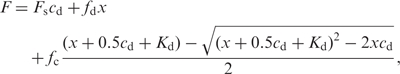
We also used a fluorescent nucleotide analogue (mantATP) to determine the apparent dissociation values for ATP binding (27). Fluorescence spectra of the proteins were measured using FluoroMax-2 spectrofluorimeter (Jobin Yvon, Spex Instruments S.A., Inc.) at 25°C. We used 0.5 µM protein in 1 ml reaction buffer (25 mM Tris–HCl, pH 7.5, 50 mM NaCl and 0.1 mM DTT) in a 10 × 10 × 40 mm3 quartz cuvette. The fluorometric mantATP-binding assays were performed using a Bio-logic auto-titrator (TCU-250). Each protein was titrated with various concentrations of mantATP, during which the protein was excited at 280 nm and the fluorescence of mantATP at 440 nm due to FRET was measured. The apparent dissociation constant Kd was determined by fitting the fluorescence intensity (corrected for the inner filter effect) to Equation (3),
 |
3 |
where Fs is the starting fluorescence of the reaction mixture, fd is the fluorescence coefficient of free mantATP, fc is the fluorescence coefficient of complex formed and x is the total concentration of mantATP. cd = V0/(V0 + Vi) ≡ 1 − x/[mantATP] is included to correct accurately for the sample dilution effect, where V0 is the initial sample volume, Vi is the volume of titrant added and [mantATP] is the mantATP concentration of the titrant.
Preparation of orthovanadate (Vi) solutions
To ensure formation of a transition state with Vi, the Vi stock solution was prepared according to Ko et al. (28). Briefly, Na3VO4 powder was dissolved in water and the pH adjusted with HCl to pH 10 (orange colour). The solution was boiled for 2 min and consequently became clear. The pH was readjusted to pH 10 and boiling was repeated twice. The Vi concentration was determined using a molar extinction coefficient of 2925 M−1cm−1. The solution was covered with aluminium foil and stored at –80°C until use.
RESULTS
The previous studies have shown that a recombinant helicase of BLM protein that is composed of residues 642–1290 (BLM642–1290) displays similar biological properties, both in vitro and in vivo, to that of the full-length BLM protein (22,29). The BLM642–1290 not only exhibited comparable ATPase, helicase activities and DNA substrates specificity to the full-length protein, but also suppresses spontaneous and UV-induced illegitimate recombination in E. coli (29). Since no enzymatic activity can be attributed to the N-terminal region of BLM, we used the BLM642–1290 protein fragment in this study for the sake of facilities of the experiments.
Vi inhibits and uncouples ATPase and DNA-unwinding activities of BLM642–1290
Orthovanadate (Vi) is widely used to probe the catalytic mechanism of nucleotide-5'-triphosphotase. Not all ATPases are inhibited by Vi (28); however, most ATPases that possess an arginine finger at nucleotide-binding sites, for example the F1-ATPase (13), MutS (30) and bacteriophage T7 gene 4 helicase (17), are potentially inhibited by Vi. The inhibition involves the formation of a Mg2+ADP.Vi transition-state-like complex. If the ATPase activity of a protein is efficiently inhibited by Vi, it suggests, although does not prove, that the catalytic site of the protein may shares structural features with other ATPases that have an arginine finger. We compared several ATPases with E. coli RecQ and the BLM molecular modelling model. BLM nucleotide-binding sites are structurally similar to ATPases that have an arginine finger (Figure 1B and C). This structural feature should make BLM sensitive to Vi. As expected, the BLM ATPase activity was dose-dependently inhibited by vanadate, and it took 45 min to reach the maximal inhibition at 1 mM Vi (Figure 2A). In order to investigate whether Vi affects DNA unwinding, we measured the DNA-unwinding activity under similar experimental conditions as used for ATPase activity in the presence of Vi. Vi inhibited the DNA-unwinding activity more efficiently than the ATPase activity (Figure 2B). Interestingly, this result is quite similar to that observed for T7 gene 4 helicase (17). As proposed previously by Crampton and colleagues (17), it suggests that the ATPase and DNA helicase activities are, at least partially, uncoupled in the presence of Vi. This probably represents a common feature of helicases possessing an arginine finger.
Figure 2.

(A) Time-dependent losses of ATPase activity upon incubation of BLM with Vi. ATP hydrolysis activity was measured with 1 mM Vi in a reaction containing 0.2 µM (bp) ssDNA, 1 mM ATP, 0.1 µCi[γ-32]ATP, 200 nM of BLM protein at the indicated times. (B) Uncoupling of ATPase and helicase activities in the presence of Vi. ATPase (square) and helicase (circle) activities were measured under similar conditions as indicated above (A), except that 1 nM of 25-bp duplex DNA was used for helicase assay. Each data point represents the mean of two or three experiments.
Design, expression and purification of BLM mutations
To better understand the role of the BLM helicase arginine finger in ATP hydrolysis and energy coupling, we introduced two categories of mutations into the BLM642–1290 protein fragment using the structural information obtained from E. coli RecQ helicase and our BLM molecular modelling (Figure 1). To explore the possibility that an arginine residue near the γ-phosphate of nucleotide acts as an arginine finger, either Arg979 or Arg982 (equivalent to Arg326 and Arg329 of E. coli helicase) or both were replaced by an alanine residue. To investigate how the ATP binding and hydrolysis signal is relayed to the second domain (domain 2A) via the arginine finger, residues Q975 in motif VI and H798 in motif II were replaced by valine and alanine, respectively; in these mutants the hydrogen bonds between Q975 and H798 are, obviously, altered. Also, R959 was replaced by an alanine residue to disrupt the salt bridge between Asp983 and Arg959 (Figure 1C). The six mutants were constructed using site-directed mutagenesis. The intact BLM gene contains amino acids residues 642–1290 (BLM642–1290). The intact BLM gene and each mutated gene were expressed in an E. coli pET expression system. The mutants and the wild-type BLM642–1290 fragment were over-produced and purified using Ni-agarose affinity and gel filtration chromatography columns to homogeneity (purity of 90–95%; Figure 3).
Figure 3.

SDS–PAGE analysis of the purified BLM642–1290 and various mutants. The proteins (indicated above the figure) were resolved on a 10% SDS–polyacrylamide gel and stained with Coomassie blue. The concentration of the proteins used was ∼15 µg. The positions of the marker proteins (in kDa) are indicated on the left.
Helicase and ATPase activities of the mutant enzymes
We detected no helicase activity in any of the mutant enzymes using EMSAs (Figure 4A and B). We also measured the helicase activity of the mutant proteins with a fluorometric stopped-flow method, which is based on FRET. This method was used to exclude the possibility that EMSAs, which measure DNA-unwinding activity, underestimate the amount of DNA unwinding. BLM642–1290 displayed efficient helicase activity, but all the mutant enzymes failed to unwind DNA substrates under similar experimental conditions (Figure 4C). This is consistent with the results for EMSAs, and indicates that the DNA-unwinding activity was severely impaired in mutant enzymes (Figure 4A and B).
Figure 4.

(A and B) DNA-unwinding activity of wild-type and mutant BLM proteins revealed by radiometric assay using duplex DNA. The DNA substrate was constructed with 5′-32P-labelled oligonucleotides A and non-labelled oligonucleotide B (Table 1). DNA substrate measuring 1 nM was incubated at 37°C with wild type and various mutants in the helicase assay buffer. The reactions were terminated after 30 min and the samples were analysed by electrophoresis on a 12% non-denaturing polyacrylamide gel. The concentrations of the proteins were between 0.25 and 60 nM as indicated in the bottom of the gel panel, where C1 and C2 represent the DNA substrate alone and the boiled DNA substrate, respectively. (C) DNA-unwinding activity measured by stopped-flow DNA-unwinding assay. As described in the Materials and Methods section, 2 nM 56:16-mer DNA substrate was pre-incubated with 20 nM helicase for 5 min at 25°C. The unwinding reaction was initiated by mixing with 1 mM ATP. The fluorescence emission of fluorescein at 525 nm (excited at 492 nm) was monitored. The fraction of DNA unwound was calculated by normalization of the fluorescence signal. The solid curve is the best fit of the data to Equation (1), with A1 = 62.8 ± 0.6%, kobs,1 = 0.52 ± 0.01s−1, A2 = 23.2 ± 0.6% and kobs,2 = 0.05 ± 0.01 s−1.
DNA-stimulated ATPase activities of BLM642–1290 and the various mutants were assayed by varying the concentration of ATP substrate (Figure 5). The resulting curves were fitted using the Michaelis–Menten equation. The rate constant (kcat), KM and ATPase catalytic efficiency (kcat/KM) were determined from results shown in Figure 5 and are summarized in Table 2. All mutant proteins had lower kcat values for ATP hydrolysis than BLM642–1290, and were between 5.2-fold lower for R979A to 2880-fold lower for Q975V. Mutant H798A had only a slightly high KM value for ATP than BLM642–1290. Mutants R959A and R982A exhibited significantly lower ATP KM values than BLM642–1290. The low rate of ATP hydrolysis in Q975V made it technically impossible to determine its KM value. These data indicate that all of the mutated residues are important for ATP hydrolysis, but are not directly implicated in ATP binding because the KM values are not greatly increased. BLM is a DNA-stimulated ATPase, and the low ATPase activity observed with the altered BLM proteins may be due to a low affinity for either ATP or for DNA. We investigated ATP-binding and DNA-binding activities of both intact BLM642–1290 and mutant proteins with various other assays.
Figure 5.

ATP hydrolysis activity of wild-type and mutant BLMs as a function of ATP concentration. Experiments were performed in ATPase assay buffer at 37°C with 0.2 µM ssDNA (nt, 60-mer oligonucleotide) and 0.2 µM protein for each enzyme. The ATP hydrolysis was quantified as described in Materials and Methods section. Solid lines represent the best fit of the data to the Michaelis–Menten equation. The apparent kcat and KM values are summarized in Table 2.
Table 2.
ATPase, DNA binding and ATP-binding activities of the wild-type and mutant BLM proteins
| Helicases | ATPase | DNA binding | ATP binding | ||||
|---|---|---|---|---|---|---|---|
| kcat (s−1) | kcat decrease factor | KM (mM) | kcat/KM (s−1·mM−1) | Kd/N (nM) | Molar ratio ATP/Protein | Kd (µM) | |
| BLM642–1290 | 14.4 | 1 | 0.81 ± 0.1 | 18 | 1.11 ± 0.11 | 0.88 ± 0.12 | 0.47 ± 0.06 |
| H798A | 0.82 | 17.6 | 1.5 ± 0.2 | 0.54 | 5.03 ± 0.55 | 0.86 ± 0.17 | 0.52 ± 0.06 |
| R959A | 0.61 | 23.6 | 0.52 ± 0.1 | 1.21 | 4.15 ± 0.40 | 1.02 ± 0.18 | 0.62 ± 0.04 |
| Q975V | 0.005 | 2880 | NDa | ND | 3.31 ± 0.40 | 0.78 ± 0.18 | 0.65 ± 0.09 |
| R982A | 1.1 | 13.1 | 0.48 ± 0.11 | 2.4 | 2.13 ± 0.32 | 0.85 ± 0.16 | 0.88 ± 0.14 |
| R979A | 2.8 | 5.2 | 0.65 ± 0.012 | 4.3 | 1.91 ± 0.46 | 0.82 ± 0.17 | 0.66 ± 0.15 |
| R979/982A | 0.6 | 24 | 0.75 ± 10.2 | 0.8 | 1.32 ± 0.49 | 0.86 ± 0.16 | 0.47 ± 0.11 |
aND: values cannot be determined precisely.
All mutants display normal ATP and DNA-binding abilities
We investigated whether altered BLM proteins bind ATP similarly to BLM642–1290. We used a nitrocellulose filter-binding assay to determine the stoichiometry of ATP binding. All mutants bound ATP with similar stoichiometry to BLM642–1290 (Figure 6A and Table 2). We determined the ATP-binding affinities of BLM642–1290 and mutant proteins by fluorometric titration assays which measure the equilibrium binding of mantATP, the ATP analogue. The fluorescent properties of mantATP are suitable for FRET from the intrinsic protein fluorophore (22). Our previous studies have confirmed that mantATP binds to BLM and it is a substrate of BLM protein in the presence of DNA (22,27), but is not a substrate in the absence of DNA, confirming that our mantATP-binding experience is performed under equilibrium condition. We report the titration curves obtained with a constant amount of BLM protein and various concentrations of mantATP (Figure 6B). The apparent Kd of mantATP for various BLM mutants was determined from the mathematical fit to these experimental curves (Table 2). Most mutants bound ATP with an affinity almost identical to that of BLM642–1290. This is consistent with our BLM model: all mutated residues located close to the γ-phosphate of ATP or near the outer sphere of the ATP-binding sites do not affect ATP binding.
Figure 6.

ATP-binding activities as determined by nitrocellulose filter (A) and fluorometric (B) assays. (A) The ATP binding was determined with three concentrations of BLM642–1290 and mutants (5, 15 and 30 µM) in the presence of 200 µM ATP and 0.1 µCi[γ-32]ATP. The data reported are means of triplicate assays. (B) Changes in fluorescence intensity when 0.2 µM (H798A) or 0.5 µM (the others) of the enzymes were titrated with various concentrations of mantATP. Data reported are means of triplicate assays. Solid lines represent the best fit of the data to Equation (3) and the apparent Kd values are summarized in Table 2.
In general, a combination of efficient ATP and DNA bindings may provide the maximal ATPase activity for ATPases. We investigated the DNA-binding ability of these mutants to see whether the observed ATPase deficiencies result from the failure of DNA binding. We used EMSAs to test whether BLM proteins bound DNA. All mutants displayed migration patterns similar to that of BLM642–1290, indicating that there was no apparent defect in DNA binding (Figure 7A and B). It is still possible that there are some subtle differences between the mutants, but these are difficult to determine using the gel shift method. Therefore, to determine the dissociation constant of DNA binding quantitatively, we used a fluorescence anisotropy assay to measure the apparent Kd values under equilibrium conditions (23). We titrated fluorescein-labelled 22-mer oligonucleotide with various concentrations of BLM protein. The resulting binding isotherms are fitted with Equation (2) (Figure 7C and D). The apparent dissociation constants per binding site determined from the titration curves are summarized in Table 2. The Kd/N values of all mutants are similar to those of BLM642–1296; this is consistent with the results from the radiometric assay, and confirms that the altered proteins bind DNA in a similar manner to BLM642–1290.
Figure 7.

(A and B) Analysis of DNA-binding activity of the BLM642–1290 and mutant BLMs using electrophoretic mobility shift assay. One nanomole of 5'-32P-labelled 36-mer ssDNA (oligonucleotide C, Table 1) was incubated at room temperature for 20 min with various concentrations of protein between 2.5 and 160 nM in unwinding buffer. Bound and free DNA were separated by electrophoresis on a non-denaturing 15% polyacrylamide gel and detected by autoradiography. (C and D) The anisotropy-based DNA-binding isotherms of wild-type and mutant BLM proteins. Fluorescence anisotropy values were determined as a function of enzyme concentrations for 21-mer ssDNA substrates (oligonucleotide D, Table 1). Two nanomolar fluorescein-labelled DNA was titrated with various amounts of RecQ under conditions as described in Materials and Methods section. The solid lines represent the best fits of the data to Equation (2). The determined values of dissociation constant per binding site (Kd/N) are summarized in Table 2.
Vi inhibition study reveals that R982 functions as an arginine finger
R979 and R982 are localized near the γ-phosphate of ATP and the altered proteins display defects in ATPase activity. However, R982A impaired ATPase activity more than R979A (Table 2). We determined whether R979A and R982A are inhibited by Vi in a similar manner to identify the arginine residue involved in the transition state complex. Residual ATPase activity of the R979A mutant was inhibited by Vi, in a similar manner to that of BLM, and the residual ATPase activity of R982A was unaffected under similar experimental conditions (Figure 8A), indicating that R982A may function as an arginine finger. We further reasoned that if the arginine residue 982 is specifically involved in the transition state complex, the other mutants such as H798A, R959A and Q975V, which are structurally far from the γ-phosphate of ATP, should be still sensitive to inhibition by Vi. As expected, H798A and R959A display very similar inhibition profile as that of R979A and BLM642–1290 (Figure 8A). The residual activity of Q975V is too low to be tested for Vi inhibition. In the above experiments, inhibition of ATPase activity by Vi was determined under turnover conditions in which ATP was present as major component. Vi inhibits ATPase activity through formation of a MgADP. Vi–BLM transition state complex; thus, we compared Vi-induced inhibition of BLM, mutant R979A and mutant R982A under the condition in which the enzymes were pre-incubated with ADP. The ATPase activities of BLM and R979A were strongly inhibited under these conditions. R982A was not inhibited by Vi, indicating that R982A cannot form this ATP hydrolysis transition state (Figure 8B). We analysed the type of inhibition caused by Vi. We measured Vi-induced inhibition of ATPase activity of BLM and the mutant R979A at various concentrations of ATP (Figure 8C and D). A Lineweaver–Burk and Eadie–Hofstee analysis indicated that R979A and BLM are inhibited similarly: Vi-inhibition of ATP hydrolysis is consistent with a non-competitive mechanism and both proteins display similar inhibition constants (Ki = 1 and 1.5 for BLM and R979A, respectively). The Ki for R982A was technically difficult to determine because the variation of the residual activity of R982A was not significant in the presence of orthovanadate. These various findings indicated that the residue R982, but not the residue R979, is involved in the formation of MgATP.Vi–BLM transition state complex.
Figure 8.

R982 is insensitive to orthovanadate inhibition. (A) Effects of Vi on ATPase activities of BLM642–1290 and the mutants H798A, R959A, R979A, R982A and R979A/R982A. Hydrolysis of ATP was measured in a reaction containing 0.2 µM (bp) ssDNA, 1 mM ATP, 80 nM of different proteins and the indicated amounts of Vi. (B) Vi-induced inhibition of BLM642–1290, mutant R982A and mutant R979A proteins in the presence of ATP and ADP. Prior incubations were carried out with 80 nM protein and 0.6 mM Vi in the presence of ADP or ATP as indicated in the figure. ATPase activity was assayed as described in Materials and Methods section. (C and D) Determination of the vanadate inhibition type for BLM642–1290 (C) and mutant R979A (D). The experiments were performed under similar conditions to those described in the legend to Figure 2, with the indicated vanadate concentrations. The plot was constructed as 1/Vi versus 1/[ATP] to obtain the Ki value from the intercept on the abscissa.
DISCUSSION
With the progress of helicase structure and function research, there is growing evidence that all helicases couple the energy of ATP hydrolysis to conformational changes for DNA unwinding and translocation along the DNA molecule. The mechanism of this coupling is not fully understood. It may involve a process in which ATP binding and hydrolysis are detected by the residues at the nucleotide-binding pocket and the signal was transmitted to the DNA-binding site. This destabilizes the duplex DNA, making the helicase translocate along the single-strand product. Previous studies have identified several structural elements and/or residues essential for the coupling of ATP hydrolysis and conformational changes (20,31–33). We focused on the role of the putative arginine finger in the regulation of the RecQ family helicase activities. We used BLM as a study model for the following reasons: (i) the sequence alignments of several RecQ family helicases, bacterial and human, show that the residues involved in the putative arginine finger and their organization are highly conserved (Figure 1A); (ii) our BLM molecular model is based on the crystal structure of E. coli RecQ helicase; the root mean square deviation for 516 Cα atoms between the E. coli RecQ backbone and that of the recombinant BLM-containing residues 642–1290 (BLM642–1290) is 0.7 Å, indicating that BLM642–1290 folds very similarly to E. coli RecQ helicase (Figure 1C); (iii) we have previously used BLM642–1290 to study the molecular consequence of several disease-causing mutations in BS patients, and this study may help understand the mechanism underlying BLM catalysis and interpret newly identified BLM-causing mutations in the future; (iv) Previous study has shown that the 642–1290 fragment displayed the same or very similar properties with the full-length BLM both in vitro and in vivo (22,29). Importantly, the BLM642–1290 was able to substitute for the RecQ helicase in suppressing illegitimate recombination in E. coli. In order to facilitate our study and get essential information concerning the arginine finger, the BLM642–1290 was used in this study.
We have demonstrated that BLM is sensitive to Vi; this indicates that Vi can incorporate into the catalytic sites and assist in transition-state stabilization of BLM. We mutated several residues in the helicase signature motifs clustered around the nucleotide-binding pocket. We have shown that replacing R979 and R982, each by an alanine residue, does not significantly affect the ATP and DNA-binding abilities, but results in lower steady-state ATP hydrolysis rates than the intact BLM642–1290. These observations indicate that the R979 and R982 residues play no major functional role in providing binding energy for ATP, but are crucial for ATP hydrolysis. This is consistent with the atomic resolution structure of E. coli RecQ and our molecular model: the guanidinium groups of both arginine residues are close to the γ-phosphate of ATP (Figure 1C). ATP hydrolysis is impaired in mutant R982A, but the catalytic efficiency of mutant R979 is only reduced to 25%. This suggests that residue R982 plays a more crucial role in ATP hydrolysis than R979 and R982 may function as an arginine finger. To confirm this, we studied the ATPase activity of R979A and R982A in the presence of orthovanadate, which complexes with nucleotide 5'-diphosphate and mimics the catalytic transition state through the formation of a Mg2+ADP–Vi–Protein complex. The residual ATPase activity of R979A was inhibited by Vi and the inhibition was similar to that of wild-type BLM642–1290 fragment in the presence of ATP or ADP. Inhibition studies demonstrated that Vi behaves as non-competitive inhibitor of both the wild-type BLM fragment and R979A; Vi presumably inhibits the two proteins by similar inhibition mechanisms. By contrast, mutant R982A was insensitive to Vi in the presence of ATP or ADP. The inability of the mutant R982A to form the transition state analogue MgADP–Vi–Protein provides firm evidence that a major role of the guanidinium group of R982 is to stabilize the catalytic transition state, and failure to do so in this mutation accounts for the loss or reduction of ATP hydrolysis. This interpretation is also consistent with the atomic resolution structures of other SF1 and SF2 helicases such as PcrA and E. coli RecQ (8,10). Although both R287 and R610 in PcrA interact with the γ-phosphate of ATP, the two arginine residues contribute differently to stabilizing the transition state. Two guanidinium amine groups of R287 can interact with the oxygen atoms on the γ-phosphate group, but only one guanidinium amine group of R610 can interact with the oxygen atoms. The configuration of the guanidinium amine group of R610 is not optimal for stabilizing the negative charge that develops in the transition and post-transition state during ATP hydrolysis. Dittrich and Schulten (34) showed that it is R287, but not R610, that acts as an arginine finger. Structural comparison of the positions of R979 and R982, relative to ATP-binding sites, with the arginine residues R287 and R610 in PcrA reveals that R979 is more structurally similar to R610 in PcrA (Figure 1B). Therefore, this second arginine residue, R979, does not contribute greatly to stabilizing the transition state. Residue R979, similar to residue R610 in PcrA, may be important for the initial binding of ATP to the catalytic site and for stabilizing the hydrolysis product state (34).
Our findings also shed new light on the question of how ATP and DNA binding activate the ATPase activity, and on the mechanism transmitting chemical energy from ATP hydrolysis to DNA unwinding. For most phosphoryl transferases, the intrinsic nucleotide hydrolysis activity is low or undetectable and needs to be activated by a separate protein/residue or other ligand. Arginine residues are crucial for many enzyme phosphoryl-transfer reactions. In the absence of DNA, the distances between the putative arginine finger and the γ-phosphate of ATP are more than 3.5 Å, RecQ and our BLM model. Such distances are quite far for the guanidinium groups of the arginine finger to interact with the γ-phosphate group. However, in PcrA helicase, ATP and DNA binding result in the closure of the cleft between domains 1A and 2A. This also positions the R287 guanidinium groups to polarize the γ-phosphate group, thereby increasing the susceptibility of the phosphorus atom to a nucleophilic attack. Although no X-ray crystal structures are available for RecQ and BLM or other RecQ family helicases in complex with ATP and DNA, these enzymes may share these properties with PcrA.
Our studies also help form a mechanistic picture of how the arginine finger is precisely positioned in relation to the γ-phosphate through the conserved motifs that stabilize the transition state complex. Both residues R979 and R982 of motif VI (equivalent to R326 and R329 in E. coli RecQ) are on the loop connecting α-helix 14 and β-strand 13 (Figure 1C). This loop may be highly mobile and can assume multiple side chain positions due to the thermal fluctuation of the protein. The crystal structure of E. coli RecQ helicase reveals that the precise spatial arrangements of both residues R326 and R329, relative to γ-phosphate of the nucleotide, may be further positioned through a complex network of interactions between motifs II, V and VI. In the BLM model, the α-helix 14 may be spatially restricted by the interactions between Q975 of motif VI and H798 and/or H805 of motif II, thereby stabilizing the positions of both residues R979 and R982. The spatial positions of R982 may be further determined through the hydrogen bonds between R959 and D983. This proposed salt bridge would further contribute to the positioning of motif VI, thereby precisely positioning residues R979 and Q975. The importance of the interaction between R959 and D983 for enzymatic activity has been demonstrated in an analysis of polymorphism R834C in Werner syndrome protein (WRN). Residue R834 of WRN, which is equivalent to R959 in BLM, may form two side-chain hydrogen bonds with D858 of WRN (corresponding to D983 in BLM) (35). This interaction will further stabilize the residue R857, which probably acts as an arginine finger in WRN. Substitution of the residue R834 results in lower than wild-type ATPase, helicase and helicase-coupled exonuclease activities (35). Similarly, alteration of BLM R959 results in a substantial reduction in ATPase and helicase activities. Both mutants Q975V and H798A exhibit significant reduction in ATPase and helicase activities; altering Q975 leads to much more dramatic effect in enzymatic activity than H798 (the kcat decreases by 2880- and 17.6-fold for Q975V and H798A, respectively). Possibly, alteration of H798 does not completely abolish transit interaction between the two domains whereas alteration of Q975 does. Hydrogen bonds between Q975–H798 and between Q975–H805 may contribute to positioning the arginine finger upon binding ATP and DNA. It will be interesting to visualize and compare the precise locations and orientations of the putative arginine finger, as well as Q975 in an apo-enzyme and in the transition state, once the X-ray structure of the protein–ATP–DNA complex is elucidated.
In view of our findings, it is plausible that the arginine finger R982, coordinating with other residues clustered around the ATP-binding sites, senses ATP binding and hydrolysis and then transmits the signal for conformational changes. The cleft between domains 1A and 2A closes and, with the help of the various residues mentioned above, the arginine finger stabilizes the transition state, triggering ATP hydrolysis. After hydrolysis of ATP, the interactions between the guanidinium groups of the arginine finger and the γ-phosphate of ATP are lost. In this case, the interactions between other residues, for example Q975–H798 and Q975–H805, are not strong enough to keep the two domains close together and the enzyme returns to the initial state. RecQ family helicases may thereby couple ATP binding and hydrolysis to conformational changes and translocation along DNA as PcrA does.
Whether RecQ family helicases function as a monomer or hexamer has attracted great attention. Although BLM forms hexameric ring structure (36), the BLM6421290 fragment is a monomer and functions like the full-length BLM both in vivo and in vitro (29). Similarly, a fluorometric stopped-flow assay under optimal pre-steady-state conditions indicates that the oligomeric WRN functions as a monomer-unwinding duplex DNA substrates (37). If an arginine finger lies in the adjacent subunits of oligomeric ATPase such as T7 gene 4 helicase (17), replication factor C (18), Adeno-associated virus type 2 helicase (16) and the structural maintenance of chromosomes (SMC) ATPase (38), oligomerization must be absolutely required for ATPase activity for such proteins. While most oligomeric ATPases harbour an arginine finger in the adjacent subunits of the protein (16–18,38), the hexameric BLM protein possesses an arginine finger that is localized within two domains of a subunit as we revealed in this report. This structural feature may confer BLM an intrinsic ability to hydrolyse ATP as a monomer. Our data therefore provided a molecular structural explanation for BLM functioning potentially as a monomer.
ACKNOWLEDGEMENTS
This research was supported by the grant from the Institut National du Cancer to M.A.-G. and X.G.X., the National Natural Science Foundation of China, the Innovation Project of the Chinese Academy of Sciences. Part of this work was performed by HR and XGX in CNRS, UMR8113, ENS de Cachan, France. H.R. was supported by French government's scholarships. Funding to pay the Open Access publication charges for this article was provided by CNRS.
Conflict of interest statement. None declared.
REFERENCES
- 1.Lohman TM, Bjornson KP. Mechanisms of helicase-catalyzed DNA unwinding. Annu. Rev. Biochem. 1996;65:169–214. doi: 10.1146/annurev.bi.65.070196.001125. [DOI] [PubMed] [Google Scholar]
- 2.Soultanas P, Wigley DB. DNA helicases: ‘inching forward’. Curr. Opin. Struct. Biol. 2000;10:124–128. doi: 10.1016/s0959-440x(99)00059-7. [DOI] [PubMed] [Google Scholar]
- 3.von Hippel PH, Delagoutte E. A general model for nucleic acid helicases and their “coupling” within macromolecular machines. Cell. 2001;104:177–190. doi: 10.1016/s0092-8674(01)00203-3. [DOI] [PubMed] [Google Scholar]
- 4.Xi XG. Helicases as antiviral and anticancer drug targets. Curr. Med. Chem. 2007;14:883–915. doi: 10.2174/092986707780362998. [DOI] [PubMed] [Google Scholar]
- 5.Singleton MR, Dillingham MS, Wigley DB. Structures and Mechanism of Helicases and Nucleic Acid translocase. Annu. Rev. Biochem. 2007;176:23–50. doi: 10.1146/annurev.biochem.76.052305.115300. [DOI] [PubMed] [Google Scholar]
- 6.Singleton MR, Wigley DB. Modularity and specialization in superfamily 1 and 2 helicases. J. Bacteriol. 2002;184:1819–1826. doi: 10.1128/JB.184.7.1819-1826.2002. [DOI] [PMC free article] [PubMed] [Google Scholar]
- 7.Story RM, Steitz TA. Structure of the recA protein-ADP complex. Nature. 1992;355:374–376. doi: 10.1038/355374a0. [DOI] [PubMed] [Google Scholar]
- 8.Velankar SS, Soultanas P, Dillingham MS, Subramanya HS, Wigley DB. Crystal structures of complexes of PcrA DNA helicase with a DNA substrate indicate an inchworm mechanism. Cell. 1999;97:75–84. doi: 10.1016/s0092-8674(00)80716-3. [DOI] [PubMed] [Google Scholar]
- 9.Korolev S, Hsieh J, Gauss GH, Lohman TM, Waksman G. Major domain swiveling revealed by the crystal structures of complexes of E. coli Rep helicase bound to single-stranded DNA and ADP. Cell. 1997;90:635–647. doi: 10.1016/s0092-8674(00)80525-5. [DOI] [PubMed] [Google Scholar]
- 10.Bernstein DA, Zittel MC, Keck JL. High-resolution structure of the E.coli RecQ helicase catalytic core. EMBO J. 2003;22:4910–4921. doi: 10.1093/emboj/cdg500. [DOI] [PMC free article] [PubMed] [Google Scholar]
- 11.Rittinger K, Walker PA, Eccleston JF, Nurmahomed K, Owen D, Laue E, Gamblin SJ, Smerdon SJ. Crystal structure of a small G protein in complex with the GTPase-activating protein rhoGAP. Nature. 1997;388:693–697. doi: 10.1038/41805. [DOI] [PubMed] [Google Scholar]
- 12.Scheffzek K, Ahmadian MR, Kabsch W, Wiesmuller L, Lautwein A, Schmitz F, Wittinghofer A. The Ras-RasGAP complex: structural basis for GTPase activation and its loss in oncogenic Ras mutants. Science. 1997;277:333–338. doi: 10.1126/science.277.5324.333. [DOI] [PubMed] [Google Scholar]
- 13.Nadanaciva S, Weber J, Wilke-Mounts S, Senior AE. Importance of F1-ATPase residue alpha-Arg-376 for catalytic transition state stabilization. Biochemistry. 1999;38:15493–15499. doi: 10.1021/bi9917683. [DOI] [PubMed] [Google Scholar]
- 14.Rittinger K, Walker PA, Eccleston JF, Smerdon SJ, Gamblin SJ. Structure at 1.65 A of RhoA and its GTPase-activating protein in complex with a transition-state analogue. Nature. 1997;389:758–762. doi: 10.1038/39651. [DOI] [PubMed] [Google Scholar]
- 15.Abrahams JP, Leslie AG, Lutter R, Walker JE. Structure at 2.8 A resolution of F1-ATPase from bovine heart mitochondria. Nature. 1994;370:621–628. doi: 10.1038/370621a0. [DOI] [PubMed] [Google Scholar]
- 16.James JA, Escalante CR, Yoon-Robarts M, Edwards TA, Linden RM, Aggarwal AK. Crystal structure of the SF3 helicase from adeno-associated virus type 2. Structure. 2003;11:1025–1035. doi: 10.1016/s0969-2126(03)00152-7. [DOI] [PubMed] [Google Scholar]
- 17.Crampton DJ, Guo S, Johnson DE, Richardson CC. The arginine finger of bacteriophage T7 gene 4 helicase: role in energy coupling. Proc. Natl Acad. Sci. USA. 2004;101:4373–4378. doi: 10.1073/pnas.0400968101. [DOI] [PMC free article] [PubMed] [Google Scholar]
- 18.Johnson A, Yao NY, Bowman GD, Kuriyan J, O’Donnell M. The replication factor C clamp loader requires arginine finger sensors to drive DNA binding and proliferating cell nuclear antigen loading. J. Biol. Chem. 2006;281:35531–35543. doi: 10.1074/jbc.M606090200. [DOI] [PubMed] [Google Scholar]
- 19.Gai D, Zhao R, Li D, Finkielstein CV, Chen XS. Mechanisms of conformational change for a replicative hexameric helicase of SV40 large tumor antigen. Cell. 2004;119:47–60. doi: 10.1016/j.cell.2004.09.017. [DOI] [PubMed] [Google Scholar]
- 20.Soultanas P, Dillingham MS, Velankar SS, Wigley DB. DNA binding mediates conformational changes and metal ion coordination in the active site of PcrA helicase. J. Mol. Biol. 1999;290:137–148. doi: 10.1006/jmbi.1999.2873. [DOI] [PubMed] [Google Scholar]
- 21.Killoran MP, Keck JL. Sit down, relax and unwind: structural insights into RecQ helicase mechanisms. Nucleic Acids Res. 2006;34:4098–4105. doi: 10.1093/nar/gkl538. [DOI] [PMC free article] [PubMed] [Google Scholar]
- 22.Guo RB, Rigolet P, Zargarian L, Fermandjian S, Xi XG. Structural and functional characterizations reveal the importance of a zinc binding domain in Bloom's syndrome helicase. Nucleic Acids Res. 2005;33:3109–3124. doi: 10.1093/nar/gki619. [DOI] [PMC free article] [PubMed] [Google Scholar]
- 23.Dou SX, Wang PY, Xu HQ, Xi XG. The DNA binding properties of the Escherichia coli RecQ helicase. J. Biol. Chem. 2004;279:6354–6363. doi: 10.1074/jbc.M311272200. [DOI] [PubMed] [Google Scholar]
- 24.Avron M. Photophosphorylation by swiss-chard chloroplasts. Biochim. Biophys. Acta. 1960;40:257–272. doi: 10.1016/0006-3002(60)91350-0. [DOI] [PubMed] [Google Scholar]
- 25.Xu HQ, Deprez E, Zhang AH, Tauc P, Ladjimi MM, Brochon JC, Auclair C, Xi XG. The Escherichia coli RecQ helicase functions as a monomer. J. Biol. Chem. 2003;278:34925–34933. doi: 10.1074/jbc.M303581200. [DOI] [PubMed] [Google Scholar]
- 26.Zhang XD, Dou SX, Xie P, Wang PY, Xi XG. RecQ helicase-catalyzed DNA unwinding detected by fluorescence resonance energy transfer. Acta Biochim. Biophys. Sin. (Shanghai) 2005;37:593–600. doi: 10.1111/j.1745-7270.2005.00084.x. [DOI] [PubMed] [Google Scholar]
- 27.Liu JL, Rigolet P, Dou SX, Wang PY, Xi XG. The zinc finger motif of Escherichia coli RecQ is implicated in both DNA binding and protein folding. J. Biol. Chem. 2004;279:42794–42802. doi: 10.1074/jbc.M405008200. [DOI] [PubMed] [Google Scholar]
- 28.Ko YH, Bianchet M, Amzel LM, Pedersen PL. Novel insights into the chemical mechanism of ATP synthase. Evidence that in the transition state the gamma-phosphate of ATP is near the conserved alanine within the P-loop of the beta-subunit. J. Biol. Chem. 1997;272:18875–18881. doi: 10.1074/jbc.272.30.18875. [DOI] [PubMed] [Google Scholar]
- 29.Janscak P, Garcia PL, Hamburger F, Makuta Y, Shiraishi K, Imai Y, Ikeda H, Bickle TA. Characterization and mutational analysis of the RecQ core of the bloom syndrome protein. J. Mol. Biol. 2003;330:29–42. doi: 10.1016/s0022-2836(03)00534-5. [DOI] [PubMed] [Google Scholar]
- 30.Pezza RJ, Villarreal MA, Montich GG, Argarana CE. Vanadate inhibits the ATPase activity and DNA binding capability of bacterial MutS. A structural model for the vanadate-MutS interaction at the Walker A motif. Nucleic Acids Res. 2002;30:4700–4708. doi: 10.1093/nar/gkf606. [DOI] [PMC free article] [PubMed] [Google Scholar]
- 31.Dillingham MS, Soultanas P, Wigley DB. Site-directed mutagenesis of motif III in PcrA helicase reveals a role in coupling ATP hydrolysis to strand separation. Nucleic Acids Res. 1999;27:3310–3317. doi: 10.1093/nar/27.16.3310. [DOI] [PMC free article] [PubMed] [Google Scholar]
- 32.Zittel MC, Keck JL. Coupling DNA-binding and ATP hydrolysis in Escherichia coli RecQ: role of a highly conserved aromatic-rich sequence. Nucleic Acids Res. 2005;33:6982–6991. doi: 10.1093/nar/gki999. [DOI] [PMC free article] [PubMed] [Google Scholar]
- 33.Hall MC, Ozsoy AZ, Matson SW. Site-directed mutations in motif VI of Escherichia coli DNA helicase II result in multiple biochemical defects: evidence for the involvement of motif VI in the coupling of ATPase and DNA binding activities via conformational changes. J. Mol. Biol. 1998;277:257–271. doi: 10.1006/jmbi.1997.1614. [DOI] [PubMed] [Google Scholar]
- 34.Dittrich M, Schulten K. PcrA helicase, a prototype ATP-driven molecular motor. Structure. 2006;14:1345–1353. doi: 10.1016/j.str.2006.06.017. [DOI] [PubMed] [Google Scholar]
- 35.Kamath-Loeb AS, Welcsh P, Waite M, Adman ET, Loeb LA. The enzymatic activities of the Werner syndrome protein are disabled by the amino acid polymorphism R834C. J. Biol Chem. 2004;279:55499–55505. doi: 10.1074/jbc.M407128200. [DOI] [PubMed] [Google Scholar]
- 36.Karow JK, Newman RH, Freemont PS, Hickson ID. Oligomeric ring structure of the Bloom's syndrome helicase. Curr. Biol. 1999;9:597–600. doi: 10.1016/s0960-9822(99)80264-4. [DOI] [PubMed] [Google Scholar]
- 37.Choudhary S, Sommers JA, Brosh RM., Jr Biochemical and kinetic characterization of the DNA helicase and exonuclease activities of werner syndrome protein. J. Biol. Chem. 2004;279:34603–34613. doi: 10.1074/jbc.M401901200. [DOI] [PubMed] [Google Scholar]
- 38.Lammens A, Schele A, Hopfner KP. Structural biochemistry of ATP-driven dimerization and DNA-stimulated activation of SMC ATPases. Curr. Biol. 2004;14:1778–1782. doi: 10.1016/j.cub.2004.09.044. [DOI] [PubMed] [Google Scholar]