


Abstract
CpG methylation is a key component of the epigenome architecture that is associated with changes in gene expression without a change to the DNA sequence. Since the first reports on deregulation of DNA methylation, in diseases such as cancer, and the initiation of the Human Epigenome Project, an increasing need has arisen for a detailed, high-throughput and quantitative method of analysis to discover and validate normal and aberrant DNA methylation profiles in large sample cohorts. Here we present an improved protocol using base-specific fragmentation and MALDI-TOF mass spectrometry that enables a sensitive and high-throughput method of DNA methylation analysis, quantitative to 5% methylation for each informative CpG residue. We have determined the accuracy, variability and sensitivity of the protocol, implemented critical improvements in experimental design and interpretation of the data and developed a new formula to accurately measure CpG methylation. Key innovations now permit determination of differential and allele-specific methylation, such as in cancer and imprinting. The new protocol is ideally suitable for detailed DNA methylation analysis of multiple genomic regions and large sample cohorts that is critical for comprehensive profiling of normal and diseased human epigenomes.
INTRODUCTION
DNA methylation is an epigenetic modification of the genome, whereby a methyl group is covalently linked at position 5 of the cytosine pyrimidine ring (5-MeC), typically occurring in a 5′-CpG-3′dinucleotide context. These CpG sites are often concentrated in distinct areas of the genome called CpG islands (1). The DNA methylation state of CpG site(s) can affect the chromatin structure and transcriptional activity of the associated gene. In the past decade, it has become apparent that alterations in DNA methylation are not only linked to normal developmental processes, but also to many human diseases including cancer (2–8). Other human diseases with aberrant DNA methylation include the Beckwith–Wiedemann syndrome, the Prader–Willi syndrome and the Angelman syndrome, in which the mono-allelic methylation status (paternal or maternal) of a specific genomic region has been lost, also known as loss of imprinting (9). To unravel the mechanisms underlying these developmental and pathological changes in DNA methylation, an increasing need has arisen for an accurate and quantitative method for analysis. Moreover, the initiation of the Human Epigenome Project (HEP) has also highlighted the need for a high-throughput, high resolution and truly quantitative methods for DNA methylation profiling (10–13).
Many technologies have been developed for evaluating DNA methylation, reviewed in (14–18), but accurate and reproducible quantification of DNA methylation remains challenging and only a small subset of techniques is suitable for high-throughput applications and allele-specific methylation analysis. The ‘gold-standard’ for determining and quantifying the methylation state of a genomic region at single-nucleotide resolution is by sequence analysis after bisulphite conversion (19). This method relies on the ability of sodium bisulphite to efficiently deaminate cytosine residues to uracil in single-stranded DNA, under conditions where 5-MeC remains nonreactive. After PCR amplification all uracil and thymine residues have been amplified as thymine (T) and only 5-MeC residues have been amplified as cytosine (C). Subsequent sequencing of cloned PCR products gives detailed information on every CpG site in the amplified region. The main drawback is that clonal sequencing is costly and time consuming and depending on the heterogeneity of DNA methylation a large number of clones need to be sequenced for each PCR amplicon for accurate representation of the DNA methylation profile.
A novel approach for high-throughput DNA methylation based on MALDI-TOF mass spectrometry has been recently introduced (20–22). This method is based on a base-specific cleavage reaction combined with mass spectrometric analysis (MassCLEAVE™; Figure 1a). In brief, the method employs a T7-promoter-tagged PCR amplification of bisulphite-converted DNA, followed by generation of a single-stranded RNA molecule and subsequent base-specific cleavage (3′ to either rUTP or rCTP) by RNase A. The mixture of cleavage products differing in length and mass are analyzed by MALDI-TOF-MS. Differences in template DNA methylation profile will result in changes in nucleotide sequence after bisulphite treatment, which in turn will yield different fragment masses in the assay. The abundance of each fragment (signal/noise level in the spectrum) is indicative of the amount of DNA methylation in the interrogated sequence.
Figure 1.


MALDI-TOF-MS DNA methylation analysis. Overview of the MassCLEAVE™ assay. (A) Genomic DNA is bisulphite treated and PCR-tagged to include the T7 promoter sequence. As shown, either top or bottom strand can be used for amplification. Subsequent alkaline phosphatase (SAP) treatment, in vitro transcription using T7 R&DNA polymerase and a specific nucleotide mixture plus RNase A cleavage results in specific fragmentation. As exemplified, the top and bottom strands can have markedly different fragmentation patterns. The obtained mixture of fragments can be analyzed by MALDI-TOF-MS. Spectrum peaks representing methylated and unmethylated fragments are used to calculate methylation levels for every fragment. (B) In silico transcript fragmentation. The use of T- or C-cleavage mixtures on either the top or bottom strand of bisulphite-treated DNA can yield quite different fragmentation patterns. Here, the fragmentation of the CpG island of INHBB (chr2:119,998,230-119,998,596) is shown. CpG sites are represented by circles; white circle: methylation call will be obtained in the MassCLEAVE™ assay; crossed gray circle: methylation call will be missed, because fragments mass falls outside of spectral range of analysis; red diagonal line: approximate cleavage site; dotted line: combined methylation call due to overlapping peaks in spectrum. T-cleavage is more informative than C-cleavage when interrogating CpG islands due to RNaseA digestion after every CpG site in the C-cleavage reaction. (C) New schematic representation of DNA methylation data. Due to the specific fragmentation of a transcript, multiple CpG sites can be present within one fragment. Also, fragments with identical masses will show overlapping peaks in the MALDI-TOF-MS spectrum, resulting in a combined DNA methylation call. This new graphical representation of the DNA methylation incorporates all this information. The white circles represent the CpG sites that are analyzed in the MassCLEAVE™ assay. The crossed grey circles represent CpG sites that will be missed in the assay, and the red diagonal lines are the RNase A cleavage sites. The colored circles in the average view indicate the methylation calls given by the assay with the dashed lines linking these calls back to the CpG site(s) within the interrogated sequence. In the detailed view, the relative abundance of unmethylated, partially methylated, and fully methylated molecules is visualized as proportional bars for each fragment (white, gray and black bars, respectively). This view allows an in-depth graphical comparison of samples at the highest resolution possible.
In this article, we critically evaluate the accuracy, precision and sensitivity of the individual steps of the MassCLEAVE™ assay, address the success rate, determine its limitations and further improve the assay. We also compare CpG methylation quantitation obtained from mass spectrometry with clonal bisulphite sequencing methylation analysis. Based on our new findings, we demonstrate novel assays for: (i) allele-specific DNA methylation, (ii) extracting known and novel single-nucleotide polymorphism (SNP) data, and (iii) determining allelic-specific SNP-associated methylation levels.
MATERIALS AND METHODS
In silico fragmentation analysis for optimal assay design
In the Supplementary Data, we detail how an in silico fragmentation analysis (T-cleavage) can be performed on the target sequence for DNA methylation analysis using either the R-script (http://www.garvan.org.au/research/research-groups/epigenetics.html) ‘Amplicon Report Function’ (ARF) accompanying this article, or by manual calculation.
Calculation of DNA methylation state
The formula the MassCLEAVE™ software uses to calculate the DNA methylation level of fragments is as follows:
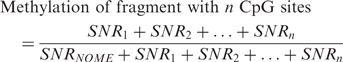 |
where SNR is the signal-to-noise ratio of either the unmethylated peak (NOME) or one of the methylated peaks (1, 2, …, n) associated with this fragment. It is important to note that the number associated with the methylated peaks does not denote a particular CpG site, but rather corresponds to the number of CpG sites methylated within the fragment (with n being all CpG sites of the fragment methylated). Therefore this formula produces biases when comparing fragments with different numbers of CpG sites. For a fragment with a single CpG site, the formula estimates the proportion of methylation at that one site. For fragments with more than one CpG site the formula estimates the proportion of fragments containing one or more methylated site(s). Therefore, fragments with higher numbers of CpG sites will tend to be biased towards higher ‘methylation levels’ as they have more chances of containing one or more methylated sites. We have derived a new measure of methylation that is not biased by the number of sites within the fragment, and incorporates the average methylation of each CpG site within a fragment. To calculate the average methylation level, we weight each SNR by the number of methylated CpG sites represented in that peak using the following new formula:
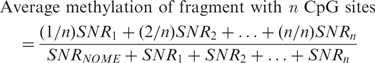 |
The R-script ‘Analyze Sequenom Function’ (ASF) accompanying this article, performs these calculations automatically. All the DNA methylation levels presented in this article have been recalculated based on this new formula.
Samples
Sample collection and genomic DNA isolation has been described in detail previously (23). Briefly, fresh-frozen tissue samples were collected from colorectal carcinomas as well as matched adjacent normal colonic mucosa, and DNA extractions were performed using the TRIZOL reagent (Invitrogen). Enzymatically methylated (SssI treated) gDNA (Chemicon International) and blood gDNA (Roche human gDNA) were obtained commercially.
Bisulphite-converted clones for precision and accuracy measurements
Previously bisulphite-converted, PCR-amplified, cloned (pGEM-T Easy Vector, Promega) and sequence-verified constructs were used as starting material for purely methylated or unmethylated sequences (23). These constructs were generated for all three amplicons interrogated (the CpG islands of EN1, SCTR and INHBB), and the target sequences were again PCR amplified separately for both methylated and unmethylated products, using the primers and conditions as depicted in Supplementary Table 1. The PCR products were analyzed via agarose gel electrophoresis and the concentration was determined using the BioAnalyzer 2100 (Agilent). Known ratios of completely methylated and unmethylated PCR product (0, 5, 10, 25, 50, 75, 90, 95 and 100% methylation) were mixed and either analyzed immediately in a T7 transcription-RNase A digestion reaction, followed by a MALDI-TOF-MS analysis (referred to as direct analysis), or analyzed following an extra PCR step (referred to as PCR + analysis). For the in silico analysis of the 20 tumor suppressor genes, described in Supplementary Table 2, we designed primers and target regions using MethPrimer (24).
Genomic bisulphite treatment
The bisulphite reaction was performed on 2 μg of DNA for 16 h at 55°C under conditions as previously described (19,25).
Clonal bisulphite sequencing for the comparison with the MassCLEAVE™ results
For the clonal genomic bisulphite sequencing, three independent PCR reactions were performed on bisulphite-treated DNA from the clinical samples and the products were pooled, purified using the Wizard PCR DNA purification system, and cloned into the pGEM-T Easy Vector (Promega). Approximately 12 individual clones were sequenced from the pooled PCR reactions using the Dye Terminator cycle sequencing kit with AmpliTaq DNA polymerase, FS (Applied Biosystems) and the automated 373A NA Sequencer (Applied Biosystems). Primer sequences can be found in Supplementary Table 1. To allow a comparison with the MassCLEAVE™ assay, the pooled PCR results were used in a re-PCR to enable a T7-tagging of the PCR product prior to the transcription/digestion and subsequent MALDI-TOF-MS analysis described subsequently.
PCR-tagging and in vitro transcription
The target regions were amplified using the primer pairs and annealing temperatures (Ta) described in Supplementary Table 1. The PCR reactions were carried out in a total volume of 5 μl using 200 nM forward and reverse primer, 200 μM dNTPs, 1.5 mM MgCl2 and 0.35 U Platinum Taq DNA polymerase (Invitrogen) in 1× PCR buffer without magnesium. The PCR amplification was performed as described in the Supplementary Table 1. Unincorporated dNTPs were dephosphorylated by incubation at 37°C for 20 min in the presence of 1.7 μl H2O and 0.3 U Shrimp Alkaline Phosphatase (Sequenom, San Diego), followed by a heat-inactivation for 5 min at 85°C. Two microliters of this SAP-treated PCR mixture were used as template in a 7 μl transcription reaction, containing 3.14 mM DTT, 2.5 mM dCTP, 1 mM rUTP, 1 mM rGTP, 1 mM rATP, 20 U T7 R&DNA polymerase (Epicentre, Madison, WI, USA) and 0.09 mg/ml RNase A in 0.64× T7 polymerase buffer (all reagents from Sequenom, San Diego). Transcription and digestion were performed simultaneously at 37°C for 3 h. After the addition of 20 μl H2O, conditioning of the phosphate backbone prior to MALDI-TOF MS was achieved by the addition of 6 mg CLEAN Resin (Sequenom, San Diego). Further experimental details have been described elsewhere (26).
MALDI-TOF-MS measurements
Twenty-two nanoliters of the cleavage reactions were dispensed (nanodispenser) onto silicon chips preloaded with matrix (SpectroCHIPs; Sequenom, San Diego). Mass spectra were collected using a MassARRAY mass spectrometer (Bruker–Sequenom). Spectra were analyzed using proprietary peak picking and signal-to-noise calculations.
Calculation of methylation ratios
Calculation of the DNA methylation levels was based on the new formula described in this article, and performed using the R-script ‘Analyze Sequenom Function’ (ASF): see Supplementary Data. All statistical calculations were carried out using either Stata 9 (StataCorp LP, Texas, USA) or the free ‘R’ software package for statistical computing (http://www.R-project.org).
RESULTS
In silico design and analysis of target sequence
When designing a Sequenom® MassCLEAVE™ assay for DNA methylation analysis, one of the first steps is selection of the genomic region of interest to interrogate if the PCR amplified sequence is informative for MALDI-TOFF analysis. Consideration of CpG density and specific CpG sites required to be analyzed are critical in determining the exact position of the PCR target sequence. The MassCLEAVE™ assay uses a specific rNTP/dNTP nucleotide mixture together with T7 R&DNA polymerase, which allows incorporation of both types of nucleotides. The subsequent RNase A digestion results in a specific fragmentation pattern, as the RNase A enzyme only cleaves 3′ of every incorporated rCTP and rUTP residue; the enzyme does not recognize dCTP or dTTP. In the MassCLEAVE™ kit, the T-cleavage kit contains dCTP, rUTP, rGTP and rATP and the C-cleavage kit contains a mixture of dTTP, rCTP, rGTP and rATP resulting in a unique cleavage 3′ of only the rCTP or rUTP, respectively. For this reason, the C-cleavage kit will not be as informative for CpG-rich DNA, such as CpG islands, as every methylated or unmethylated CpG site after bisulphite treatment is cleaved by the RNase A enzyme and many small uninformative fragments are generated. Therefore only the T-cleavage kit was used in this study.
In silico RNase A digestion of a target region will not only determine which PCR target sequence to amplify, but also will identify which DNA strand will result in the most informative CpG sites for methylation analysis. There a number of reasons that CpG sites fail to be informative and these include: (i) The MALDI-TOF-MS MassCLEAVE™ software has a default useable mass window of 1500–7000 Da and fragments that fall outside this window will not be analyzed; (ii) Within one fragment, multiple CpG sites may reside which will be analyzed jointly, resulting in reduced resolution; (iii) In rare cases, fragments may also have the exact same nucleotide composition, and thus will overlap in the mass spectrum. Since a bisulphite PCR is strand-specific (either top or bottom strand is used as a template) (19), different fragmentation profiles will also be strand-specific from the same genome sequence (Figure 1b). Ideally, all CpG sites are analyzed individually and fall within the spectral range of analysis, but in reality, a choice has to be made for the most informative DNA strand to amplify and best cleavage mixture to use. In the Supplementary Data, we explain how an in silico fragmentation can be performed using a new R-script we developed, called ‘Amplicon Report Function’ (ARF). We have applied ARF to 20 well-known tumor suppressor genes, reviewed by Esteller, 2002 (27), to demonstrate the utility of this function in assessing the target region prior to experimentation (Supplementary Table 2). We also present a more accurate schematic of the MassCLEAVE™ fragmentation of a target sequence that will aid substantially in interpretation of the methylation results. The schematic incorporates the relative position of each CpG site, which sites will be missed (due to the limited spectral range of analysis), which sites will be analyzed together in one fragment, and which fragments will have overlapping masses. Moreover, in the detailed view of the epigram, information is presented on the number of CpG sites that are methylated within each fragment (Figure 1c).
Precision and accuracy of Sequenom® DNA methylation assay
To critically analyze the practical aspects of the MassCLEAVE™ procedure, we looked at the individual steps of the protocol (Figure 1a). The two most important measures of robustness of a quantitative measurement procedure are precision (reproducibility) and accuracy (true value). To address the precision and accuracy of the MassCLEAVE™ technology, and more specifically, of the steps after PCR amplification in the assay (Figure 1a), we used cloned DNA fragments that had previously been bisulphite converted, PCR amplified, cloned, sequenced and verified as fully methylated or unmethylated sequences, as templates to amplify PCR control products from the CpG island promoters of Engrailed-1 (EN1), secretin receptor (SCTR) and inhibin beta B (INHBB) (23). Known ratios of the fully methylated and unmethylated PCR products were mixed (0, 5, 10, 25, 50, 75, 90, 95 and 100%) and either (i) analyzed immediately in a T7 transcription-RNase A digestion reaction, followed by a MALDI-TOF-MS analysis (referred to as direct analysis, hereafter) or (ii) analyzed following an extra PCR step (referred to as PCR + analysis, hereafter). These latter PCR + analysis samples more closely resemble the Sequenom® MassCLEAVE™ procedure since, after bisulphite conversion, a PCR step is always needed for the amplification and T7 promoter tagging. All reactions were performed in five replicates and analyzed individually. The results for EN1 are presented here; all data for SCTR and INHBB are given as Supplementary Data files.
Precision in the detection of DNA methylation levels
In both the direct analysis and the PCR + analysis experiment, most cleaved fragments obtained from the three individual gene targets (EN1, SCTR, INHBB) reveal remarkably consistent methylation levels, with standard errors not larger than 0.175 (median 0.011; Figure 2a and Supplementary Figures 2 and 3). The methylation calls with the lowest precision appear to be for fragments with a mass below ∼1700 Da (fragments left of the dashed vertical line in each panel of Figure 2a), indicating that these data points should be disregarded and the lower boundary of the spectral range settings should be increased from the default value (1500 Da) to 1700 Da.
Figure 2.

Accuracy and precision of MassCLEAVE™ DNA methylation detection in EN1 CpG island. The reproducibility and quantitation of different CpG methylation levels were assessed using MassCLEAVE™ technology (A) We measured the DNA methylation calls according to the MassCLEAVE™ technology, but using ASF (Supplementary Data). Known input ratios of completely methylated and unmethylated DNA fragments (referred to as 0, 5, 10, 25, 50, 75, 90 or 100% methylated input DNA; panels from upper left to lower right, respectively) were either analyzed immediately in a T7 transcription-RNase A digestion reaction, followed by a MALDI-TOF MS analysis (direct analysis, gray bars), or analyzed following an extra PCR step (PCR + analysis, black bars). For each panel, the methylation calls are arranged per fragment in an increasing mass order (x-axis) and the measured methylation ratios (y-axis) are given as means + SEM of five replicate measurements. The dotted vertical line indicates the 1700 Da threshold, and the horizontal dotted lines represent the input methylation levels. (B) Accuracy of DNA methylation calls by MassCLEAVE™ and PCR-induced bias. The left panel shows the mean DNA methylation calls of fragments with a mass over 1700 Da (y-axis) plotted against the input levels (x-axis), revealing a high correlation between input and output levels. The right panel shows the difference between the assay output and the known input (error) versus the input DNA methylation levels, revealing a small but consistent bias. The data for the direct analysis is plotted as a grey line and the data for PCR + analysis is shown as a dashed black line. Data are given as means + SEM of five replicate measurements. Similar accuracy and precision data for SCTR and INHBB CpG islands are given as Supplementary Data files.
Accuracy of the detection of DNA methylation levels in the direct analysis
We then investigated the accuracy of DNA methylation calls of fragments with a mass over 1700 Da. In general, the DNA methylation levels detected in the direct analysis revealed a very high correlation with the input methylation levels for all three targets (Figure 2b and Supplementary Figures 2 and 3; EN1: r2 = 0.98; SCTR: r2 = 0.99; INHBB: r2 > 0.99). However, we observed a small but consistent bias when analyzing fully unmethylated (0%) or fully methylated (100%) input samples; the MassCLEAVE™ technology consistently measured a small (2.5–5%) increase or decrease in methylation levels, respectively, in all the amplicons analyzed. When analyzing the methylation calls separately for all fragments, again we observed the least accurate data for fragments below 1700 Da, which could show either unjustly high or low methylation levels (Figure 2a and Supplementary Figures 2 and 3). Therefore, for both precision and accuracy reasons, the lower threshold of the spectral range should be increased to ∼1700 Da.
Accuracy bias introduced by the PCR amplification step
All bisulphite-based DNA methylation analysis methods, including clonal sequencing and MassCLEAVE™, require a PCR amplification step following the bisulphite conversion of DNA. We therefore tested whether an accuracy bias is introduced at this step by performing a PCR on the methylated/unmethylated DNA mixes followed by the T7 transcription-RNase A digestion and MALDI-TOF-MS analysis (PCR + analysis). For all three amplicons, at very low and high methylation input levels we found a bias in methylation levels towards the under-represented copy (Figure 2b and Supplementary Figures 2 and 3), a similar bias was reported previously (17); input samples with methylation ⩽0.25 were always given an elevated call, whereas input samples with methylation ⩾0.5 were given a deflated call. The bias was consistently more pronounced at high methylation levels (maximum bias −0.09, −0.20 and −0.20 for EN1, SCTR and INHBB, respectively) than at low methylation levels (maximum bias +0.05, +0.09, +0.09 for EN1, SCTR and INHBB, respectively). Since this bias is not observed in the direct analysis, this effect is most likely introduced by the PCR amplification step.
Next, we determined how instructive the assay was in detecting small differences in input methylation levels, based on the results of the PCR + analysis experiment. In the cases where we could compare a 5% difference in input methylation levels (0–5%, 5–10%, 90–95% and 95–100%), we were able to detect a significant difference in methylation calls in 77% of the situations (95 out of 124 fragments interrogated). A 10% input difference was detected significantly in 92% of the cases (57 out of 62 fragments; input levels of 0–10% and 90–100%; two-tailed Wilcoxon rank-sum test, P < 0.05).
Minimal amount of template for transcription and MassCLEAVE™ analysis
We determined how robust the MassCLEAVE™ technology is by measuring the minimal amount of PCR product necessary for a successful DNA methylation analysis. We prepared for all three amplicons a dilution series of a 50% methylated PCR mixture ranging from 80 down to 2.5 nM and used these as template in the T7 transcription-RNase A digestion step and subsequent MALDI-TOF-MS analysis (Figure 3a and Supplementary Figures 4 and 5). At the lowest concentration tested (2.5 nM), a considerable number of replicates failed to generate detectable fragments with distinctive signal-to-noise ratios in the spectrum (Figure 3b and Supplementary Figures 4 and 5). However, even at this concentration, the methylation calls that were made were reasonably accurate (maximum error = 0.086, median 0.047; Figure 3c and Supplementary Figures 4 and 5). It should here be noted that a reduction of concentration of the EN1 template resulted in a small increase in average methylation level, whereas the reverse correlation was observed for the INHBB amplicon. Thus, variations in PCR yield should be kept to a minimum and useful mass spectrums will be obtained with at least ∼5 nM of template.
Figure 3.

Template dilution test for transcription and subsequent MALDI-TOF analysis. The minimal amount of PCR template required for accurate quantitation of DNA methylation was determined. (A) A twofold dilution series was prepared from T7-tagged PCR amplifications of EN1 CpG island (50/50% mixture of fully unmethylated and fully methylated PCR product), ranging from 80 to 2.5 nM, and 5 μl of each dilution was visualized on an agarose gel. Adjacent marker lanes contain 500 ng pBR322 digested with HinFI. (B) Two microliters of the dilution series was used in the transcription-RNase A digestion reaction and subjected to MALDI-TOF MS analysis, in five technical replicates. The ratio of detected versus expected fragments with CpG sites was determined in all spectra and are presented as individual bars for each analysis. (C) The average methylation calls ratios calculated from the detected peaks in the spectra are shown as means + SEM. The dotted horizontal line represents the actual methylation level used as input. Similar template dilution studies for SCTR and INHBB CpG island regions are given as Supplementary Data files.
Variability due to bisulphite conversion and PCR
We next determined how much variability in DNA methylation levels would be introduced by the bisulphite treatment of genomic DNA (gDNA) and by the subsequent PCR amplification of this single-stranded bisulphite-treated DNA. A mixture of 25% enzymatically methylated gDNA in a background of unmethylated DNA was bisulphite converted and CpG island containing regions of the EN1, SCTR and INHBB genes were PCR-amplified in triplicate. This entire procedure was repeated three times to be able to interrogate the contribution of bisulphite treatment to the variability in the measurements. We first analyzed the variability generated by the PCR step on the same bisulphite-treated genomic DNA by assessing three different PCR amplifications. After calculation of the methylation calls for the different fragments, the standard errors for three PCR replicates on the same bisulphite-treated gDNA ranged from 0.02 to 0.09 for EN1 (median 0.04); from 0.00 to 0.07 for SCTR (median 0.02); and from 0.07 to 0.21 for INHBB (median 0.11; Figure 4a and Supplementary Figures 6 and 7). To assess the variability due to the bisulphite step, we averaged the methylation calls of the three PCR reactions on the same bisulphite-treated gDNA for each fragment to remove the influence of the PCR in the call and then compared these methylation calls for the three different bisulphite treatments. Surprisingly, the standard errors of the methylation calls for three different bisulphite treatments were smaller than those caused by the PCR, and ranged from 0.02 to 0.05 for EN1 (median 0.03), from 0.01 to 0.02 for SCTR (median 0.02) and from 0.01 to 0.04 for INHBB (median 0.03; Figure 4b and Supplementary Figures 6 and 7), indicating that the PCR step introduces more variability in the methylation calls than the bisulphite treatment.
Figure 4.

Variability in DNA methylation quantitation. Methylation variability due to bisulphite conversion or PCR amplification was evaluated. (A) In three independent experiments, a mixture of 25% enzymatically methylated gDNA and 75% blood gDNA (generally unmethylated) was bisulphite treated in triplicate and EN1 CpG island PCR-amplified in triplicate. The mean + SEM results are graphed per bisulphite conversion (BSC) and per fragment. The numbers below the graph indicate which CpG sites are interrogated together in the respective fragment and the numbering of the sites is according to the position in amplicon. The point (.) between numbers indicates adjacent CpG sites present within one fragments, whereas the equals to sign (=) is indicative of CpG sites that are part of different fragments, but analyzed together because of identical fragment masses. The variability in the methylation calls shown in this graph is caused by PCR amplification of bisulphite-treated single-stranded DNA. (B) To be able to interrogate the variability introduced by the bisulphite conversion, we calculated the average methylation calls of the triplicate PCR reactions on the same bisulphite-treated gDNA, and used these values to graph the DNA methylation calls per fragment obtained from three independent bisulphite conversions. Similar variability studies for SCTR and INHBB CpG island regions are given as Supplementary Data files.
SYBR Green incorporation facilitates high-throughput analysis of PCR success
A crucial step in the Sequenom® DNA methylation analysis is the PCR amplification, as a successful PCR is likely to result in a good MALDI-TOF-MS spectrum and thus in an accurate determination of the DNA methylation status of the fragments. The current recommendation (28) for confirmation of a successful PCR is an agarose gel-based analysis. However, the MALDI-TOF-MS analysis uses chips that analyze 384 samples in one assay, which demands for a rapid screening technique to address the PCR success. We, therefore, determined if SYBR Green-based melt curve analysis would be preferable as a high-throughput screen for PCR success and whether SYBR Green interferes with the downstream transcription and RNase A digestion and subsequent MALDI-TOF-MS analysis. We found that the melt-curve analysis after the PCR amplification step allowed a rapid analysis of the presence or absence of PCR products and at the same time gave global information on the methylation status of the samples based on the melting temperature of the product (Figure 5a and Supplementary Figures 8 and 9).
Figure 5.

SYBR Green melt curve analysis to determine PCR success. SYBR Green PCR melt curve analysis and its compatibility with the MassCLEAVE™ assay was assessed. (A) The use of SYBR Green in the PCR reaction enables a rapid screening for a successful amplification. Here, typical results of a completely methylated (red line), a completely unmethylated (green lines) and a no template control (blue line) PCR of EN1 CpG island are shown. Rapid screening using SYBR Green PCR melt curve analysis also yields information on the global methylation state of the region interrogated (i.e. a temperature shift in the position of the peak in the melt curve, indicated by the two-headed arrow). (B) A comparison of a MassCLEAVE™ analysis with or without SYBR Green for EN1 CpG island (solid blue line or dashed black line, respectively) revealed similar results, indicating that SYBR Green does not influence the methylation calling in the assay. Similar studies for SCTR and INHBB CpG island regions are given as Supplementary Data files.
We tested the influence of SYBR Green on the transcription reaction, RNase A cleavage and subsequent MALDI-TOF-MS analysis. To this end, we added SYBR Green to PCR products derived from mixtures of enzymatically methylated gDNA in a background of unmethylated DNA (mixes of 0, 25 and 100% methylated gDNA) and compared the results with samples lacking SYBR Green. We found no indication that the addition of SYBR Green influenced the methylation calling (Figure 5b and Supplementary Figures 8 and 9). All three target regions revealed similar DNA methylation levels regardless of the presence or absence of SYBR Green; statistical analysis of the methylation calls for each fragment with or without SYBR Green did not reveal any significant differences (Wilcoxon rank-sum; P < 0.05). Therefore, we conclude that addition of SYBR Green to the PCR does not significantly affect the MassCLEAVE™ assay and permits a high-throughput validation of PCR success prior to mass spectrometry.
Comparison of MassCLEAVE™ with clonal bisulphite sequencing
A critical question that has not as yet been addressed is how accurate the MassCLEAVE™ procedure is in quantifying DNA methylation levels when compared to clonal bisulphite sequencing analysis. To examine this, we performed a clonal bisulphite analysis of PCR fragments derived from the three CpG island target regions (EN1, SCTR and INHBB) from six clinical samples; three colorectal tumor and matched normal samples). Bisulphite-converted DNA was PCR amplified in triplicate and pooled, and the pooled PCR products were either cloned and 10 clones sequence verified or the pooled PCR products were T7-PCR-tagged and analyzed using the MassCLEAVE™ protocol (Figure 6). To enable a comparison between the results of both techniques, we converted the clonal sequencing data into the Sequenom output format per fragment. Although the results are not completely identical, there appears to be considerable agreement between DNA methylation levels detected by clonal sequencing and MassCLEAVE™ assay. The discrepancy in the results is most likely caused by the fact that (only) 10 clones were interrogated in the clonal analysis, which may not be fully representative for the total pool of molecules present. On the other hand, the clonal sequencing data gives more detailed information at the level of single CpG sites and at the level of actual distribution of the methylation signals over individual molecules (i.e. cells).
Figure 6.

Comparison of DNA methylation quantitation by MassCLEAVE™ and clonal bisulphite sequencing. Three samples of colorectal tumor and matched normal tissue were analyzed for the DNA methylation status of the CpG islands of EN1, SCTR or INHBB. In each graph panel, the colored line (either red for tumor or green for matched normal) represents the results obtained from the MassCLEAVE™ assay (triplicate assays). The dashed black line is derived from the clonal bisulphite sequencing results shown under each graph; the binary data (either methylated or unmethylated) of 10–11 clones was combined according to the fragmentation pattern in the MassCLEAVE™ assay. The CpG sites corresponding to fragments are indicated by the connecting lines under the graphs (gray lines for adjacent sites and pink lines for non-adjacent sites). The DNA methylation levels appear similar in both assays, indicating the robustness of both techniques. Asterisks indicate MassCLEAVE fragments with a mass below 1700 Da. White and black circles represent unmethylated and methylated CpG sites, respectively, and ‘A’ (red) depicts a polymorphism for rs2244213. The MassCLEAVE data for INHBB in patient 9-tumor have not been determined.
Analysis of regions for allelic-specific DNA methylation by MALDI-TOF-MS
Allelic-specific DNA methylation, where one allele is methylated and the other allele is unmethylated commonly occurs in normal cells such as in genes on the X-chromsome (X-inactivation) and in differentially methylated regions (DMRs) located near imprinted genes. Differential methylation of one allele and not the other can also occur in aging and in cancer where a CpG island promoter is aberrantly methylated and the gene inactivated while the active allele remains unmethylated. The standard technique to analyze allelic-specific or differential methylation is by clonal bisulphite sequencing in which two distinct populations can be detected that are similar in size (approximately equal number of fully methylated and unmethylated sequences). We adapted the MassCLEAVE™ assay design and analysis to allow the detection of two pools of DNA methylation states in one sample (Figure 7a). In the MassCLEAVE™ spectrum, this causes a depletion of peaks representing partially methylated fragments. By selecting a transcript fragmentation pattern that is enriched in fragments containing more than one CpG site this unique peak pattern can be visualized most clearly. For example, in an imprinted region only two peaks in the spectrum should be representing each fragment: one for the fully methylated allele and one for the fully unmethylated allele. The presence of additional peaks would indicate a loss of imprinting (Figure 7a). Although the results from such a MassCLEAVE™-based imprinting assay differ from traditional clonal bisulphite sequencing results, in that information is obtained for only small genomic fragments at a time (Figure 7b), the combined results of the MassCLEAVE™ assay still allows a high-throughput analysis of the imprinting status of larger genomic regions.
Figure 7.

Analysis of allele-specific methylation levels. Allele-specific methylation levels of GNAS and H19/IGF2 imprinted regions using MassCLEAVE™ assay was determined. (A) Hypothetical MALDI-TOF spectrum section for a differentially methylated imprinted region. The three CpG sites present in this fragment can give rise to four different peaks, depending on the methylation status of each individual CpG site. In an imprinted region, one allele is completely methylated and the other allele completely unmethylated, therefore only two peaks of equal signal-to-noise ratio should be present, representing both alleles. (B) Theoretical comparison of the DNA methylation analysis of an imprinted region using either clonal bisulphite sequencing or MassCLEAVE™ approach (for an explanation of schematic assay, see Figure 1c). Both assays can discriminate between imprinted and non-imprinted regions. (C) Example of SNP discovery using the MassCLEAVE™ assay. An unexpected peak distribution was obtained in the MALDI-TOF-MS analysis of the imprinted control region of the GNAS cluster on chromosome 20 (chr20:56,859,080-56,859,449). Analysis of the composition of the novel peak revealed the presence of a novel SNP (deposited as ss71641550 [A/T]). The fragmentation of this region associated the polymorphism with the methylation status of the neighboring CpG site, allowing an allele-specific methylation call for this site (the black or white circles represent methylated or unmethylated CpG sites, respectively). (D) Example of simultaneous SNP genotyping and analysis of the allele-specific methylation status. Four different genomic samples were analyzed for the imprinting status of the imprinted control region of the H19/IGF2 cluster (chr11:1,977,509-1,977,914) using the MassCLEAVE™ assay and revealed the SNP status for rs10732516. Since the fragment containing this polymorphism also contains one or three CpG sites, the methylation status associated with the neighboring CpG sites could be deduced simultaneously. Note that the peaks for the A allele of rs10732516 overlap with the peaks of another fragment (CpG7) resulting in increased peak heights.
MALDI-TOF-MS for analysis of polymorphisms linked to allele-specific DNA methylation status
Polymorphisms in the DNA sequence analyzed can be a significant problem in the MassCLEAVE™ assay. The presence of SNPs in the target region may cause a mass shift in the spectrum or even a different fragmentation pattern, which can easily lead to a misinterpretation of the results. The Epityper™ software does not allow the interrogation of SNPs and can only analyze the fragmentation pattern of a single sequence entered per spectrum. However, if a SNP is causing an altered peak pattern after bisulphate treatment and amplification, it can also be used for a high-throughput analysis of the allelic distribution of this SNP in your sample cohort and even be exploited for the analysis of the allele-specific methylation status. To illustrate this, we interrogated the fragmentation pattern of the imprinted control region of the GNAS cluster on chromosome 20q13.32 using the MassCLEAVE™ assay. When we analyzed the spectrum, we observed an unusual peak distribution for one of the transcript fragments (Figure 7c). After sequencing validation, we discovered this distribution to be caused by the presence of a novel genomic SNP in the region (an A/T substitution at position chr20:56,859,403[-]; deposited in the SNP database as ss71641550). This A to T substitution changed the transcription fragment (in antisense orientation) CRCCAAACAACCT into ACRCCAAACCT, resulting in a 329 Da mass increase for this fragment. After detailed analysis of the MassCLEAVE™ results of 192 Australian Caucasian individuals, the T allele appeared to have an allele frequency of 8.3% in a cohort of Australian Caucasian individuals (32 out of 384 alleles tested). As a second example, we interrogated in silico the fragmentation pattern of the imprinted control region of the H19/IGF2 cluster on chromosome 11 using our R-script ARF for all the SNPs known within the amplified region. We found a differential fragmentation pattern between the alleles of the SNP rs10732516 (A/G). The actual analysis of the DNA methylation status of this region in a number of healthy control samples using the MassCLEAVE™ assay indeed revealed the presence or absence of these peaks in the spectrum (Figure 7d). Moreover, since we analyzed an imprinted region in both examples, we were able to directly deduce the DNA methylation status of the neighboring CpG site(s), which allows the identification of the methylated and unmethylated allele (either paternal or maternal). Therefore we conclude that the MassCLEAVE™ assay can also be exploited for SNP discovery, rapid SNP genotyping and quantitative allele-specific methylation analysis.
DISCUSSION
Over the last decade, the rapidly expanding interest in the involvement of DNA methylation in developmental mechanisms and human diseases has highlighted the need for an accurate, quantitative and high-throughput assay for DNA methylation screening. Recently, a MassCLEAVE™ assay has been developed using a MALDI-TOF-MS-based analysis of base-specific fragmentation patterns after bisulphite conversion (20). This assay provides the potential for fast, quantitative screening of detailed methylation patterns using automated procedures in large patient cohorts. In this article, we have critically assessed this procedure and present significant improvements of the MassCLEAVE™ assay and experimental design that now enables this technology to be exploited for detailed analysis of genome methylation patterns including allelic-specific methylation.
One of the first critical steps in the MassCLEAVE™ assay is in the design and location of the target sequence to be amplified as this determines the number of CpG sites that will be informative for accurate methylation analysis. To enable a prior assessment of each target sequence, we developed a new formula, called ‘the Amplicon Report Function’ (ARF) that calculates the correct average methylation levels of fragments that contain more than one CpG site, using a weighting of the partially methylated peaks in the MALDI-TOF spectrum. ARF enables a comprehensive in silico analysis of the fragmentation pattern of any target sequence to analyze how informative a region will be and whether it is recommended to design the assay from either the top or bottom strand of the DNA, as this will yield different fragmentation patterns. Different questions will require different sequence options: for example, it is preferential to have as few CpG sites per fragment in the methylation analysis of CpG islands, whereas more than one CpG site per fragment is optimal for analysis of imprinted regions to determine allelic-specific methylation.
In optimization of the MassCLEAVE™ assay, we replaced the time-consuming agarose gel analysis of PCR success with a rapid SYBR Green PCR melt curve analysis. PCR melt curve analysis permits a high-throughput screen for PCR amplification without any further sample manipulations; this is essential in any high-throughput assay. Furthermore, we have shown that the inclusion of SYBR Green in the assay did not affect the accuracy or precision of the assay, and the success of a MassCLEAVE™ analysis of DNA methylation is only limited by the success of the PCR amplification. We assessed the precision and accuracy of the MassCLEAVE™ technology and found that for fragments below ∼1700 Da the calibration is not optimal, as peak position is not always called correctly. This is compounded by the fact that fragments below this mass commonly contain only a small number of nucleotides (<6 nucleotides), thereby increasing the likelihood of overlapping fragments with the same composition. We, therefore, recommend that the lower boundary of the spectral range be increased from the default value of 1500–1700 Da to ensure more precise and accurate methylation calls.
We next performed a detailed analysis of all steps in the MassCLEAVE™ assay, to determine which steps of the procedure introduced the most variability in the measurement of CpG methylation and found that it was the PCR amplification of the bisulphite-treated genomic DNA. This is similar to previous findings (29,30), but it is in contrast to what has been published very recently (31), where most of the variability in the measurement was attributed to the bisulphite treatment. However, in that study the analysis of the variability was not separated into the individual assay steps, hence most variability was observed in the earliest steps of the protocol. We recommend that in the MassCLEAVE™ assay, the PCR step should be replicated at least three times to obtain reliable results and that each PCR fragment is analyzed separately or pooled prior to analysis. In cases where very large cohorts need to be analyzed, and the inclusion of this many replicates is not an option, it is recommended to at least pool multiple PCR reactions prior to downstream methylation analysis to minimize this PCR-induced variability. In the results presented here, we were able to consistently detect a 5% difference in input DNA methylation level with the transcription/digestion and MALDI-TOF-MS analysis in 77% of the situations tested. We, therefore, conclude that this technique will generally allow the detection of methylation difference down to ∼5%.
Since the MassCLEAVE™ assay is designed for high-throughput quantitative methylation assessment across genomic regions it is critical that it is comparable to the current gold standard method in methylation analysis, clonal PCR bisulphite sequencing. As a comparison has not previously been reported we undertook a direct comparison of clonal PCR bisulphite sequencing and the MassCLEAVE™ methylation assay on colorectal tumor and matched normal tissue samples. We obtained highly comparable results in levels of DNA methylation at informative CpG sites, with the caveat that clonal analysis permits interrogation of each individual CpG site in the regions interrogated, whereas the MassCLEAVE™ assay only examines the average methylation data per cleavage fragment. However, the MassCLEAVE™ assay is highly quantitative, whereas the clonal sequencing analysis is easily biased by the limitation in the number of clones analyzed. The MassCLEAVE™ assay is clearly favorable in a high-throughput experiment as it is less time consuming and more cost-effective.
Other high-throughput methods for quantitative DNA methylation analysis have recently been described including pyrosequencing (32) and a bead-based analysis from Illumina (33). Pyrosequencing is a real-time DNA sequencing by synthesis method that can be used after bisulphite treatment for direct quantitative methylation analysis (14). The sensitivity of the method is similar to MALDI-TOF mass spectrometry (5%), but the main limitation of this method is the length of the sequence read and thereby the number of CpG sites that can be analyzed in one sequencing reaction (17,32). Bead-based array methylation analysis can be performed using multiplexing and is useful for DNA methylation of multiple genes simultaneously in large populations. This method can be sensitive down to less than 5% for some CpG sites but is also limiting in assessment of contiguous CpG sites (33).
One of the major advantages of the new adaptations we have implemented is the analysis of allelic-specific methylation such as imprinted genomic regions and differential methylation in cancer samples. Normally, differentially methylated imprinted regions show a bimodal and allele-specific methylation status; one allele is methylated and inactive, and the other is active and unmethylated. Changes in this pattern can cause imprinting diseases, such as the Beckwith–Wiedemann syndrome or the Prader–Willi syndrome (9). While bisulphite clonal sequencing (34) and some PCR and pyrosequencing-based approaches have already been reported for allelic-specific methylation analysis (35–37), allele-specific loss of methylation can also be visualized in the MassCLEAVE™ assay using a fragmentation pattern that is specifically selected for fragments containing multiple CpG sites. Similar to pyrosequencing (37), the MassCLEAVE™ assay permits a rapid and quantitative method of allele-specific DNA methylation analysis. Our R-script ARF allows a rapid selection of the optimal assay conditions when interrogating imprinted regions. Allelic-specific methylation can be further addressed if a sequence variation or SNP is present in the region interrogated. When the SNP is located in a fragment with one or more CpG sites, the allele-specific methylation status (and inheritance) of these sites can be addressed. However, in general, special care always needs to be taken for the presence of potential SNPs when using the Mass CLEAVE™ assay. Since no actual sequence information will be obtained from a MALDI-TOF spectrum, no direct validated warning can be given for a spectrum affected by the SNP and thus a misinterpretation can easily occur. However, with the initiation of the HapMap project and many other SNP genotyping analyses, new information will continue to be compiled on potential SNPs that lie within interrogated regions, and the R-script ARF we developed can address whether a certain SNP can cause a change in the (expected) spectrum.
In conclusion, we have made critical improvements to MassCLEAVE™ technology, enabling easy and informative assay designs that result in accurate and quantitative analyses of CpG methylation. We have shown that the MassCLEAVE™ assay is robust, with DNA methylation profiles comparable to clonal bisulphite sequencing, but unlike bisulphite sequencing, the method is quantitative and more suitable for high-throughput analyses of large sample cohorts. Our adaptations to the assay permit for the first time high-throughput methylation genomic profiling that provides information on both heterogeneous and allele-specific DNA methylation levels that is critical if we are to understand DNA methylation dynamics in normal and diseased states.
SUPPLEMENTARY DATA
Supplementary Data are available at NAR Online.
ACKNOWLEDGEMENTS
We would like to thank Jordi Frigola and Miguel Peinado (Hospital Duran i Reynals, Barcelona, Spain) for help with sample collection and PCR processing, Tom Koemans for technical assistance, Mathias Ehrich and Marijo Gallina (Sequenom, USA) for insight in the calculations used in the Epityper™ software. Funding for this work was provided by Australian National Health and Medical Research Council (NH&MRC) project grant (ID325622) and NH&MRC fellowship (S.J.C.). Funding to pay the Open Access publication charges for the article was provided by NH&MRC.
Conflict of interest statement. None declared.
REFERENCES
- 1.Gardiner-Garden M, Frommer M. Transcripts and CpG islands associated with the pro-opiomelanocortin gene and other neurally expressed genes. J. Mol. Endocrinol. 1994;12:365–382. doi: 10.1677/jme.0.0120365. [DOI] [PubMed] [Google Scholar]
- 2.Baylin SB, Ohm JE. Epigenetic gene silencing in cancer - a mechanism for early oncogenic pathway addiction? Nat. Rev. 2006;6:107–116. doi: 10.1038/nrc1799. [DOI] [PubMed] [Google Scholar]
- 3.Feinberg AP, Tycko B. The history of cancer epigenetics. Nat. Rev. 2004;4:143–153. doi: 10.1038/nrc1279. [DOI] [PubMed] [Google Scholar]
- 4.Jones PA, Baylin SB. The fundamental role of epigenetic events in cancer. Nat. Rev. 2002;3:415–428. doi: 10.1038/nrg816. [DOI] [PubMed] [Google Scholar]
- 5.Morgan HD, Santos F, Green K, Dean W, Reik W. Epigenetic reprogramming in mammals. Hum. Mol. Genet. 2005;14:R47–R58. doi: 10.1093/hmg/ddi114. [DOI] [PubMed] [Google Scholar]
- 6.Razin A, Shemer R. DNA methylation in early development. Hum. Mol. Genet. 1995;4:1751–1755. doi: 10.1093/hmg/4.suppl_1.1751. [DOI] [PubMed] [Google Scholar]
- 7.Reik W, Dean W, Walter J. Epigenetic reprogramming in mammalian development. Science. 2001;293:1089–1093. doi: 10.1126/science.1063443. [DOI] [PubMed] [Google Scholar]
- 8.Ting AH, McGarvey KM, Baylin SB. The cancer epigenome–components and functional correlates. Genes Dev. 2006;20:3215–3231. doi: 10.1101/gad.1464906. [DOI] [PubMed] [Google Scholar]
- 9.Robertson KD. DNA methylation and human disease. Nat. Rev. 2005;6:597–610. doi: 10.1038/nrg1655. [DOI] [PubMed] [Google Scholar]
- 10.Rakyan VK, Hildmann T, Novik KL, Lewin J, Tost J, Cox AV, Andrews TD, Howe KL, Otto T, et al. DNA methylation profiling of the human major histocompatibility complex: a pilot study for the human epigenome project. PLoS Biol. 2004;2:e405. doi: 10.1371/journal.pbio.0020405. [DOI] [PMC free article] [PubMed] [Google Scholar]
- 11.Jones PA, Martienssen R. A blueprint for a Human Epigenome Project: the AACR Human Epigenome Workshop. Cancer Res. 2005;65:11241–11246. doi: 10.1158/0008-5472.CAN-05-3865. [DOI] [PubMed] [Google Scholar]
- 12.Eckhardt F, Lewin J, Cortese R, Rakyan VK, Attwood J, Burger M, Burton J, Cox TV, Davies R, et al. DNA methylation profiling of human chromosomes 6, 20 and 22. Nat. Genet. 2006;38:1378–1385. doi: 10.1038/ng1909. [DOI] [PMC free article] [PubMed] [Google Scholar]
- 13.Esteller M. The necessity of a human epigenome project. Carcinogenesis. 2006;27:1121–1125. doi: 10.1093/carcin/bgl033. [DOI] [PubMed] [Google Scholar]
- 14.Ronaghi M, Uhlen M, Nyren P. A sequencing method based on real-time pyrophosphate. Science. 1998;281:363, 365. doi: 10.1126/science.281.5375.363. [DOI] [PubMed] [Google Scholar]
- 15.Fraga MF, Esteller M. DNA methylation: a profile of methods and applications. BioTechniques. 2002;33:632, 634. doi: 10.2144/02333rv01. 636–649. [DOI] [PubMed] [Google Scholar]
- 16.Laird PW. The power and the promise of DNA methylation markers. Nat. Rev. 2003;3:253–266. doi: 10.1038/nrc1045. [DOI] [PubMed] [Google Scholar]
- 17.Tost J, Schatz P, Schuster M, Berlin K, Gut IG. Analysis and accurate quantification of CpG methylation by MALDI mass spectrometry. Nucleic Acids Res. 2003;31:e50. doi: 10.1093/nar/gng050. [DOI] [PMC free article] [PubMed] [Google Scholar]
- 18.Clark SJ, Statham A, Stirzaker C, Molloy PL, Frommer M. DNA methylation: bisulphite modification and analysis. Nat. Protoc. 2006;1:2353–2364. doi: 10.1038/nprot.2006.324. [DOI] [PubMed] [Google Scholar]
- 19.Clark SJ, Harrison J, Paul CL, Frommer M. High sensitivity mapping of methylated cytosines. Nucleic Acids Res. 1994;22:2990–2997. doi: 10.1093/nar/22.15.2990. [DOI] [PMC free article] [PubMed] [Google Scholar]
- 20.Ehrich M, Nelson MR, Stanssens P, Zabeau M, Liloglou T, Xinarianos G, Cantor CR, Field JK, van den Boom D. Quantitative high-throughput analysis of DNA methylation patterns by base-specific cleavage and mass spectrometry. Proc. Natl Acad. Sci. USA. 2005;102:15785–15790. doi: 10.1073/pnas.0507816102. [DOI] [PMC free article] [PubMed] [Google Scholar]
- 21.Schatz P, Dietrich D, Schuster M. Rapid analysis of CpG methylation patterns using RNase T1 cleavage and MALDI-TOF. Nucleic Acids Res. 2004;32:e167. doi: 10.1093/nar/gnh165. [DOI] [PMC free article] [PubMed] [Google Scholar]
- 22.Gut IG. DNA analysis by MALDI-TOF mass spectrometry. Hum. Mutat. 2004;23:437–441. doi: 10.1002/humu.20023. [DOI] [PubMed] [Google Scholar]
- 23.Frigola J, Song J, Stirzaker C, Hinshelwood RA, Peinado MA, Clark SJ. Epigenetic remodeling in colorectal cancer results in coordinate gene suppression across an entire chromosome band. Nat. Genet. 2006;38:540–549. doi: 10.1038/ng1781. [DOI] [PubMed] [Google Scholar]
- 24.Li LC, Dahiya R. MethPrimer: designing primers for methylation PCRs. Bioinformatics. 2002;18:1427–1431. doi: 10.1093/bioinformatics/18.11.1427. [DOI] [PubMed] [Google Scholar]
- 25.Stirzaker C, Song JZ, Davidson B, Clark SJ. Transcriptional gene silencing promotes DNA hypermethylation through a sequential change in chromatin modifications in cancer cells. Cancer Res. 2004;64:3871–3877. doi: 10.1158/0008-5472.CAN-03-3690. [DOI] [PubMed] [Google Scholar]
- 26.Hartmer R, Storm N, Boecker S, Rodi CP, Hillenkamp F, Jurinke C, van den Boom D. RNase T1 mediated base-specific cleavage and MALDI-TOF MS for high-throughput comparative sequence analysis. Nucleic Acids Res. 2003;31:e47. doi: 10.1093/nar/gng047. [DOI] [PMC free article] [PubMed] [Google Scholar]
- 27.Esteller M. CpG island hypermethylation and tumor suppressor genes: a booming present, a brighter future. Oncogene. 2002;21:5427–5440. doi: 10.1038/sj.onc.1205600. [DOI] [PubMed] [Google Scholar]
- 28.Sequenom®. Quantitative methylation analysis application guide. Beta version. San Diego, CA: 2005. [Google Scholar]
- 29.Warnecke PM, Stirzaker C, Melki JR, Millar DS, Paul CL, Clark SJ. Detection and measurement of PCR bias in quantitative methylation analysis of bisulphite-treated DNA. Nucleic Acids Res. 1997;25:4422–4426. doi: 10.1093/nar/25.21.4422. [DOI] [PMC free article] [PubMed] [Google Scholar]
- 30.Ogino S, Kawasaki T, Brahmandam M, Cantor M, Kirkner GJ, Spiegelman D, Makrigiorgos GM, Weisenberger DJ, Laird PW, et al. Precision and performance characteristics of bisulfite conversion and real-time PCR (MethyLight) for quantitative DNA methylation analysis. J. Mol. Diagn. 2006;8:209–217. doi: 10.2353/jmoldx.2006.050135. [DOI] [PMC free article] [PubMed] [Google Scholar]
- 31.Ehrich M, Zoll S, Sur S, van den Boom D. A new method for accurate assessment of DNA quality after bisulfite treatment. Nucleic Acids Res. 2007;35:e29. doi: 10.1093/nar/gkl1134. [DOI] [PMC free article] [PubMed] [Google Scholar]
- 32.Tost J, El Abdalaoui H, Gut IG. Serial pyrosequencing for quantitative DNA methylation analysis. BioTechniques. 2006;40:721–722. doi: 10.2144/000112190. 724, 726. [DOI] [PubMed] [Google Scholar]
- 33.Bibikova M, Lin Z, Zhou L, Chudin E, Garcia EW, Wu B, Doucet D, Thomas NJ, Wang Y, et al. High-throughput DNA methylation profiling using universal bead arrays. Genome Res. 2006;16:383–393. doi: 10.1101/gr.4410706. [DOI] [PMC free article] [PubMed] [Google Scholar]
- 34.Warnecke PM, Mann JR, Frommer M, Clark SJ. Bisulfite sequencing in preimplantation embryos: DNA methylation profile of the upstream region of the mouse imprinted H19 gene. Genomics. 1998;51:182–190. doi: 10.1006/geno.1998.5371. [DOI] [PubMed] [Google Scholar]
- 35.Baumer A, Wiedemann U, Hergersberg M, Schinzel A. A novel MSP/DHPLC method for the investigation of the methylation status of imprinted genes enables the molecular detection of low cell mosaicisms. Hum. Mutat. 2001;17:423–430. doi: 10.1002/humu.1118. [DOI] [PubMed] [Google Scholar]
- 36.Sasamoto H, Nagasaka T, Notohara K, Ozaki K, Isozaki H, Tanaka N, Matsubara N. Allele-specific methylation analysis on upstream promoter region of H19 by methylation-specific PCR with confronting two-pair primers. Int. J. Oncol. 2004;25:1273–1278. [PubMed] [Google Scholar]
- 37.Wong HL, Byun HM, Kwan JM, Campan M, Ingles SA, Laird PW, Yang AS. Rapid and quantitative method of allele-specific DNA methylation analysis. BioTechniques. 2006;41:734–739. doi: 10.2144/000112305. [DOI] [PubMed] [Google Scholar]
Associated Data
This section collects any data citations, data availability statements, or supplementary materials included in this article.