Abstract
The incorporation of 7-deazaguanine modifications into DNA is frequently used to probe protein recognition of H-bonding information in the major groove of DNA. While it is generally assumed that 7-deazaguanine forms a normal Watson–Crick base pair with cytosine, detailed thermodynamic and structural analyses of this modification have not been reported. The replacement of the 7-N atom on guanine with a C–H, alters the electronic properties of the heterocycle and eliminates a major groove cation-binding site that could affect the organization of salts and water in the major groove. We report herein the characterization of synthetic DNA oligomers containing 7-deazaguanine using a variety of complementary approaches: UV thermal melting, differential scanning calorimetry (DSC), circular dichroism (CD), chemical probing and NMR. The results indicate that the incorporation of a 7-deazaguanine modification has a significant effect on the dynamic structure of the DNA at the flanking residue. This appears to be mediated by changes in hydration and cation organization.
INTRODUCTION
The reaction of DNA with electrophiles that bear significant cationic charge is qualitatively dependent on DNA sequence, as well as quantitatively dependent on the concentration and nature of the cations present (1–9). We have suggested that the differential reactivity is associated with the sequence-dependent electrostatic landscape (SDEL) that also drives the observed occupancy of inorganic cations associated with the major groove of DNA (10). Accordingly, there is a good correlation between monovalent cation occupancies (11) and DNA methylation at N7-G by N-methyl-N-nitrosourea (MNU) (10) where the methylating intermediate is a charged methanediazonium ion (CH3N2+) (4,12–16). In order to manipulate the SDEL, we have previously tethered ammonium ions in the major groove via alkyl linkages attached to the 5-position of pyrimidines (17,18). These cationic side-chains regioselectively inhibited DNA methylation in the major groove towards the 3′-direction. As is often the case with DNA modifications, the effect of these cationic side-chains on DNA structure and DNA methylation, turns out to be sequence-dependent. For example, when a 3-aminopropyl side-chain is attached to T8 in the self-complementary Drew–Dickerson dodecamer (DDD) (Figure 1), we observed that the cation was in the major groove near G10, possibly causing the DNA to be flexible or bent, the DNA duplex was thermodynamically destabilized relative to unmodified DNA and MNU-induced N7-G methylation at G2, G4 and G10 was reduced (10,19–21). Moving the attachment of the side-chain by one base pair to T7 caused the ammonium ion to point out into the solvent with no indication that the DNA was deformed. The DNA was stabilized relative to unmodified DNA and methylation by MNU was only reduced at G4 (10,20,21).
Figure 1.
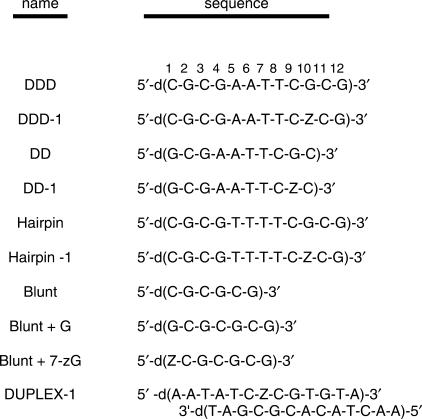
Names and sequences of 2′-oligodeoxynucleotides used in the studies (X = 7-deazaguanine).
In the current study, we have attempted to produce subtle changes in the SDEL by introducing a 7-deaza-G (7-zG) residue in place of G10 in DDD (Figure 1). The removal of the nitrogen lone pair electrons should reduce the electrostatic charge in the vicinity of a major groove site with high cation occupancy (11). The incorporation of 7-zG as a surrogate for G is often used as a way to dissect ligand–DNA interactions at G since removing the N7-nitrogen formally removes a potential H-bond acceptor site in DNA. Accordingly, reduction in binding of a ligand, including proteins, to DNA with the 7-zG substitution is interpreted to mean that ligand binding requires Hoogsteen H-bonding with the N7-position on G. Despite the use of 7-zG in numerous biophysical and structural studies (22–29), where it is assumed that it forms a ‘normal’ Watson–Crick base pair with C, only a limited number of studies of DNA with a 7-zG–C base pair have been reported (30,31). Herein, we show that there is a difference, as detected by calorimetric, chemical, UV and NMR studies, between 7-zG–C and G–C base pairs. The origin of the difference between 7-zG–C and G–C base pairs is discussed in terms of the fundamental role of major groove cations and water in the stabilization of the DNA architecture.
MATERIALS AND METHODS
Materials
All oligonucleotides (Figure 1) were synthesized in the University of Nebraska Medical Center Eppley Institute Molecular Biology Shared Resource, Omaha, NE, purified by reverse-phase HPLC, desalted on a G-10 Sephadex column, and lyophilized to dryness. The 7-zG was introduced as the phosphoramidite (Glen Research, Sterling, VA, USA). The on-column oxidation of the phosphite to phosphate when a 7-zG is present requires (1S)-(+)-(10-camphorsulfonyl)oxaziridine rather than I2 according to the manufacturer's protocols (Glenn Research, Sterling, VA, USA). The dry oligomers were then dissolved in the appropriate buffer.
The extinction coefficients of oligonucleotides were calculated in water from the tabulated values of the monomer and dimer nucleotides at 260 nm and 25°C (32). These values were then estimated in the random coil state at 80°C using a procedure reported earlier (33) and assuming similar extinction coefficients for 7-zG and G. We obtained molar extinction coefficients of (in mM−1 cm−1): 111 (dodecamers), 95 (decamers), 105 (hairpin loops), 52 (hexamer control) and 62 for the oligomers with a one base overhang.
The syntheses of the 2′-deoxy-3′,5′-bis(triisopropylsilyl) derivatives of C, G and 7-zG were performed based upon methods previously reported (34).
Temperature-dependent UV spectroscopy (UV melts)
UV melting curves were measured using a thermoelectrically controlled UV/Vis Aviv 14DS or a Lambda 40-Perkin Elmer spectrophotometer, interfaced to a PC computer for data acquisition and analysis. Absorbance at 260 and/or 275 nm was monitored as the temperature was scanned at heating rates of 0.75–1.00°C/min. Analysis of the shape of melting curves yields the transition temperature, TM, and van't Hoff enthalpies, HvH (35,36). Melting curves as a function of strand concentration, 7–70 μM, were obtained to check for the molecularity of each molecule. Additional melting curves were obtained as a function of salt and osmolyte concentration to determine the differential binding of counterions and water molecules that accompanies their helix coil transitions.
Circular dichroism
Circular dichroism (CD) measurements were conducted on an Aviv (model 202SF) CD spectrometer (Lakewood, NJ, USA). The spectrum of each duplex was obtained using a strain-free 1 cm quartz cell at low temperatures to ensure 100% duplex formation. Typically, 1 OD of a duplex sample was dissolved in 2 ml of a buffer containing 10 mM sodium phosphate (pH 7.0). The reported spectra correspond to an average of three scans from 220 to 350 nm at a wavelength step of 1 nm.
Differential scanning calorimetry
The heats for the temperature-unfolding reactions of the duplexes were measured using a VP-DSC differential scanning calorimeter (DSC) (Microcal, Inc., Northampton, MA, USA). The heat capacity profile for each DNA solution was measured against a buffer solution. The obtained experimental curve was normalized by the heating rate, and a buffer versus buffer scan subtracted using the program Origin version 5.0 (Microcal). In the case of multiple transitions, this software was used to deconvolute the transitions assuming that the temperature-dependent unfolding takes place through sequential independent transitions. The resulting curve for each transition is then integrated (∫Δ CpdT) and normalized for the number of moles, yielding the molar enthalpy (ΔHcal), which is independent of the nature of the transition (35,36). The molar entropy (ΔScal) is obtained by a similar procedure using ∫(Δ Cp/T)dT. The free energy at any temperature T is then obtained with the Gibbs equation:
| 1 |
Alternatively, these free energy terms were obtained using
| 2 |
that is rigorously true for monomolecular or hairpin transitions. However, both procedures yielded similar results.
Differential binding of counterions and water
The helical and coil states of an oligonucleotide are associated with a different number of bound ions and water molecules; therefore, their helix→coil transition is accompanied by a differential release (or uptake) of counterions, Δ nNa+, and water, Δnw. These two linking numbers are measured experimentally with the assumption that counterion or water binding to the helical and coil states of the oligonucleotide takes place with a similar type of binding using the following relationships (37):
 |
3 |
| 4 |
The first term in brackets,  , is a constant determined directly in DSC experiments, R is the gas constant; while the second term in parenthesis is also determined experimentally from its TM-dependence on the concentration of counterions and water, respectively. The numerical coefficients are derived from converting natural logs into decimal based logs. In addition, the 0.483 coefficient has an extra factor (0.9) for converting ionic activities into ionic concentrations.
In the determination of Δ nNa+, UV melts were measured in the salt range of 10–200 mM NaCl at pH 7; while in the determination of Δnw, UV melts were measured in the ethylene glycol concentration range of 0.5–4.0 m at pH 7 and 10 mM NaCl.: this co-solute does not interact specifically with DNA (38). The osmolalities of the latter solutions are obtained with a UIC vapor pressure osmometer Model 830 (Jolliet, IL, USA), which was calibrated with standardized solutions of NaCl. These osmolalities were then converted into water activities, aw, using the following equation (39):
| 5 |
where Osm is the solution osmolality and Mw is the molality of pure H2O, equal to 55.5 mol/kg H2O.
Chemical probes of DNA structure
DNA oligomers with or without the 7-zG modification were end-labeled with 32P[ATP] using T4 polynucleotide kinase (New England Biolabs, Ipswich, MA, USA). The 5′-32P-labeled DNA (with or without an excess of complementary strand) and 100 pM sonicated calf thymus DNA were incubated with THF-OOH in 10 mM sodium cacodylate buffer, 1 mM EDTA (pH 7.0) in a final reaction volume of 30 μl at 10°C for 1 h, and then heated at 90°C (pH 7.0) for 2 min (40,41). Incubations were stopped by cooling the reaction in ice and precipitation of the DNA by addition of NaOAc and cold EtOH. The precipitated DNA was washed with EtOH and dried in vacuo. The THF-OOH treated DNA was heated at 90°C for 15 min in 30 μl of 10 mM Tris, 1 mM EDTA buffer (pH 7.0) to convert THF-OOH induced lesions into abasic sites. The DNA was then precipitated, washed and dried. Precipitated DNA samples were taken up in 1 M piperidine (100 μl) and heated for 20 min at 90°C to generate strand breaks. After removal of piperidine in vacuo, the DNA was suspended in loading buffer (80% deionized formamide, 50 mM Tris–borate, pH 8.3, 1 mM EDTA) and denatured by heating at 90°C for 1 min, followed by cooling in ice. The DNA was electrophoresed on a 20% polyacrylamide denaturing gel (7.8 M urea) at 75 W (∼55°C). Standard Maxam–Gilbert G and G + A reaction lanes were included as sequence markers (42). The gel was then exposed to a phosphorimager screen and analyzed using a Molecular Dynamics Phosphorlmager (Sunnyvale, CA, USA). For control purposes, the unmodified or modified DNA were similarly treated but the addition of THF-OOH was omitted.
NMR studies
DDD and DDD-1 were heated to 90°C and then cooled to room temperature, and the duplex stoichiometry established by 1H NMR. The duplexes were dissolved in 0.5 ml of 10 mM NaH2PO4 buffer containing 0.1 M NaCl and 50 μM Na2EDTA (pH 7.0). The oligodeoxynucleotide concentrations were ∼0.9 mM. 1D NMR spectra for the exchangeable protons were recorded at 5, 15, 25, 35, 45 and 55°C in 1:9 D2O:H2O, using a field gradient Watergate pulse sequence for water suppression at a 1H NMR frequency of 600.20 MHz. Chemical shifts of proton resonances were referenced to water.
For structural studies, 1H NMR spectra were obtained at 500.13, 600.20 or 800.23 MHz. 1H NOESY experiments in D2O were conducted at 15°C. To obtain distance restraints, spectra were recorded at mixing times of 150, 200 and 250 ms, respectively, at the 1H NMR frequency of 800.23 MHz. The data were recorded with 1024 real data points in the t1 dimension and 2048 real points in the t2 dimension. The relaxation delay was 2 s. The data in the t1 dimension were zero filled to give a matrix of 2K × 2K real points. 1D spectra at different temperatures and NOESY spectra at 15°C for the exchangeable protons were recorded in 9:1 H2O:D2O, using the Watergate sequence (43) for water suppression at a 1H NMR frequency of 600.20 MHz. Chemical shifts of proton resonances were referenced to water. Double quantum-filtered 1H correlation (DQF-COSY) (44,45) and exclusive COSY (E-COSY) (46) spectra were collected at 25°C at 500.13 MHz and zero filled to give a matrix of 1024 × 2048 real points. A skewed sine-bell square apodization function with a 90° phase shift and a skew factor of 1.0 was used in both dimensions. 1H-31P HMBC spectra were obtained at 30°C (47). The data matrix was 256 (t1) × 2048 (t2) complex points. The data were Fourier transformed after zero filling in the t1 dimension, resulting in a matrix size of 512 (D1) × 2048 (D2) real points. Trimethyl phosphate was used as an external standard. NMR data were processed using the program FELIX2000 (Accelyris, Inc., San Diego, CA, USA) on Silicon Graphics (Mountain View, CA, USA) Octane workstations.
Experimental restraints
Distance restraints
Footprints were drawn around cross-peaks for the NOESY spectrum measured at a mixing time of 250 ms, using the program FELIX2000. Identical footprints were applied to the cross-peaks obtained at other mixing times. Cross-peak intensities were determined by volume integration. The intensities were combined with intensities generated from complete relaxation matrix analysis of a starting DNA structure to generate a hybrid intensity matrix (48). The program MARDIGRAS (v. 5.2) (49,50) was used to refine the hybrid matrix by iteration. The molecular motion was assumed to be isotropic. The noise level was set at half the intensity of the weakest cross-peak. Calculations were performed using DNA starting structures generated using the program INSIGHT II (Accelyris, Inc.), and NOE intensities derived from experiments at three mixing times, and with three Ic values (2, 3 and 4 ns), yielding 18 sets of distances. Analysis of these data yielded experimental distance restraints and SD used in restrained molecular dynamics calculations. For overlapped cross-peaks, the bounds on the distances were increased. The restraints were divided into four classes, reflecting the confidence level in the data.
Torsion angle restraints
Deoxyribose pseudorotations were estimated by monitoring the 3JHH couplings of sugar protons (51). The JH1′–H2′ and JH1′–H2″ couplings were measured from the E-COSY experiment (46), while the intensities of JH2″–H3′ and JH3′–H4′ couplings were determined from the DQF-COSY experiment. The data were fit to curves relating the coupling constants to pseudorotation (P), sugar pucker amplitude (ϕ), and the percentage S-type conformation. The pseudorotation and amplitude ranges were converted to the five dihedral angles ν0 to ν4.
Additional restraints
A symmetry distance restraint maintained pseudodyad symmetry. Empirical Watson–Crick hydrogen-bonding restraints were consistent with crystallographic data (52) and were similar to those previously used (53,54). Their inclusion was based on NMR data that showed the modified DNA maintained Watson–Crick base pairing. The backbone torsion angles α, β and ξ were constrained to −60° ± 30°, 180° ± 30° and −90° ± 30° to maintain A- or B-form, respectively (55).
Restrained molecular dynamics
Calculations were performed in vacuo using a simulated annealing protocol with the program X-PLOR (56). The force field was derived from CHARMM (57) and adapted for nucleic acids. The empirical energy function treated hydrogens explicitly. The van der Waals energy term used the Lennard–Jones potential energy function. The electrostatic term used the Coulomb function, based on a full set of partial charges (−1 per residue) and a distance-dependent dielectric constant of 4r. The non-bonded pair list was updated if any atom moved more than 0.5 Å, and the cutoff radius for non-bonded interactions was 11 Å. The effective energy function included terms describing distance and dihedral restraints, in the form of square-well potentials. Sets of rMD calculations for DDD-1 were initiated by coupling to a heating bath, with a target temperature of 1100 °K. The force constants were 25 kcal/mol/Å2 for empirical hydrogen bonding, 10 kcal/mol/Å2 for torsion angle restraints, and 50, 45, 40 and 35 kcal/mol/Å2 for the four classes of NOE restraints. The target temperature was reached in 10 ps and was maintained for 25 ps. The system was cooled to 288.15 °K over 10 ps and maintained at that temperature for 25 ps of equilibrium dynamics. The force constants for the four classes of NOE restraints were scaled during the 10 ps of the heating period to 200, 180, 160 and 140 kcal/mol/Å2, in the order of confidence factor. These weights were maintained during the remainder of the heating period and for the first 5 ps of equilibrium dynamics. They were then scaled to 100, 90, 80 and 70 kcal/mol/Å2 in the order of confidence factor. The torsion angle and base-pair distance force constants were scaled to 180 and 100 kcal/mol/Å2 during the same period as for the NOE restraints. They were scaled to 70 and 45 kcal/mol/Å2, also at the same time as the NOE restraints. Coordinate sets were archived every 0.1 ps, and 41 structures from the last 4.1 ps were averaged. These average rMD structures were subjected to 200 iterations of conjugate gradient energy minimization to obtain the final structures. The representative final structure of DDD-1 was compared to DDD (55).
NMR experiments to measure H-bonding of 2′-deoxynucleosides in CHCl3
The experimental design closely followed that previously described (34) using a 500 MHz instrument. A solution of the 2′-deoxy,3′,5′-bis(triisopropylsilyl)cytidine in anhydrous CHCl3 was mixed with 2′-deoxy,3′,5′-bis(triisopropylsilyl)guanosine or 2′-deoxy,3′,5′-bis(triisopropylsilyl)-7-deazaguanosine in anhydrous CDCl3 to give mixtures with mole fractions ranging from 100:0 to 0:100 while maintaining the same concentration of deoxynucleotides. The intensities and chemical shifts for the amino and imido protons on the pyrimidine and purine bases were monitored at room temperature.
RESULTS
Optical melting studies for 7-zG modified duplexes
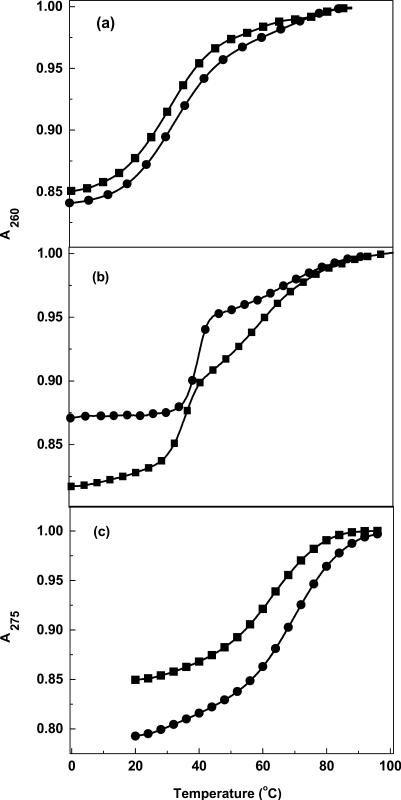
The UV melting experiments at 260 nm for DD and DD-1 (Figure 2a) reveal that both decamer duplexes at 10 mM NaCl unfold via a monophasic transition, while both dodecamers (DDD and DDD-1) unfold in broad biphasic transitions (Figure 2b). The dodecamers are self-complementary with 5′-CGCG runs at the termini; therefore, the overall melting behavior corresponds to duplex → hairpin and hairpin → random coil transitions, while the corresponding decamers, which form less stable hairpins, melt through a single duplex → random coil transition (Figure 2a). This is in excellent agreement with earlier unfolding measurements on related oligonucleotides (33,58,59). The second transition observed in the melt of DDD-1 and DDD reflects the hairpin to random coil transition. Shape analysis of the melting curves yielded the TM for each transition and, to a first approximation, the 7-zG substitution is destabilizing. It should be noted that the UV melt for DDD-1 is quite different from DDD and may reflect the rapid equilibration between duplex and hairpin structures. The UV melts of the hairpins with thymine loops show broad monophasic transitions (Figure 2c) with TM of 68.4°C (HPL) and 63.7°C (HPL-1), which is evidence that the incorporation of 7-zG → G substitution is destabilizing.
Figure 2.
UV melting curves in 10 mM sodium phosphate buffer (pH 7) ∼40 μM total strand concentration at 260 nm: (a) DD (filled circle) and DD-1 (filled square); (b) DDD (filled circle) and DDD-1 (filled square); at 275 nm for (c) HPL (filled circle) and HPL-1 (filled square).
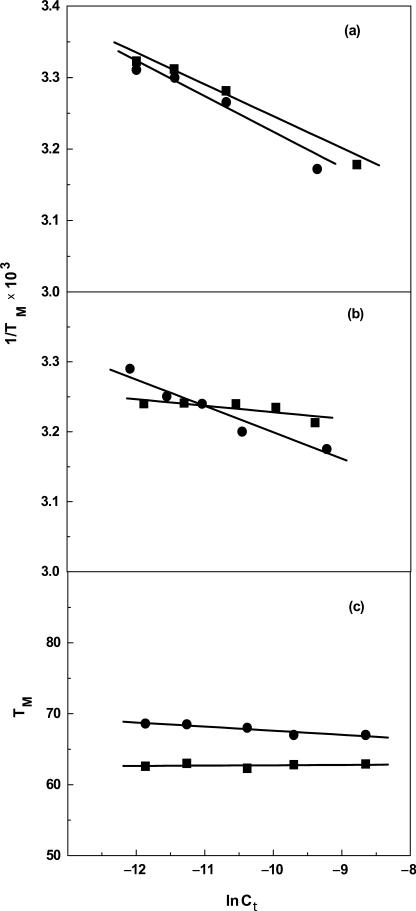
To confirm the molecularity of each transition, the helix-coil transitions for the oligonucleotides were measured over a 10-fold strand concentration range. The TM-dependences on strand concentration for each pair of molecules are shown in Figure 3a–c. In the case of the decamer (DD and DD-1) duplexes, there is one transition and the TM increases with strand concentration with similar slopes (Figure 3a), suggesting a duplex → random coil melting of the decamer duplexes. The TM of the first transition for DDD increased with increasing strand concentration; however, the TM of DDD-1 did not show a similar response. The TM for the second transition remained constant for both dodecamers, which is consistent with the formation of an intramolecular hairpin. These results confirm the sequential duplex → hairpin → random coil melting of each dodecamer duplex. The TM for the single transitions of the hairpin loops (HPL and HPL-1) remained constant, which is consistent with their intramolecular nature.
Figure 3.
TM dependence on strand concentration for duplexes in 10 mM sodium phosphate buffer (pH 7), 7–200 μM strand concentration for (a) DD (filled circle) and 7–350 μM strand concentration for DD-1 (filled square); 8–200 μM strand concentration for (b) DDD (filled circle) and DDD-1 (filled square); 7–200 μM strand concentration for (c) HPL (filled circle) and HPL-1 (filled square).
Table 1 shows the TM for each oligonucleotide at several salt concentrations obtained from the TM-dependence on strand concentration curves at a strand concentration of 10 μM. The TM of the modified DD-1 is ∼1.5°C lower than the unmodified (DD), and increases to 5°C at higher salt concentrations. For the dodecamers, the TM of the first transition of DDD-1 relative to DDD (unmodified) is ∼2°C higher in 16 mM Na+ (plain buffer) and an average of 6.5°C lower at higher salt concentrations. On the other hand, the 7-zG modified hairpin has a TM of 4°C lower than the TM of the unmodified hairpin, which is consistent with the destabilizing effect of 7-zG in high salt environments. The increase in salt concentration shifts the first duplex transitions to higher temperatures and becomes closer to the transitions of the hairpins. The overall destabilizing effect of 7-zG → G substitutions will be best explained in terms of their free energy contributions, which takes into account both TM and enthalpy contributions (see below).
Table 1.
Standard thermodynamic profiles for the formation of DNA complexes at 20°Ca
| Oligomer | NaCl (mM) | TM (°C) | ΔHcal (kcal/mol) | ΔG° (20 °C) (kcal/mol) | TΔScal (kcal/mol) | ΔnNa+ (mol−1 DNA) | Δnw (mol−1 DNA) |
|---|---|---|---|---|---|---|---|
| DDD | 10 | 33.3 | −116.0 | −6.9 | −109.0 | −2.3 ± 0.15 | −38.0 ± 2.0 |
| 100 | 57.7 | −109.5 | −15.5 | −94.0 | −1.8 ± 0.12 | −30.0 ± 2.0 | |
| 200 | 66.0 | −92.0 | −13.7 | −78.3 | −1.4 ± 0.09 | −24.0 ± 2.0 | |
| DDD-1 | 10 | 35.7 | −106.0 | −6.1 | −99.9 | −1.7 ± 0.13 | −22.0 ± 2.0 |
| 100 | 50.0 | −87.7 | −10.7 | −77.0 | −1.3 ± 0.10 | −16.0 ± 1.0 | |
| 200 | 60.8 | −82.0 | −11.7 | −70.3 | −1.1 ± 0.08 | −15.0 ± 1.0 | |
| DD | 10 | 29.5 | −80.1 | −5.6 | −74.5 | −2.2 ± 0.15 | −30.0 ± 4.0 |
| 100 | 53.0 | −72.3 | −8.2 | −64.1 | −1.7 ± 0.12 | −22.0 ± 3.0 | |
| DD-1 | 10 | 28.5 | −68.4 | −4.6 | −63.8 | −1.8 ± 0.15 | −21.0 ± 2.0 |
| 100 | 48.0 | −63.1 | −6.7 | −56.4 | −1.5 ± 0.12 | −16.0 ± 1.0 | |
| HPL | 10 | 68.4 | −31.0 | −4.4 | −26.6 | −0.26 ± 0.02 | −18.0 ± 2.0 |
| HPL-1 | 10 | 63.7 | −27.0 | −3.5 | −23.5 | −0.21 ± 0.02 | −15.0 ± 1.5 |
| Blunt | 1000 | 60.7 | −42.8 | −5.2 | −37.6 | – | – |
| Blunt+G | 1000 | 69.5 | −49.8 | −7.2 | −42.6 | – | – |
| Blunt+7-zG | 1000 | 68.7 | −50.9 | −7.3 | −43.7 | – | – |
aAll parameters are measured from UV (TM) and DSC melting curves in 10 mM sodium phosphate buffer (pH 7.0) using 10 μM DNA. The experimental uncertainties are as follows: TM (±0.5°C), ΔHcal (±3%), ΔG° (20) (±5%), TΔScal (±3%).
Differential scanning calorimetry for 7-zG modified duplexes
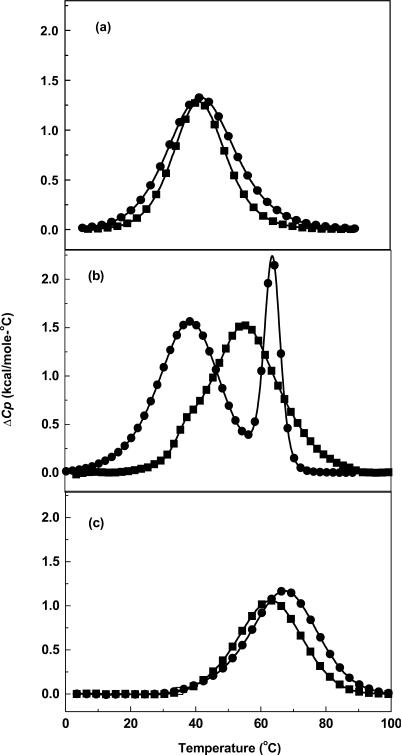
To better understand the stability effects seen in the thermal melting studies, DSC experiments on the same sets of paired molecules were performed over a range of salt concentrations. Typical excess heat capacity (ΔCp) versus temperature profiles in 10 mM buffer (Figure 4) indicate that the helix-coil transitions are biphasic for the dodecamer and monophasic for the decamers and hairpins, and take place without changes in the heat capacity of the initial and final states. For DDD, the first transition at low temperatures is broad, while the second transition at higher temperatures is sharper (Figure 4b). The DSC for DDD-1 affords a broad peak with a poorly resolved shoulder at lower temperatures. These heat capacity profiles at low salt concentrations confirm the UV melting studies and show that each dodecamer duplex follows a sequential melting of an initial duplex structure to hairpin at the lower temperatures, and to the final random coil state at the higher temperatures. Similarly, the decamers and hairpins unfold through a duplex to random coil transition confirming the UV melting data (Figure 4a).
Figure 4.
DSC curves in 10 mM sodium phosphate buffer (pH 7): (a) DD (filled circle) at ∼200 μM and DD-1 (filled square) at ∼350 μM; (b) DDD (filled circle) and DDD-1 (filled square) at ∼200 μM; (c) HPL (filled circle) and HPL-1 (filled square) at ∼200 μM strand concentration.
Analysis of the DSC scans at different salt concentrations of the single transitions of the decamers yielded similar endothermic enthalpy differences of 9–12 kcal/mol. This decrease in enthalpy is due to the introduction of two 7-zG residues in the decamer at 10 and 100 mM NaCl (Table 1). Furthermore, deconvolution at different salt concentrations of the two transitions for the dodecamers and integration of each peak yield endothermic enthalpies: 116 kcal/mol for DDD and a reduced unfolding enthalpy of 106 kcal/mol for DDD-1 (Table 1). At the higher salt concentrations, the ΔΔH remains near 10 kcal/mol for DDD versus DDD-1; however, at intermediate salt concentration this difference is 20 kcal/mol. The effects of salt concentration on the duplex/hairpin equilibrium in the dodecamer duplexes may be explained in terms of a better stabilization of the duplex state of DDD (relative to DDD-1) than their hairpin states, i.e. 12 versus 4 bp stems, as the salt concentration is increased. This effect disappears at 0.2 M NaCl because the concentration of hairpin is reduced and at the same time, the unfolding of the duplex is similar to that of the hairpin state. Moreover, in 10 mM buffer, the enthalpy difference for the hairpins is 4 kcal/mol, corresponding to the introduction of a single 7-zG residue.
The inclusion of two 7-zG modifications (one per strand) in DD-1 yielded a decrease in ΔG of 1.0 and 1.5 kcal/mol in 10 and 100 mM NaCl, respectively. The dodecamers also show a ΔΔG of ∼1 kcal/mol but this difference rises to 5 kcal/mol in 100 mM NaCl and drops to 2 kcal/mol in 200 mM NaCl. A similar trend is observed for the differences in the enthalpies in different ionic strengths. As mentioned above, the resolution of the first and second transitions for DDD-1 is poor, not allowing accurate measurements of the TM, unfolding enthalpies and free energies. Furthermore, the hairpins show a 1 kcal/mol decrease for the inclusion of a single modification in the modified hairpin.
Stacking of 7-zG
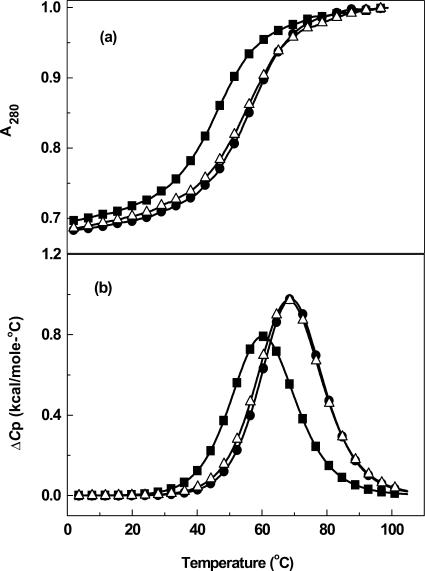
Although the surface areas for G and 7-zG are comparable (85 and 86 Å2, respectively), there is a significant difference in the MOPAC calculated dipoles, 4.312 and 6.499 Debye for 9-methyl-7-zG and 9-methyl-G, respectively. This could induce a reduction in local DNA stability at the 7-zG–C pairing due to a decrease in the ability of 7-zG to stack relative to G. To study this aspect of duplex stabilization (60), we prepared two constructs that have either a G (Blunt + G) or 7-zG (Blunt + 7-zG) as an overhanging base on the end of a blunt end duplex (Figure 1). The ΔΔH values of 7–8 kcal/mol (Table 1) for the oligomers with overhanging bases relative to the blunt end DNA reflect stabilization due to the stacking of the additional base (Figure 5). The stabilization in 1 M NaCl is observed in both the thermal melts (Figure 5a) and DSC (Figure 5b) experiments. However, both the dangling G and dangling 7-zG give virtually identical melting curves and ΔHcal's indicating that there is no significant difference between the stacking of G and 7-zG.
Figure 5.
(a) UV melting curves at 280 nm and (b) DSC of Blunt (filled square) and end-dangling Blunt + G (filled circle) and Blunt + 7-zG (open triangle) in 10 sodium phosphate buffer (pH 7.0) containing 1 M NaCl at a total strand concentration of ∼10 μM.
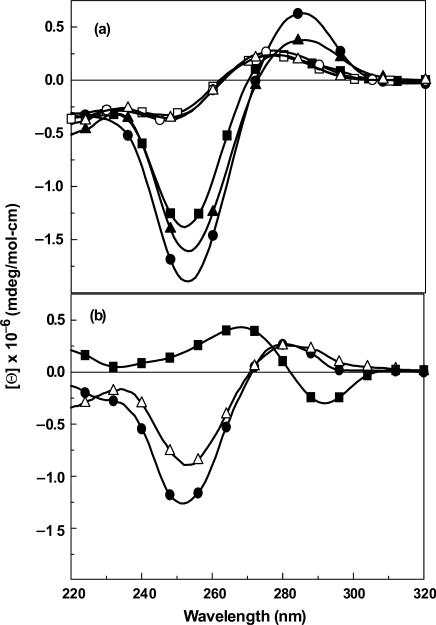
The CD spectra of Blunt, Blunt + G and Blunt + 7-zG were also obtained at 1 M NaCl (Figure 6a). All three duplexes are in the B-conformation, but the intensities of the negative band near 250 nm in the CD spectrum, which is related to base stacking, are different. The most intense signal is for the Blunt + G and the least intense for Blunt with the 7-zG overhang being intermediate. In contrast to our DSC data, this may indicate somewhat reduced stacking for the 7-zG base. Furthermore, the transition of the blunt duplex from B- to Z-DNA in 5 M NaCl is well-documented and is shown in Figure 6b. Interestingly, the G and 7-zG overhangs inhibit this salt-dependent conformational change. This reflects that both G and 7-zG stabilize the B-conformation by forming the initial stack of these duplexes at their 5′-terminus, which prevents the transition to Z-DNA.
Figure 6.
CD spectra using 20 μM strand concentration of (a) duplexes at 4°C and single-strand DNA at 90°C in 10 mM sodium phosphate buffer containing 1 M NaCl (pH 7.0): 4°C; ds-Blunt (filled square), ds-Blunt + G (filled circle) and ds-Blunt + 7-zG (open triangle) and 90°C; ss-Blunt (open square), ss-Blunt + G (open circle) and ss-Blunt + 7-zG (filled triangle) and (b) duplexes at 4°C in 10 mM sodium phosphate buffer containing 5 M NaCl (pH 7.0).
CD was also used to evaluate base-pair stacking in DDD-1 and DD-1 versus the unmodified duplexes. In comparing the 7-zG and G substituted duplexes, there is on the average a 15% decrease in the intensity of the 250 nm band in DDD-1 and DD-1 relative to DDD and DD, respectively (Figure 7). Although the differences in the CD intensities between the modified and the corresponding unmodified duplexes are relatively small, as would be expected since only 2 bp have been altered, they may suggest a decrease in stacking that is consistent with the decrease in the calorimetric enthalpy values for DD-1 and DDD-1 (Table 1).
Figure 7.
CD spectra of duplexes in 10 mM sodium phosphate buffer (pH 7) at 4°C, ∼10 μM strand concentration: (a) DD (filled circle), DD-1 (filled square); (b) DDD (filled circle), DDD-1 (filled square). The spectra marked by triangles are the spectra of the unmodified DD and DDD at 90°C.
Effect of 7-zG on H-bonding
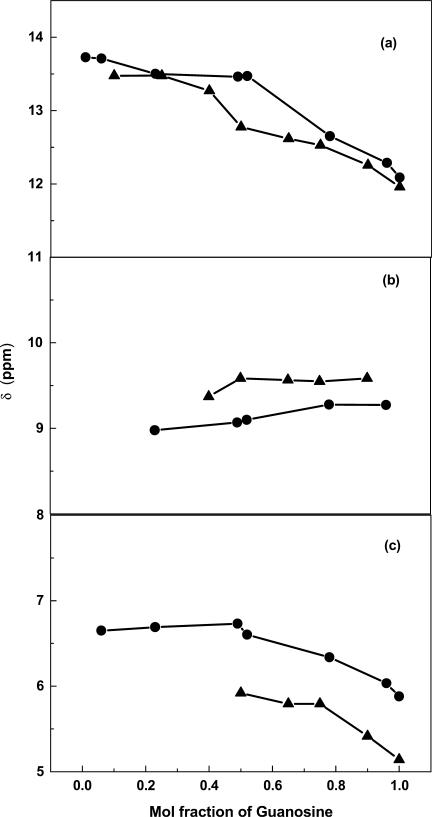
As mentioned above, the electronic nature of the 7-zG purine ring system is different than that of G. In order to experimentally evaluate the H-bonding properties of 7-zG relative to G, we prepared 3′,5′-bis(triisopropylsilyl) substituted 2′-deoxynucleoside analogs of C, G and 7-zG that afford sufficient solubility in a non-polar environment, such as CDCl3, under conditions that are essentially devoid of base stacking interactions (34). The 1H-NMR studies, at mole fractions up to 0.5:0.5, show that the silylated dG–dC and 7-z-dG–dC pairs have similar chemical shift changes for G-N1-H, C-N4-H2 and G-N2-H2 protons, which are indicative of H-bonding (Figure 8). Above the 0.5:0.5 mole fraction, there is a difference between the unmodified and modified deoxynucleosides (data not shown), but this is attributed to the ability of dG to form triplexes with dC–dG and self-associated G-quartets (34). The 7-zG cannot participate in these higher order structures due to the missing Hoogsteen H-bond acceptor site, and the failure of 7-zG to form higher order structures confirms the original interpretation of the NMR spectra of dC–dG in CDCl3 (34).
Figure 8.
Chemical shift changes upon mixing dC with increasing amounts of dG or 7-z-dG: (a) dG-H1–dC (filled circle) and 7-z-d G-H1–dC (filled triangle); (b) dG–dC-N4H2 (filled circle) and 7-z-d G–dC-N4H2 (filled triangle); (c) dG-N2H2–dC (filled circle) and 7-z-dG-N2H2–dC (filled triangle).
To determine whether we could detect any H-bonding difference between silylated dG–dC and 7-z-dG–dC as a function of temperature, the chemical shift changes for the G-N1-H, C-N4-H2 and G-N2-H2 protons were monitored in CDCl3 over a temperature range of 0–50°C. No differences between dG–dC and 7-z-dG–dC were observed for any of the H-bonding protons (data not shown). We conclude that the Watson–Crick base pairing is not directly altered by the 7-zG substitution, which is consistent with the NMR data detailed below for DDD and DDD-1.
NMR structure of DDD-1
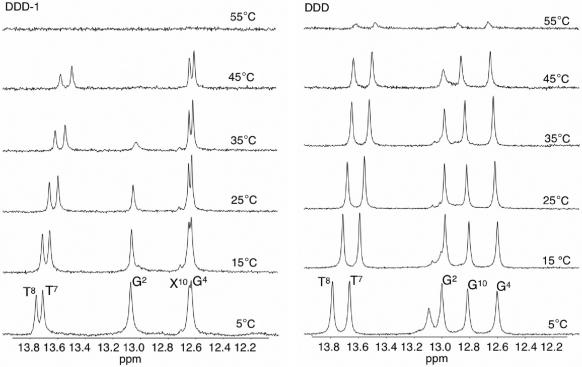
To understand if the thermodynamic instability of DDD-1 relative to DDD was due to a localized effect near the 7-zG–C pair, the imino proton region of the 1H-NMR spectra of DDD and DDD-1 were followed as a function of temperature (Figure 9). Surprisingly, the NMR spectra show that the N2-imino proton of the 7-zG10–C3 pair in DDD-1 behaves similar to the G10–C3 base pair in DDD, except for some increased line broadening at lower temperature. However, the G2–C11 imino proton of the flanking base pair is significantly broader by 25°C in DDD-1, almost baseline at 35°C and baseline at 45°C. The remaining peaks were also slightly broader at the lower temperatures in DDD-1 relative to the corresponding peaks in DDD. The above results suggest that the strength of the Watson–Crick base pairing at 7-zG–C is essentially maintained, but that there is a significant change in the exposure of the flanking G2–C11 base pair to the solvent.
Figure 9.
1H-NMR of imino proton resonances as a function of temperature for DDD-1 (left) and DDD (right).
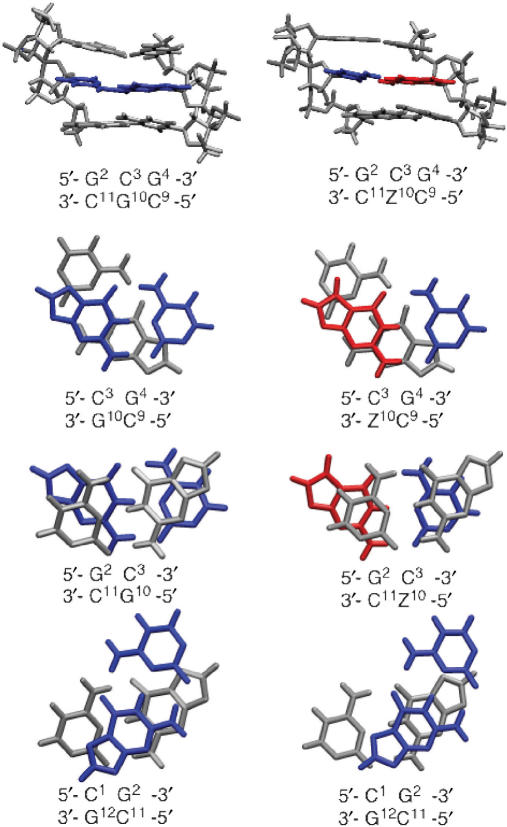
A more detailed analysis of the NMR spectra at 15°C, which at the salt concentration used is 30°C below the TM of DDD-1, involving distance and torsion angle constraints and base-pairing information, provides rMD calculated structures of DDD relative to DDD-1 (Figure 10). The results confirm that the stacking in the environment of the 7-zG–C is similar in the two oligomers: there is little difference between the G4–C9 and C3–7-zG10 stack in DDD-1 and the G4–C9 and C3–G10 stack in DDD (Figure 10). The stacking pattern of C3–7-zG10 and G2–C11 in DDD-1 relative to DDD, respectively, are marginally different. However, the reduction in overlap of the C3–7-zG10/G2–C11 base-pair stack in DDD-1 may not be significant due to the proximity to the terminus and the low number of NOEs used to model the structure.
Figure 10.
Stacking arrangement of bases in DDD (left) and DDD-1 (right) based on NMR refinement at 15°C: red, 7-zG; blue, C3 complementary to 7-zG10 or G10; gray, bases flanking C3–G10 or C3–zG10.
Chemical footprinting of a 7-zG–C base pair in DNA
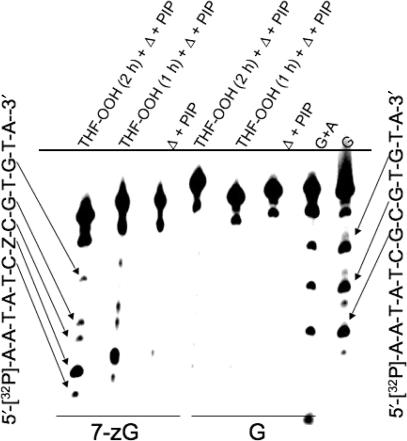
The rapid exchange that is observed in the NMR for the imino proton of the G2–C11 pair adjacent to the 7-zG suggested that the DNA may be transiently non-canonical in the vicinity of the 7-zG–C pair and thus, susceptible to footprinting by agents that preferentially react with C that have some ‘single-strand’ character. The reagent used, 2-hydroperoxytetrahydrofuran (THF-OOH), to perform this analysis selectively reacts with C that are in ss-DNA or in non-canonical forms (40,41). The location of the THF-OOH reactive bases is revealed on PAGE after heating the THF-OOH treated DNA at neutral pH to generate abasic sites that are subsequently converted into single-strand breaks by treatment with hot piperidine (42). The treatment of unmodified DUPLEX-1 (Figure 1) with THF-OOH resulted in no significant cleavage at any C (Figure 11). In contrast, the C flanking the 7-zG in DUPLEX-1 are hyper-reactive suggesting that the DNA is partially non-canonical near the modification. In addition to the bands at C, there is a very intense band at the 7-zG position and weaker bands at the other two unmodified G in the strand. The origin of THF-OOH mediated cleavage at 7-zG presumably entails the rapid oxidation of 7-zG to 8-oxo-7-zG, and its subsequent oxidation to a pyrrolidine-2,4-dione by THF-OOH similar to that observed for 8-oxoG when exposed to oxidizing agents (61,62). The control reaction, in which the 7-zG-modified oligomer is heated at pH 7.0 and then exposed to hot piperidine, affords only a weak band at the 7-zG position. These data provide additional evidence of the enhanced dynamic exposure of the bases near the 7-zG–C base pair to solvent.
Figure 11.
Chemical footprinting of DNA using THF-OOH containing a single 7-zG modification: Z = G or 7-zG.
Effect of 7-zG on cation binding and hydration
The above experiments indicated that there are no significant alterations in the intrinsic stacking and H-bonding properties of 7-zG that could explain the reduced stability of DDD-1 versus DDD or DD-1 versus DD, and the hyper-reactivity of DUPLEX-1 (X = 7-zG) to THF-OOH or the enhanced imino proton exchange of the flanking C11–G2 base pair in DDD-1. Since the original intent behind incorporating 7-zG into DNA was to inactivate the N7-G cation-binding site on G10 in DDD-1 (or G9 in DD-1), we considered the significance of cation binding in the reduced stability of the 7-zG modified duplexes.
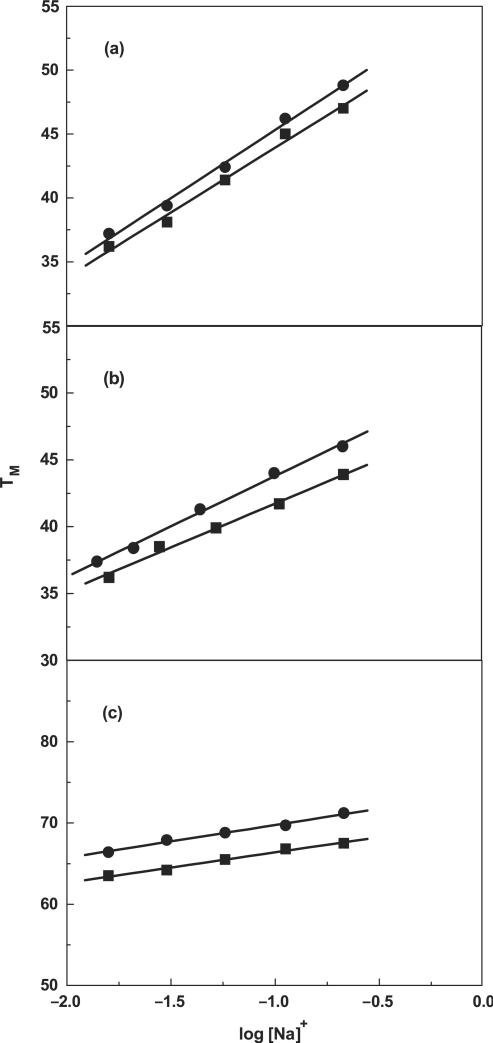
To experimentally confirm the loss, albeit global, of cations associated with DDD-1, DD-1 and HPL-1, the dependence of their TM on salt concentration was determined. For each molecule, increasing the concentration of Na+ from 16 to 200 mM results in the shift of the melting curves to higher temperatures (data not shown). The increase in salt concentration shifts the duplex-hairpin-random coil equilibrium towards the conformation with higher charge density parameter, i.e. the duplex state. The TM dependence on salt concentration for each molecule is shown in Figure 12. A linear dependence is obtained with slope values in the range of 3.75°C (HPL-1) to 10.6°C (DD). According to Equation (1), the slope of these lines, together with the (ΔHcal/RTM2) terms obtained at a similar strand concentration for all molecules, provide the linking thermodynamic parameter, ΔnNa+, for salt uptake during formation of each duplex (Table 1). We obtained negative ΔnNa+ values for the formation of each duplex and hairpin at 10 mM NaCl. Specifically, we measured Na+ uptake, in mol Na+ per mol duplex, of 2.2 (DD) and 1.8 (DD-1), 2.3 (DDD) and 1.7 (DDD-1). These values are consistent with the higher charge density of the duplex state. For the hairpins, we also obtained counterion uptakes of 0.26 (HPL) and 0.21 (HPL-1) mol Na+ per mol hairpin at 10 mM NaCl (Table 1). As expected, the overall values are low because of end effects but consistent with the unfolding of short oligonucleotide duplexes i.e. the base pairs at the ends are less helical due to their increased exposure to the solvent. The increase in bulk salt concentration yielded lower ΔnNa+ values due to higher screening of the phosphates. However, a closer inspection of these data indicate that the decamer values are higher than expected, which could be due to their higher TM dependence on salt concentration. This may be due the higher percentage (∼7%) of A–T base pairs in the decamers that are more sensitive to salt concentration.
Figure 12.
TM dependence on salt concentration for duplexes in 10 mM sodium phosphate buffer (pH 7), ∼7 μM strand concentration for (a) DD (filled circle) and DD-1 (filled square); ∼5 μM strand concentration for (b) DDD (filled circle) and DDD-1 (filled square); ∼7 μM strand concentration for (c) HPL (filled circle) and HPL-1 (filled square).
The main observation is that the incorporation of 7zG into a DNA duplex or hairpin causes lower counterion binding. For instance, there is a ΔΔnNa+ of 0.4 and 0.2 between DD and DD-1 at 10 and 100 mM NaCl, respectively, and ΔΔ nNa+ of 0.6, 0.5 and 0.3 between the pair of dodecamer duplexes at 10, 100 and 200 mM NaCl, respectively. Therefore, the incorporation of two G → 7z-G substitutions into these duplexes at the 10–100 mM range of NaCl, after the normalization of the data based upon the number of phosphates, yields a net decrease of 0.4 mol Na+/mole of duplex in counterion binding to the modified duplexes, or 0.25 mol Na+/mole duplex per modification. This value is in good agreement with the lower Na+ binding of 0.05 mol per mole hairpin, observed with the single 7-zG substitution in the modified hairpin. The actual value of counterion binding depends on the position of the modification in the duplex, i.e. the charged phosphate groups adjacent to 7-zG that are close to the helical termini would behave less like double helical phosphates due to fraying. In the case of the hairpins, which melt 37°C higher than the duplexes, the phosphates behave less helical due to an increase in thermal fluctuations.
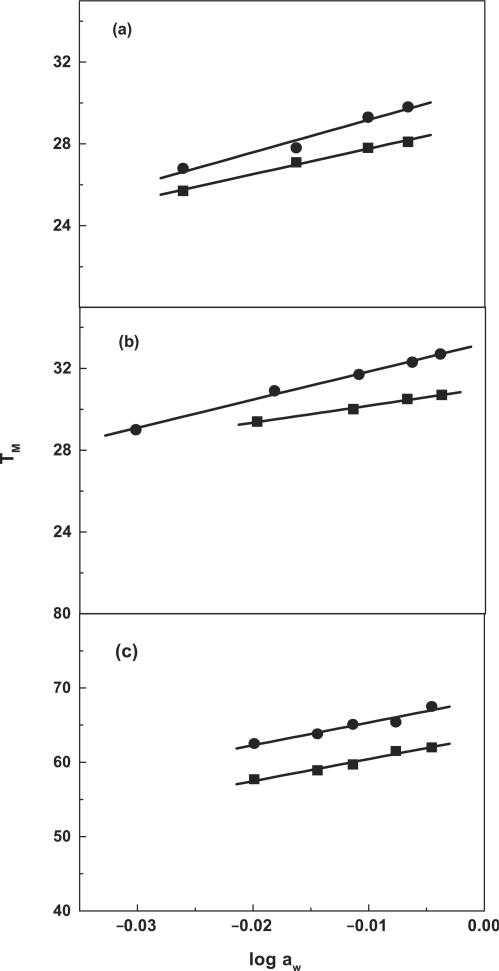
In addition to changes in cation binding, it was of interest to understand how 7-zG affected DNA hydration as counterion binding is closely associated with hydration changes. This was accomplished by measuring the effect of added osmolyte concentration on the TM, which provides a measure of the change in hydration between the duplex and denatured states Equation (2). For each molecule, increasing the concentration of osmolyte (ethylene glycol) from 0.5 to 4.0 m (i.e. decreasing the activity of water) results in the shift of the melting curves to lower temperatures (data not shown). The increase in water activity shifts the overall equilibrium towards the conformation with higher hydration level, that is, the duplex state. The TM dependence on water activity for each molecule is shown in Figure 13. A linear dependence is obtained with slope values in the range of 92°C (DDD-1) to 305°C (HPL). We obtained negative Δnw values for the formation of each duplex or hairpin at 10 mM NaCl, (Table 1). Specifically, we measured water uptake in mol H2O per mol duplex of 30 (DD) and 21 (DD-1), 38 (DDD) and 22 (DDD-1). These results are consistent with the higher hydration level of the duplex state. The increase in salt concentration yielded lower Δnw values due to screening of the water dipoles. For the hairpins, we also obtained water uptakes of 18 (HPL) and 15 (HPL-1) mol H2O/mol hairpin at 10 mM NaCl (Table 1).
Figure 13.
TM dependence on osmolyte concentration (as a function of ethylene glycol) for duplexes in 10 mM sodium phosphate buffer (pH 7), ∼7 μM strand concentration for: (a) DD (filled circle) and DD-1 (filled square); ∼5 μM strand concentration for: (b) DDD (filled circle) and for DDD-1 (filled square); ∼7 μM strand concentration for (c) HPL (filled circle) and for HPL-1 (filled square).
The significant observation is that the change in hydration between each pair of duplexes is pronounced; the substituted duplexes are less hydrated. For instance, there is a ΔΔnw of 9 and 6 between DD and DD-1 at 10 mM and 100 mM NaCl, respectively, and ΔΔnw of 16, 14 and 9 between the pair of dodecamer duplexes at 10, 100 and 200 mM NaCl, respectively. The incorporation of two G → 7z-G residues into the duplexes at the 10–100 mM range of NaCl concentration, after normalizing by the number of base pairs, yielded a net decrease of 10 water molecules per mole of duplex in the hydration level of the modified duplexes, or 5 ± 2 water molecules per modification, which is in excellent agreement with the lower hydration level, by 3 ± 1 water molecules/mole hairpin, observed with the single substitution into the modified hairpin.
DISCUSSION
Our thermodynamic profiles indicate that in the 10–100 mM salt range, the inclusion of one 7-zG modification in a DNA duplex induces a destabilization of the duplex, ΔΔG = 1 kcal/mol, which results from a typical compensation of an unfavorable enthalpy contribution, ΔΔH = 6 kcal/mol, with a favorable entropy contribution, Δ (TΔS) = 5 kcal/mol. In addition, there is lower release of both counterions (0.25 mol Na+/mole duplex), and water molecules (5 mol water/mol duplex). Therefore, the destabilization induced by 7-zG is enthalpy driven; which is attributed to changes in stacking, cation binding and hydration in the vicinity of the C–7-zG base pair. This amounts to a total enthalpy of 4.5 kcal after subtracting the energy needed to remove five electrostricted water molecules (63,64): the removal of cations does not contribute to the enthalpy change (65). However, the 1.952 Debye decrease in the dipole moment of 7-zG relative to G may amount to ∼2 kcal/mol reduction (66). Furthermore, the 0.25 mol Na+/mole duplex lower counterion release measured in these two sets of duplexes suggests that the incorporation of one modification perturbs the local helical electrostatics by an equivalence of the two neighboring phosphates: 0.25/0.11, where 0.11 is the average number of sodium ions associated per phosphate in DDD and DD. The 0.11 Na+/phosphate, which is lower than that predicted in extended sequences, reflects the end effects observed in short deoxyoligonucleotides. In any event, the release of ions from these sites may be accompanied by an immobilization of structural water, which will possibly make a small endothermic contribution to the enthalpy (64). In other words, the five electrostricted water molecules per site may be converted to immobilized structural water due to a reduction of the local charge density parameter, which is accompanied by an overall endothermic enthalpic contribution.
It was noted in previous studies that the introduction of a 7-zG residue into the self-complementary d(G-Z-A-A-T-T-C-C) sequence was destabilizing with a 4°C reduction in TM in 10 mM buffer containing 20 mM MgCl2 (30). Our results confirm the destabilization of DNA due to the presence of 7-zG at more physiological ionic strength. The reduction in stability (ΔΔG ∼ 2 kcal/mol) that we observed is similar to the 1.3 kcal/mol reduction accomplished by eliminating two G–C base pairs in going from DDD to DD. The reduction in ΔG due to the 7-zG substitution is dominated by an unfavorable ΔΔHcal term and suggests that there are changes in stacking and/or hydration in the 7-zG containing oligomers. The unfavorable ΔΔH is compensated, in part, by a favorable Δ(TΔScal) consistent with reduced release of salts and H2O from 7-zG substituted duplexes.
The thermodynamic studies complement the information gleaned from the structural studies using NMR where the most prominent feature is the rapid exchange at the C11–G2 base pair adjacent to the 7-zG10–C3. While no increased exchange is observed at the 7-zG–C, this may be partially masked by a decrease in exchange rates due to differences in the pKa of the N1-H in 7-z-dG versus dG. In any event, the NMR reflects enhanced unstacking of the bases in the environment of the modification that may be related to the role of major groove associated cations in stabilizing DNA structure. These cation-binding sites, which are associated with G in the major groove of DDD, are often observed near both G in a GpC dinucleotide step (11). There are two cations associated with the G10–C3 and C11–G2 step in the structure of DDD that was crystallized in the presence of Tl+ (11). Tl+ is an excellent surrogate for K+ based on its size and its anomalous scattering that facilitates the accurate mapping of monovalent cation locations (67–71). A Tl+ cation is ∼3.4 and 2.9 Å from G10–C3 and C11–G2, respectively. This mode of bidentate binding could add a structural buttress to the DNA stack. Elimination of such a brace would have the most dramatic effect at the base pair closest to the terminus of the duplex that is normally frayed even at low temperatures (Figure 8). The chemical footprinting of the 7-zG modification with THF-OOH is consistent with the enhanced accessibility of the bases flanking the 7-zG–C pair.
The interaction of cations with DNA is often considered restricted to the phosphate backbone. However, both mono- and divalent cations associate with the nucleobases at N7/O6-G in the major groove (11). This can involve either direct or water-mediated interactions through solvated cations. Theoretical calculations suggest that the association of cations with G in the major groove substantially stabilizes duplex DNA (72,73). It was estimated that the dG–dC base pair is stabilized by ∼20–30% due to hydrated divalent cation binding to N7-G.
In summary, we have demonstrated using a variety of complementary techniques that 7-zG causes a change in the dynamic structure and stability of DNA that result in a decrease in base stacking and exposure of the flanking bases to solvent. Such changes, which would not be apparent from X-ray crystal structures or other structural studies at low temperature, can effect the interpretation of previous and future experiments with 7-zG modified DNA, especially if performed at physiological temperatures and ionic strength. These changes also shed light upon the complex relationship between groove associated cations and water, and DNA structure and its stability.
SUPPLEMENTARY DATA
Supplementary Data are available at NAR Online.
ACKNOWLEDGEMENTS
This work was supported by NIH Grant CA29088 and CA76049 (B.G.) and Cancer Center Support Grant P20 CA36727 and NSF Grant MCB-0315746 (L.A.M.). Funding to pay the Open Access publication charges for this article was provided by NIH Grants CA29088 and CA76049.
Conflict of interest statement. None declared.
REFERENCES
- 1.Briscoe WT, Cotter L-E. DNA sequence has an effect on the extent and kinds of alkylation of DNA by a potent carcinogen. Chem. Biol. Interact. 1985;56:321–331. doi: 10.1016/0009-2797(85)90014-6. [DOI] [PubMed] [Google Scholar]
- 2.Spratt TE, Zydowsky TM, Floss HG. Stereochemistry of the in vitro and in vivo methylation of DNA by (R)- and (S)-N-[2H1,3H]methyl-N-nitrosourea and (R)- and (S)-N-nitroso-N-[2H1,3H]methyl-N-methylamine. Chem. Res. Toxicol. 1997;10:1412–1419. doi: 10.1021/tx970097b. [DOI] [PubMed] [Google Scholar]
- 3.Wurdeman RL, Gold B. The effect of DNA sequence, ionic strength and cationic DNA affinity binders on the methylation of DNA by N-methyl-N-nitrosourea. Chem. Res. Toxicol. 1988;1:146–147. doi: 10.1021/tx00003a003. [DOI] [PubMed] [Google Scholar]
- 4.Wurdeman RL, Church KM, Gold B. DNA methylation by N-methyl-N-nitrosourea, N-methyl-N′-nitro-N-nitrosoguanidine, N-nitroso(1-acetoxyethyl)-methylamine and diazomethane. The mechanism for the formation of N7-methylguanine in sequence-characterized 5′-[32P]-end-labeled DNA. J. Am. Chem. Soc. 1989;111:6408–6412. [Google Scholar]
- 5.Mattes WB, Hartley JA, Kohn KW. DNA sequence selectivity of guanine-N7 alkylation by nitrogen mustards. Nucleic Acids Res. 1986;14:2971–2987. doi: 10.1093/nar/14.7.2971. [DOI] [PMC free article] [PubMed] [Google Scholar]
- 6.Gibson NW, Mattes WB, Hartley JA. Identification of specific DNA lesions induced by three classes of chloroethylating agents: chloroethylnitrosoureas, chloroethylmethanesulfonates and chloroethylimidazotetrazines. Pharmacol. Ther. 1985;31:153–163. doi: 10.1016/0163-7258(85)90042-7. [DOI] [PubMed] [Google Scholar]
- 7.Hartley JA, Gibson NW, Kohn KW, Mattes WB. DNA sequence selectivity of guanine-N7 alkylation by three antitumor chloroethylating agents. Cancer Res. 1986;46:1943–1947. [PubMed] [Google Scholar]
- 8.Mattes WB, Hartley JA, Kohn KW, Matheson DW. GC-rich regions in genomes as targets for DNA alkylation. Carcinogenesis. 1988;9:2065–2072. doi: 10.1093/carcin/9.11.2065. [DOI] [PubMed] [Google Scholar]
- 9.Kohn KW, Hartley JA, Mattes WB. Mechanisms of DNA sequence selective alkylation of guanine-N7 positions by nitrogen mustards. Biochem. Pharmacol. 1988;37:1799–1800. doi: 10.1016/0006-2952(88)90452-2. [DOI] [PubMed] [Google Scholar]
- 10.Gold B, Marky LM, Stone MP, William LD. A review of the role of the sequence-dependent electrostatic landscape in DNA alkylation patterns. Chem. Res. Toxicol. 2006;19:1402–1414. doi: 10.1021/tx060127n. [DOI] [PMC free article] [PubMed] [Google Scholar]
- 11.Howerton SB, Sines CC, Van Derveer D, Williams LD. Locating monovalent cations in the grooves of B-DNA. Biochemistry. 2001;40:10023–10031. doi: 10.1021/bi010391+. [DOI] [PubMed] [Google Scholar]
- 12.Kriek E, Emmelot P. Methylation of deoxyribonucleic acid by diazomethane. Biochem. Biophys. Acta. 1964;91:59–66. doi: 10.1016/0926-6550(64)90170-7. [DOI] [PubMed] [Google Scholar]
- 13.Magee PN, Nicoll JW, Pegg AE, Swann PF. Alkylating intermediates in nitrosamine metabolism. Biochem. Soc. Trans. 1975;3:62–65. doi: 10.1042/bst0030062a. [DOI] [PubMed] [Google Scholar]
- 14.McGarrity JF, Smyth TJ. Hydrolysis of diazomethane-kinetics and mechanism. J. Am. Chem. Soc. 1980;102:7303–7308. [Google Scholar]
- 15.Smith RH, Jr, Koepke SR, Tondeur Y, Denlinger CL, Michejda CJ. The methyldiazonium ion in water: competition between hydrolysis and proton exchange. Chem. Soc. Chem. Commun. 1985;1985:936–937. [Google Scholar]
- 16.McGarrity JF, Cox DP. Protonation of diazomethane in superacid media. J. Am. Chem. Soc. 1983;105:3961–3966. [Google Scholar]
- 17.Dande P, Liang G, Chen F-X, Roberts C, Switzer C, Gold B. The regioselective effect of zwitterionic DNA substitutions on DNA alkylation: evidence for a strong sidechain orientational preference. Biochemistry. 1997;36:6024–6032. doi: 10.1021/bi962602u. [DOI] [PubMed] [Google Scholar]
- 18.Liang G, Encell L, Switzer C, Gold B. The role of electrostatics in the sequence selective reaction of charged alkylating agents with DNA. J. Am. Chem. Soc. 1995;117:10135–10136. [Google Scholar]
- 19.Li Z, Huang L, Dande P, Gold B, Stone MP. Structure of a DNA duplex containing a nucleotide with a major groove cationic sidechain. J. Amer. Chem. Soc. 2002;124:8553–8560. doi: 10.1021/ja0201707. [DOI] [PubMed] [Google Scholar]
- 20.Shikiya R, Li J-S, Gold B, Marky LA. Incorporation of a cationic 3-aminopropyl chain into the Dickerson-Drew dodecamer: correlation of energetics, structure and hydration. Biochemistry. 2005;44:12582–12588. doi: 10.1021/bi050897i. [DOI] [PubMed] [Google Scholar]
- 21.Moulaei T, Maehigashi T, Lountos G, Komeda S, Watkins D, Stone M, Marky L, Li J-S, Gold B, et al. Structure of B-DNA with cations tethered in the major groove. Biochemistry. 2005;44:7458–7468. doi: 10.1021/bi050128z. [DOI] [PubMed] [Google Scholar]
- 22.Latimer LJ, Lee JS. Ethidium bromide does not fluoresce when intercalated adjacent to 7-deazaguanine in duplex DNA. J. Biol. Chem. 1991;266:13849–13851. [PubMed] [Google Scholar]
- 23.Zhang X, Gottlieb PA. Thermodynamic and alkylation interference analysis of the lac repressor-operator substituted with the analogue 7-deazaguanine. Biochemistry. 1993;32:11374–11384. doi: 10.1021/bi00093a014. [DOI] [PubMed] [Google Scholar]
-
24.Shields TP, Barton JK. Sequence-selective DNA recognition and photocleavage: a comparison of enantiomers of Rh(en)2
 . Biochemistry. 1995;34:15037–15048. doi: 10.1021/bi00046a009. [DOI] [PubMed] [Google Scholar]
 - 25.Pommier Y, Kohlhagen G, Kohn KW, Leteurtre F, Wani MC, Wall ME. Interaction of an alkylating camptothecin derivative with a DNA base at topoisomerase I-DNA cleavage sites. Proc. Natl Acad. Sci. USA. 1995;92:8861–8865. doi: 10.1073/pnas.92.19.8861. [DOI] [PMC free article] [PubMed] [Google Scholar]
- 26.Wan C, Fiebig T, Kelley SO, Treadway CR, Barton JK, Zewail AH. Femtosecond dynamics of DNA-mediated electron transfer. Proc. Natl Acad. Sci. USA. 1999;96:6014–6019. doi: 10.1073/pnas.96.11.6014. [DOI] [PMC free article] [PubMed] [Google Scholar]
- 27.Malygin EG, Zinoviev VV, Petrov NA, Evdokimov AA, Jen-Jacobson L, Kossykh VG, Hattman S. Effect of base analog substitutions in the specific GATC site on binding and methylation of oligonucleotide duplexes by the bacteriophage T4 Dam DNA-[N6-adenine] methyltransferase. Nucleic Acids Res. 1999;27:1135–1144. doi: 10.1093/nar/27.4.1135. [DOI] [PMC free article] [PubMed] [Google Scholar]
- 28.Lesser DR, Kurpiewski MR, Waters T, Connolly BA, Jen-Jacobson L. Facilitated distortion of the DNA site enhances EcoRI endonuclease-DNA recognition. Proc. Natl Acad. Sci. USA. 1993;90:7548–7552. doi: 10.1073/pnas.90.16.7548. [DOI] [PMC free article] [PubMed] [Google Scholar]
- 29.Crow SD, Bailly C, Garbay-Jaureguiberry C, Roques B, Shaw BR, Waring MJ. DNA sequence recognition by the antitumor drug ditercalinium. Biochemistry. 2002;41:8672–8682. doi: 10.1021/bi012207q. [DOI] [PubMed] [Google Scholar]
- 30.Seela F, Driller H. Palindromic oligonucleotides containing 7-deaza-2′-deoxyguanosine: solid-phase synthesis of d[(p)GG*AATTCC] octamers and recognition by the endodeoxyribonuclease EcoRI. Nucleic Acids Res. 1986;14:2319–2332. doi: 10.1093/nar/14.5.2319. [DOI] [PMC free article] [PubMed] [Google Scholar]
- 31.Seela F, Driller H. Alternating d(G-C)3 and d(C-G)3 hexanucleotides containing 7-deaza-2′-deoxyguanosine or 8-aza-7-deaza-2′-deoxyguanosine in place of dG. Nucleic Acids Res. 1989;17:901–910. doi: 10.1093/nar/17.3.901. [DOI] [PMC free article] [PubMed] [Google Scholar]
- 32.Cantor CR, Warshow MM, Shapiro H. Oligonucleotide interactions. 3. Circular dichroism studies of the conformation of deoxyoligonucleotides. Biopolymers. 1970;9:1059–1077. doi: 10.1002/bip.1970.360090909. [DOI] [PubMed] [Google Scholar]
- 33.Marky LA, Blumenfeld KS, Kozlowski S, Breslauer KJ. Salt-dependent conformational transitions in the self-complementary deoxydodecanucleotide d(CGCGAATTCGCG): evidence for hairpin formation. Biopolymers. 1983;22:1247–1257. doi: 10.1002/bip.360220416. [DOI] [PubMed] [Google Scholar]
- 34.Williams LD, Chawla B, Shaw BR. The hydrogen bonding of cytosine with guanine: calorimetric and 1H-NMR analysis of the molecular interactions of nucleic acid bases. Biopolymers. 1987;26:591–603. doi: 10.1002/bip.360260411. [DOI] [PubMed] [Google Scholar]
- 35.Marky LA, Breslauer KJ. Calculating thermodynamic data for transitions of any molecularity from equilibrium melting curves. Biopolymers. 1987;26:1601–1620. doi: 10.1002/bip.360260911. [DOI] [PubMed] [Google Scholar]
- 36.Rentzeperis D, Marky LA, Dwyer TJ, Geierstanger BH, Pelton JG, Wemmer DE. Interaction of minor groove ligands to an AAATT/AATTT site: correlation of thermodynamic characterization and solution structure. Biochemistry. 1995;34:2937–2945. doi: 10.1021/bi00009a025. [DOI] [PubMed] [Google Scholar]
- 37.Kaushik M, Suehl N, Marky LA. Calorimetric unfolding of the bimolecular and i-motif complexes of the human telomere complementary strand, d(C3TA2)4. Biophys. Chem. 2007;126:154–164. doi: 10.1016/j.bpc.2006.05.031. [DOI] [PubMed] [Google Scholar]
- 38.Spink CH, Chaires JB. Effects of hydration, ion release, and excluded volume on the melting of triplex and duplex DNA. Biochemistry. 1999;38:496–508. doi: 10.1021/bi9820154. [DOI] [PubMed] [Google Scholar]
- 39.Courtenay ES, Capp MW, Anderson CF, Record MTJ. Vapor pressure osmometry studies of osmolyte – protein interactions: implications for the action of osmoprotectants in vivo and for the interpretation of “osmotic stress” experiments in vitro. Biochemistry. 2000;39:4455–4471. doi: 10.1021/bi992887l. [DOI] [PubMed] [Google Scholar]
- 40.Liang G, Gannett P, Shi X, Zhang Y, Chen F-X, Gold B. DNA Sequencing with the hydroperoxide of tetrahydrofuran. J. Am. Chem. Soc. 1994;116:1131–1132. [Google Scholar]
- 41.Liang G, Gannett P, Gold B. The use of 2-hydroperoxytetrahydrofuran as a reagent to sequence cytosine and to probe non-Watson-Crick structures. Nucleic Acids Res. 1995;23:713–719. doi: 10.1093/nar/23.4.713. [DOI] [PMC free article] [PubMed] [Google Scholar]
- 42.Maxam AM, Gilbert W. Sequencing end-labeled DNA with base-specific chemical cleavages. Methods Enzymol. 1980;65:499–560. doi: 10.1016/s0076-6879(80)65059-9. [DOI] [PubMed] [Google Scholar]
- 43.Piotto M, Saudek V, Sklenar V. Gradient-tailored excitation for single-quantum NMR spectroscopy of aqueous solutions. J. Mol. Biol. 1992;6:661–665. doi: 10.1007/BF02192855. [DOI] [PubMed] [Google Scholar]
- 44.Piantini U, Sorensen OW, Ernst RR. Multiple quantum filters for elucidating NMR coupling networks. J. Am. Chem. Soc. 1982;104:6800–6801. [Google Scholar]
- 45.Rance M, Sorensen OW, Hodenhausen G, Wagner G, Ernst RR, Wuthrich K. Improved spectral resolution in COSY 1H NMR spectra of proteins via double quantum filtering. Biochem. Biophys. Res. Comm. 1983;177:479–485. doi: 10.1016/0006-291x(83)91225-1. [DOI] [PubMed] [Google Scholar]
- 46.Griesinger G, Sorensen OW, Ernst RR. Two-dimensional correlation of connected NMR transitions. J. Am. Chem. Soc. 1985;107:6394–6396. [Google Scholar]
- 47.Sklenar V, Miyashiro H, Zon G, MIles HT, Bax A. Assignment of the 31P and 1H resonances in oligonucleotides by two-dimensional NMR spectroscopy. FEBS Lett. 1986;208:94–98. doi: 10.1016/0014-5793(86)81539-3. [DOI] [PubMed] [Google Scholar]
- 48.Keepers JW, James TL. A theoretical study of distance determination from NMR. Two-dimensional nuclear Overhauser effect spectra. J. Magn. Reson. 1984;57:404–426. [Google Scholar]
- 49.Borgias BA, James TL. MARDIGRAS – a procedure for matrix analysis of relaxation for discerning geometry of an aqueous structure. J. Magn. Reson. 1990;87:475–487. [Google Scholar]
- 50.Liu H, Tonelli M, James TL. Correcting NOESY cross-peak intensities for partial relaxation effects enabling accurate distance information. J. Magn. Reson. Series B. 1996;111:85–89. doi: 10.1006/jmrb.1996.0064. [DOI] [PubMed] [Google Scholar]
- 51.Salazar M, Fedoroff OY, Miller JM, Ribeiro NS, Reid BR. The DNA strand in DNA.RNA hybrid duplexes is neither B-form nor A-form in solution. Biochemistry. 1993;32:4207–4215. doi: 10.1021/bi00067a007. [DOI] [PubMed] [Google Scholar]
- 52.Saenger W. Principles of Nucleic Acid Structure. New York: Springer; 1984. [Google Scholar]
- 53.Tonelli M, Ragg E, Bianucci AM, Lesiak K, James TL. Nuclear magnetic resonance structure of d(GCATATGATAG). d(CTATCATATGC): a consensus sequence for promoters recognized by sigma K RNA polymerase. Biochemistry. 1998;37:11745–11761. doi: 10.1021/bi980481n. [DOI] [PubMed] [Google Scholar]
- 54.Weisz K, Shafer RH, Egan W, James TL. Solution structure of the octamer motif in immunoglobulin genes via restrained molecular dynamics calculations. Biochemistry. 1994;33:354–366. doi: 10.1021/bi00167a046. [DOI] [PubMed] [Google Scholar]
- 55.Tjandra N, Tate S, Ono A, Kainosho M, Bax A. The NMR structure of a DNA dodecamer in an aqueous dilute liquid crystalline phase. J. Am. Chem. Soc. 2000;122:6190–6200. [Google Scholar]
- 56.Brunger AT. X-Plor. Version 3.1. A System for X-ray Crystallography and NMR. New Haven, CT: Yale University Press; 1992. [Google Scholar]
- 57.Nilsson L, Karplus M. Empirical energy functions for energy minimization and dynamics of nucleic acids. J. Comp. Chem. 1986;7:591–616. [Google Scholar]
- 58.Marky LA. Interaction of a non-intercalative drug with DNA: Netropsin. Polymer Preprints. 1986;27:417–418. [Google Scholar]
- 59.Shikiya R, Li J-S, Gold B, Marky LA. Incorporation of cationic chains in the Dickerson-Drew dodecamer: correlation of energetics, structure, ion and water binding. Biochemistry. 2005;44:12582–12588. doi: 10.1021/bi050897i. [DOI] [PubMed] [Google Scholar]
- 60.Kool ET, Morales JC, Guckian KM. Mimicking the structure and function of DNA: insights into DNA stability and replication. Angew. Chem. Int. Ed. Engl. 2000;39:990–1009. doi: 10.1002/(sici)1521-3773(20000317)39:6<990::aid-anie990>3.0.co;2-0. [DOI] [PubMed] [Google Scholar]
- 61.Muller JG, Duarte V, Hickerson RP, Burrows CJ. Gel electrophoretic detection of 7,8-dihydro-8-oxoguanine and 7-8-dihydro-8-oxoadenine via oxidation by Ir(IV) Nucleic Acids Res. 1998;26:2247–2249. doi: 10.1093/nar/26.9.2247. [DOI] [PMC free article] [PubMed] [Google Scholar]
- 62.Duarte V, Hickerson RP, Burrows CJ. Insertion of dGMP and damp during in vitro DNA synthesis opposite an oxidized form of 7,8-dihydro-8-oxoguanine. Nucleic Acids Res. 1999;27:496–502. doi: 10.1093/nar/27.2.496. [DOI] [PMC free article] [PubMed] [Google Scholar]
- 63.Gasan AJ, Maleev VY, Semenov MA. Role of water in stabilizing the helical biomacromolecules DNA and collagen. Stud. Biophys. 1990;136:171–178. [Google Scholar]
- 64.Kankia BI, Marky LA. DNA, RNA, and DNA/RNA oligomer duplexes: a comparative study of their stability, heat, hydration and Mg2+ binding properties. J. Phys. Chem. B. 1999;103:8759–8767. [Google Scholar]
- 65.Krakauer H. A calorimetric investigation of the heats of binding of Mg++ to polyA, to polyU, and to their complexes. Biopolymers. 1972;11:811–828. doi: 10.1002/bip.1972.360110406. [DOI] [PubMed] [Google Scholar]
- 66.Weiner SJ, Kollman PA, Case DA, Singh UC, Ghio C, Alagona G, Profeta JS, Weiner P. A new force field for molecular mechanical simulation of nucleic acids and proteins. J. Am. Chem. Soc. 1984;106:765–784. [Google Scholar]
- 67.Wulfsberg G. Principles of Descriptive Inorganic Chemistry. Sausalito, CA: University Science Books; 1991. [Google Scholar]
- 68.Pedersen PA, Nielsen JM, Rasmussen JH, Jorgensen PL. Contribution to Tl+, K+, and Na+ binding of Asn776, Ser775, Thr774, Thr772, and Tyr771 in cytoplasmic part of fifth transmembrane segment in alpha-subunit of renal Na,K-ATPase. Biochemistry. 1998;37:17818–17827. doi: 10.1021/bi981898w. [DOI] [PubMed] [Google Scholar]
- 69.Villeret V, Huang S, Fromm HJ, Lipscomb WN. Crystallographic evidence for the action of potassium, thallium, and lithium ions on fructose-1,6-bisphosphatase. Proc. Natl Acad. Sci. USA. 1995;92:8916–8920. doi: 10.1073/pnas.92.19.8916. [DOI] [PMC free article] [PubMed] [Google Scholar]
- 70.Basu S, Szewczak AA, Cocco M, Strobel SA. Direct detection of monovalent metal ion binding to a DNA G-quartet by 205Tl NMR. J. Am. Chem. Soc. 2000;122:3240–3241. [Google Scholar]
- 71.Basu S, Rambo RP, Strauss-Soukup J, Cate JH, Ferre-D’Amare AR, Strobel SA, Doudna JA. A specific monovalent metal ion integral to the AA platform of the RNA tetraloop receptor. Nat. Struct. Biol. 1998;5:986–992. doi: 10.1038/2960. [DOI] [PubMed] [Google Scholar]
- 72.Burda JV, Sponer J, Leszczynski J, Hobza P. Interaction of DNA base pairs with various metal cations (Mg2+, Ca2+, Sr2+, Ba2+, Cu+, Ag+, Au+, Zn2+, Cd2+, and Hg2+): Nonempirical ab initio calculations on structures, energies, and nonadditivity of the interaction. J. Phys. Chem. B. 1997;101:9670–9677. [Google Scholar]
- 73.Sponer J, Leszczynski J, Hobza P. Electronic properties, hydrogen bonding, stacking, and cation binding of DNA and RNA bases. Biopolymers. 2002;61:3–31. doi: 10.1002/1097-0282(2001)61:1<3::AID-BIP10048>3.0.CO;2-4. [DOI] [PubMed] [Google Scholar]
Associated Data
This section collects any data citations, data availability statements, or supplementary materials included in this article.


