

Abstract
Microcomputed tomography (micro-CT) is ideal for quantifying pulmonary disease because of the inherent contrast between tissue and air that exists in the lungs. Both in vivo and in vitro studies can be performed using micro-CT. Live animal studies show function, while fixed specimen studies show structure. Through the use of image processing techniques, both acute and chronic lung diseases can be quantified. The information provided by micro-CT is complementary to histological evaluation, since CT is nondestructive. This paper discusses two examples, in vivo and in vitro, of how micro-CT can be used to assess pulmonary diseases in small animal models. With the use of micro-CT, we were able to quantify pulmonary fibrosis in the live rat and investigate the microstructure of the airway in fixed mouse lungs.
Keywords: In vivo, in vitro, 3D imaging, Bleomycin, hyperoxia
Introduction
Microcomputed tomography (Micro-CT) uses the attenuation of X-rays by tissues as the signal for generating image (Schuster et al., 2004). To create a CT image, a series of projection images are taken around the animal or sample in equally spaced angular intervals (Holdsworth and Thornton, 2002). This collection of images is reconstructed with a back-projection algorithm to produce a stack of 2-dimensional cross-sectional images with each pixel corresponding to a spatial location within the sample (Bushberg et al., 1994). Because the slice thickness of each image in the stack is equal to the pixel size, the image set is a 3-dimensional volumetric data set (isotropic voxels). Volumetric image data allows for reslicing the image data to provide the orthogonal or oblique views and visualization of the spatial orientation of tissues within the small animal (Ford et al., 2003).
Each pixel in the image has a value that can be mapped to the density of the tissue being imaged. This scale is referred to as CT number or Hounsfield units (HU), which is based on water being zero. Tissues that are less dense than water are negative on the Hounsfield scale and the higher density materials are positive. The CT number can be used for quantification. Because lung is a mixture between air (approximately 1000 HU) and tissue (approximately 0 HU), the density of lung is less than zero (approximately 700 HU) (Bushberg et al., 1994). CT becomes a useful tool to illustrate the density contrast between lung and the surrounding tissues (Walters et al., 2004). For example, pulmonary fibrosis can be quantified by determining which voxels in the lung field fall out of the range of the appropriate Hounsfield unit (Hoffman et al., 2003).
CT can be used to evaluate lung parenchyma and the bronchial tree both structurally and functionally (Hoffman et al., 2003). In live animal studies, the density of the lung changes significantly as a function of the respiratory cycle, in proportion to the amount of air that is in the lungs (Ford et al., 2003; Schuster et al., 2004). Respiratory motion causes some image blur especially near the diaphragm (Cavanaugh et al., 2004). In order to optimize the image, there must be a reduction in cardiac and respiratory motion (Walters et al., 2004). Image degradation can be limited with scan synchronous ventilation and cardiac gating (Badea et al., 2004). While in vivo micro-CT imaging shows function, in vitro imaging can show structure in higher resolution. Imaging a fixed specimen allows for higher resolution scans because the problem of motion is not present.
By imaging the intact specimen, information is retained about the 3D connectivity, topology and microarchitecture. Because micro-CT is nondestructive, it does not preclude subsequent histological analysis. Micro-CT images can be registered with histology to provide complementary information (Holdsworth and Thornton, 2002). This paper discusses lung imaging through an in vivo rat study and in vitro mouse study. With the use of micro-CT, we were able to quantify pulmonary fibrosis in the live rat and investigate the microstructure of the airway in fixed mouse lungs.
Methods and Materials
Live Animal Imaging
Six female Fischer 344 rats were received from Charles River (Raleigh, NC). In preparation of instillation with bleomycin solution (3.0 mg/kg), the F344 female rats (4 treated and 2 control) were anesthetized with ketamine (56 mg/kg, IP) and diazepam (2.8 mg/kg, IP) and intubated. A catheter was placed through the intubation tube pointing toward the left lung. The solution of bleomycin and saline was instilled into the left lung and the animal was placed on its left side for 2 minutes. Control animals were treated with saline only. The animals were continuously monitored for signs of distressed breathing and kept warm under a heat lamp until fully recovered. All procedures were approved by the Duke Animal Care and Use Committee.
Treated rats were selected, at random, to be imaged 1, 2, 3, or 7 weeks after instillation with Bleomycin. In preparation for imaging, rats were anesthetized with isoflurane, injected with a combination of ketamine (56 mg/kg, IP) and diazepam (2.8 mg/kg, IP), perorally intubated, and maintained on isoflurane (2.5 to 3.5%) by mechanical ventilation for the duration of the study. Electrocardiogram electrodes were attached to the foot pads for continuous cardiac monitoring. A rectal thermistor was used for monitoring body temperature and also for controlling temperature with a heat lamp using a feedback loop system.
For the highest spatial resolution, imaging was synchronous to the breathing cycle. The animals were imaged with Duke CIVM Micro-CT system (Badea et al., 2004) at 2 points in the breathing cycle (end-inspiration and end-expiration) at 80 kV, 150 mA and 10 ms for 380 projections at a step angle of 0.5° for a total orbit of 190°. No contrast agents were used. After imaging, the animals were euthanized by Nembutal overdose (100 mg/kg, IP), and the lungs were removed and filled with 10% neutral buffered formalin. The lungs remained immersed in 10% NBF until they were embedded in paraffin, sliced sagittally and stained with hematoxylin-eosin. A pathologist in the Laboratory of Experimental Pathology at the NIEHS, Research Triangle Park, NC, evaluated the histological slides.
Images were reconstructed with a Feldkamp algorithm using Cobra EXXIM software (EXXIM Computing Corp, Livermore, CA). The resulting images were 100 μ3. Each image set was imported into ImageJ 〈http://rsb.info.nih.gov/ij/〉, calibrated to CT number and resliced to give the sagittal orientation. A region of interest was taken around the bronchus to measure the signal from the developing pulmonary fibrosis and displayed as a histogram.
Fixed Specimen Imaging
Male Pparg+/+(C57BL/6J) and Pparg−/− (B6.129-Ppargtm2Rev/J) mice (6–8 weeks) were purchased from Jackson Laboratories (Bar Harbor, ME). Mice were provided food (NIH-31 for Pparg mice, modified AIN-6A for Nrf2 mice) and water ad libitum. After acclimation, unrestrained, in stainless steel cages within Hazelton 1000 chambers (Lab Products, Maywood, NJ) for 24 hours/day for 2–3 days, mice were exposed continuously to >95% O2 for 0, 24, 48, or 72 hours. Parallel exposures to filtered air were done in a separate chamber with the same numbers and strains of mice. Each animal was provided with the same mouse chow and water ad libitum during the exposure. Constant chamber air temperature (72 ± 3° F) and relative humidity (50 ± 15%) were maintained. All procedures were approved by the NIEHS Animal Care and Use Committee.
The lung fixation technique was based on the transcardial perfusion technique but has been modified to allow for the lungs to be permanently filled with air. The lungs are cleared with a heparinized saline flush, entering the heart through the left ventricle but exiting through the right axillary artery. During this flush, the lungs were inflated with air through the trachea.
Once the lungs were clear, with the lungs still inflated, the solution was switched to 10% neutral-buffered formalin with CT contrast agent (Fenestra VC, ART Advanced Research Technologies, Quebec, Canada). Once the lungs were stiff, they were tied at the trachea, removed from the body and immersed in formalin until imaging. Each lung was imaged twice, once at a lower resolution, and again at a higher resolution. The lower resolution (46 μm) scans were performed on a MicroCAT II (Imtek, Inc., Knoxville, TN) at 40 kVp, 500 μA, and 1.25 seconds with 720 projection images acquired at a 0.5° step angle for a total circular orbit of 360°. The field of view (FOV) of 23.5 × 23.5 mm2 was reconstructed on a 512 × 512 matrix to give a pixel size of approximately 46 μm. The higher resolution (29 μm) scans were performed on a MicroCAT In vitro (Siemans Medical Solutions USA, Inc., Hoffman Estates, IL) at 40 kVp, 500 μA, and 3.25 seconds with 360 projection images acquired at a 1.0° step angle for a total circular orbit of 360°. The FOV of 21.88 × 21.88 mm2 was reconstructed on a 768 × 768 matrix to give a pixel size of approximately 29 μm. The volume data sets were imported into ImageJ, and the “Connected Threshold Grower” plugin 〈http://ij-plugins.sourceforge.net/3d-toolkit/〉 was used to segment the airway from the lung parenchyma. The seed for the connected threshold grower was located in the trachea, similar to methods described in Hoffman et al. (2003). The resultant airway data sets were then imported into Voxx2 software 〈http://www.nephrology.iupui.edu/imaging/voxx/〉 to create the 3D models.
Results and Discussion
Sagittal slices through the lung are comparable in representative micro-CT images (Figure 1a) and the corresponding optical image (Figure 1b). Histology can provide information about the molecular and cellular processes (Ritman, 2002) while micro-CT can provide 3D information about the lung structure. Figure 2 displays sagittal slices through the bronchus for control, 1-, 2-, 3-, and 7-week animals, revealing the inflammation or fibrosis developing around the airway. The images in Figure 2 were used to produce the histograms in Figure 3. In Figure 3, there is a shift in the histogram as time increases after the lungs were instilled with bleomycin. The range of CT number for normally aerated lungs is −1000 to −500 (Vieira et al., 1998).
Figure 1.
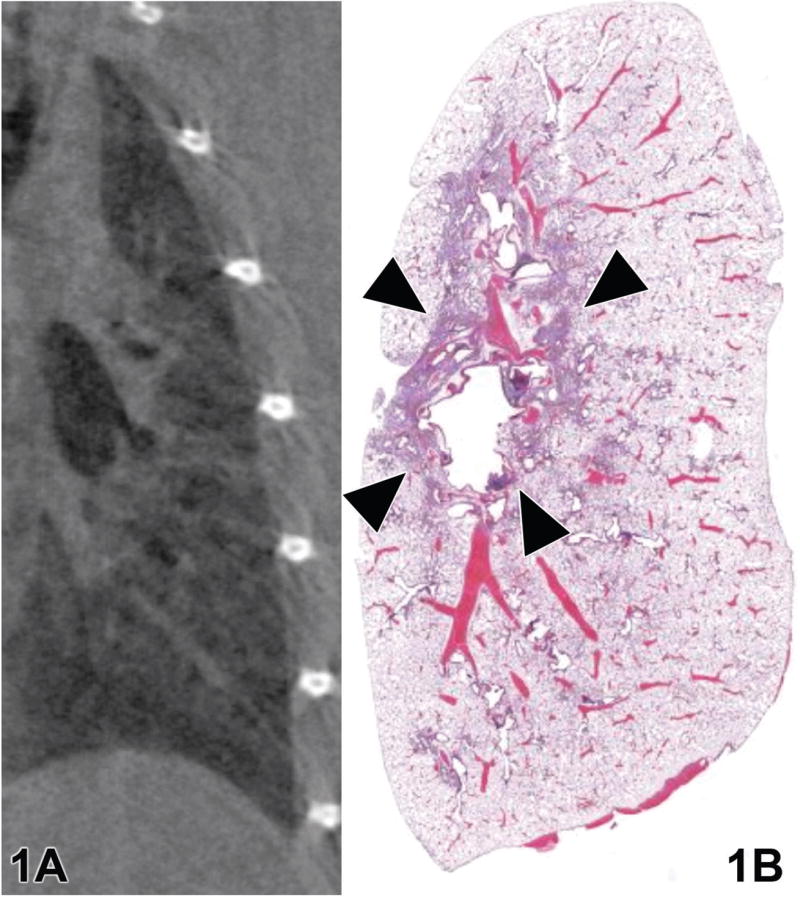
A representative (a) micro-CT and (b) hematoxylin and eosin-stained histological image from a rat treated with bleomycin solution. Arrows indicate peribronchiolar inflammation.
Figure 2.

Rat lungs imaged with the Duke Micro-CT System (Duke CIVM, Durham, NC) (a) control, (b) 1 week, (c) 2 weeks, (d) 3 weeks, and (e) 7 weeks after treatment with bleomycin. Arrows = major airways. * = heart.
Figure 3.
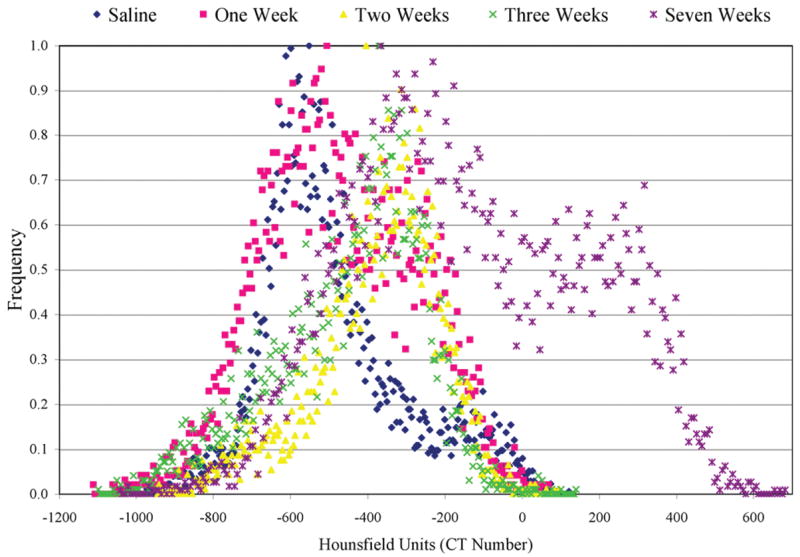
Histogram of lung tissue during expiration for 0, 1, 2, 3, and 7 weeks after instillation. The histograms were produced from micro-CT image information.
The CT number of the peak of the control animals falls in the normally aerated lung range. The CT number range for poorly aerated lung is −500 to −100 (Vieira et al., 1998). There is a secondary peak to the right of the lung peak in the Week 1 animal, suggesting a change in the lung tissue. The CT number of the secondary peak falls in the range of poorly aerated lung tissue. The histological evaluation suggested that inflammation was developing around the airway (Figure 1). The Week 2 peak falls in line with the secondary Week 1 peak. The same is true for Week 3. This change correlated with the histological evaluation—that inflammation had developed. By Week 7, there is another secondary peak that is greater than zero, suggesting that the lung tissue has become more dense. The histological evaluation confirmed that the lung had become fibrotic. The correlation of histology with the shifts in the peaks of the histograms in Figure 3 confirms the change from normal lung tissue to inflammation to fibrosis.
Figure 4 compares histograms from lung images taken during inspiration to expiration in the control, 1-, 2- and 3-week animals. These histograms (Figure 4) provide quantification of lung function. We expect a shift in histogram peaks in Figure 4a between inspiration and expiration. During inspiration, the lungs are filled with air; therefore the histogram is shifted to the left toward −1000 (the CT number for air). During expiration, when air is expelled from the lungs, the histogram shifts to the right toward 0 (the CT number for water or tissue). By Week 1 (Figure 4b), there is still a separation of peaks but the peak for expiration is more disperse, suggesting a change in lung function. By Week 2 (Figure 4c), the inspiration and expiration peaks are overlapping. By this point, the change in tissue density has prevented the lungs from expanding and contracting during inspiration and expiration, which will interfere with breathing function. By Week 3 (Figure 4d), although the peaks are still overlapping, it appears that the inspiration peak is more disperse.
Figure 4.

Histograms of lung tissue in (a) control, (b) 1 week, (c) 2 weeks, and (d) 3 weeks after instillation of bleomycin. The histograms were produced from micro-CT image information.
Live animal imaging can provide information about lung function and changing tissue characteristics. Although it was not performed in the animals in this example, animals can be repeatedly imaged in a longitudinal study. Taking advantage of CT numbers and its sensitivity to tissue type, we were able to detect changes in tissue characteristics as a result of treatment with bleomycin. Displaying the information in histogram form allows for the quantification and comparison of image data at different time points (Figure 3) and different points in the respiratory cycle (Figure 4). Although Micro-CT is sensitive enough to detect changes in the tissue density (Figure 3), histological evaluation (Figure 1) confirmed and distinguished inflammation from fibrosis.
Previously in micro-CT studies of excised lungs, a casting method has been used in which lungs are filled with resin and imaged with micro-CT. This method was used by Chaturvedi and Lee (2005) to investigate the airway structures of canine and mouse lungs. Casting techniques can deform the airways during sample preparation and because the geometry of the small airways varies during respiration, lungs need to be examined under in situ conditions (Sera et al., 2003). Sera et al. (2003) developed a staining and micro-CT (SCT) method that uses a sodium diatrizoate solution to stain the lung tissue. Prior to imaging, the lungs are inflated to total lung capacity and then deflated to functional residual capacity.
In this pilot study, we developed a fixation technique that allows the lungs to remain inflated once removed from the animal. The lungs were easily transported from our facility to the Mouse Imaging Facility (Bethesda, MD). The air trapped in the lungs can be detected via micro-CT. This fixation method was used to take advantage of the contrast between air and tissue. The resultant CT images were used to create low- and high-resolution 3D structural models (Figures 5a and 5b, respectively). The 3D models were created with seeded region growing algorithm (Hoffman et al., 2003). This image processing method allows for quick segmentation of the airway. Although it was not performed in this experiment, these models can be used for a more quantitative assessment of the branching patterns as described previously (Hoffman et al., 2003; Sera et al., 2003; Chaturvedi and Lee, 2005).
Figure 5.

(A) Low-resolution and (B) high-resolution 3D models from micro-CT image data of the airway of fixed mouse lungs.
Micro-CT is an ideal modality to study lung function and morphometry by taking advantage of the inherent contrast between air and tissue in the lung. Live animal studies can be used to evaluate lung function in acute and chronic small animal pulmonary disease models. Live animal studies require respiratory gating during the image acquisition to reduce image artifacts. Fixed specimen imaging of excised lungs can provide high-resolution images to study structure and branching patterns of the airway. By using a contrast agent, the pulmonary vessels can also be investigated.
With advances in technology, micro-CT images will be comparable to optical microscopy as higher resolution images become possible. Micro-CT is very complementary to histology because CT can provide the 3D model while histology provides information on the cellular level.
Acknowledgments
The author would like to thank Ms. Beth Mahler for her expertise, Mr. Dan Schimel and Dr. Brenda Klaunberg, DVM from the Mouse Imaging Facility in Bethesda, MD and Dr. Christian Badea, Dr. Larry Hedlund and Ms. Boma Fubara from the Duke Center for In vivo Microscopy. This research was supported [in part] by the Intramural Research Program of the NIH, National Institute of Environmental Health Sciences.
References
- Badea C, Hedlund LW, Johnson GA. Micro-CT with respiratory and cardiac gating. Med Phys. 2004;31:3324–9. doi: 10.1118/1.1812604. [DOI] [PMC free article] [PubMed] [Google Scholar]
- Bushberg JT, Seibert JA, Leidholdt EM, Boone JM. Essential Physics of Medical Imaging. 2. Williams and Wilkins; Baltimore, MD: 1994. [Google Scholar]
- Cavanaugh D, Johnson E, Price RE, Kurie J, Travis EL, Cody DD. In vivo respiratory-gated micro-CT imaging in small-animal oncology models. Mol Imaging. 2004;3:55–62. doi: 10.1162/15353500200403184. [DOI] [PubMed] [Google Scholar]
- Chaturvedi A, Lee Z. Three-dimensional segmentation and skeletonization to build an airway tree data structure for small animals. Phys Med Biol. 2005;50:1405–19. doi: 10.1088/0031-9155/50/7/005. [DOI] [PubMed] [Google Scholar]
- Ford NL, Thornton MM, Holdsworth DW. Fundamental image quality limits for microcomputed tomography in small animals. Med Phys. 2003;30:2869–77. doi: 10.1118/1.1617353. [DOI] [PubMed] [Google Scholar]
- Hoffman EA, Reinhardt JM, Sonka M, Simon BA, Guo J, Saba O, Chon D, Samrah S, Shikata H, Tschirren J, Palagyi K, Beck KC, McLennan G. Characterization of the interstitial lung diseases via density-based and texture-based analysis of computed tomography images of lung structure and function. Acad Radiol. 2003;10:1104–18. doi: 10.1016/s1076-6332(03)00330-1. [DOI] [PubMed] [Google Scholar]
- Holdsworth DW, Thornton MM. Micro-CT in small animal and specimen imaging. Trends Biotechnol. 2002;20:S34–S39. [Google Scholar]
- Ritman EL. Molecular imaging in small animals—roles for micro-CT. J Cell Biochem Suppl. 2002;39:116–24. doi: 10.1002/jcb.10415. [DOI] [PubMed] [Google Scholar]
- Schuster DP, Kovacs A, Garbow J, Piwnica-Worms D. Recent advances in imaging the lungs of intact small animals. Am J Respir Cell Mol Biol. 2004;30:129–38. doi: 10.1165/rcmb.2003-0213TR. [DOI] [PubMed] [Google Scholar]
- Sera T, Fujioka H, Yokota H, Makinouchi A, Himeno R, Schroter RC, Tanishita K. Three-dimensional visualization and morphometry of small airways from microfocal X-ray computed tomography. J Biomech. 2003;36:1587–94. doi: 10.1016/s0021-9290(03)00179-9. [DOI] [PubMed] [Google Scholar]
- Vieira SR, Puybasset L, Richecoeur J, Lu Q, Cluzel P, Gusman PB, Coriat P, Rouby JJ. A lung computed tomographic assessment of positive end-expiratory pressure-induced lung overdistension. Am J Respir Crit Care Med. 1998;158:1571–7. doi: 10.1164/ajrccm.158.5.9802101. [DOI] [PubMed] [Google Scholar]
- Walters EB, Panda K, Bankson JA, Brown E, Cody DD. Improved method of in vivo respiratory-gated micro-CT imaging. Phys Med Biol. 2004;49:4163–72. doi: 10.1088/0031-9155/49/17/023. [DOI] [PubMed] [Google Scholar]