Abstract
This paper describes a new Magnetic Resonance Spectroscopic Imaging (MRSI) technique based upon the Discrete Wavelet Transform (DWT) to reduce acquisition time and cross voxel contamination. Prototype functions called Wavelets are used in Wavelet encoding to localize defined regions in localized space by dilations and translations. Wavelet encoding in MRSI is achieved by matching the slice selective RF pulse profiles to a set of dilated and translated wavelets. Single and dual band slice selective excitation and refocusing pulses, with profiles resembling Haar wavelets, are used in a Spin-Echo sequence to acquire 2D-MRSI Wavelet Encoding data. The 2D space region is spanned up to the desired resolution by a proportional number of dilations (increases in the localization gradients) and translations (frequency shift) of the Haar wavelets (RF pulses). Acquisition time is reduced by acquiring successive MR signals from regions of space with variable size and different locations with no requirement for a TR waiting time between acquisitions. An inverse Wavelet Transform is performed on the data to produce the correct spatial MR signal distribution.
Keywords: Algorithms; Artifacts; Fourier Analysis; Image Enhancement; methods; Image Processing, Computer-Assisted; methods; Magnetic Resonance Spectroscopy; methods; Phantoms, Imaging
Keywords: Wavelet Transform, Haar Wavelets, NMR, Orthogonal Transforms
Introduction
Proton spectroscopy is now routinely used in the clinic to aid in the diagnosis and characterization of brain lesions, metabolic disorders, and epilepsy [1–3]. As its use has spread, interest has grown in mapping metabolite concentrations to provide more spatial information for treatment planning. In this application, we propose a new spatial encoding scheme based on the Discrete Wavelet Transform to deal with two problems in Magnetic Resonance Spectroscopic Imaging (MRSI) techniques: inefficient spatial encoding while maintaining high spectroscopic resolution and low concentrations of metabolites, which necessitate signal averaging. Both problems translate into long acquisition times, limiting spatial resolution and patient tolerance to the examination.
Several MRSI techniques have been developed to obtain metabolite maps. These methods may be divided into the following categories: the group of classical methods that use phase encoding with gradients in several dimensions, such as the chemical shift imaging technique (CSI) [4–6]; the group of methods that utilize excitation profiles of the RF pulses to encode spatial information, such as Hadamard Spectroscopic Imaging (SI) [7, 8]; those that use high speed imaging methods to simultaneously collect the spectral and one spatial dimension information, such as Echo Planar Imaging (EPI), Line Scan Echo Planar Spectroscopic Imaging (LSEPSI), and spiral scanning [9–11]; the group based upon the Steady State Free Precession (SSFP) mechanism to collect SI data during a TR time [12]; the Fast Spin-Echo (FSE) [13] methods, including fast imaging methods that concentrate on a few, typically one or two, chemical species while not sampling the full chemical information [14–16]; and lastly, the group of echo shifting methods that use the RF pulse or readout gradient time shift to preserve chemical shift information [17].
The first group of methods can provide metabolite images with good signal-to-noise ratio (SNR), high spectral resolution and high spatial resolution at the cost of a long acquisition time. This is caused by two factors: First, the T1 of the metabolites is long (1–2 seconds for protons and 4–6 seconds for phosphorus), requiring long TR times between encoding steps to allow for T1 relaxation. Second, to avoid image reconstruction artifacts such as pixel bleed, a large number of phase encoding steps is required in each spatial dimension. To utilize CSI clinically, spatial resolution is often sacrificed and TR times are shortened with respect to T1, reducing the ability to accurately quantify the metabolites.
The Hadamard SI method uses RF pulse modulation in the presence of gradients to obtain spatial encoding. One major advantage of this approach is the ability to provide images at low spatial resolution with less cross voxel contamination and high spectral resolution, however long TR times are still required to avoid saturation of the signal from the metabolites.
The methods that use high speed imaging techniques such as EPI [9], LSEPSI method [10] or spiral readout gradients method [11] are very rapid and offer high spatial resolution. However, as they use the readout gradient to collect both spatial and spectral points, they require complicated reconstruction methods to differentiate between spatial and spectral information. In addition, there is a trade-off between spatial and spectral resolution. The point spread functions in the spatial and spectral dimensions can lead to a spread of signal over both dimensions [18]. Furthermore, the SNR tends to decrease compared to the CSI method due to the use of high receiver bandwidths [20].
Fast imaging methods that image a single chemical species – especially in phosphorus – use fast Spin-Echo sequences to obtain images of PCr in human muscle [14, 15]. Appropriate echo spacing between the 180° RF pulses is introduced to dephase unwanted spins while fulfilling the CPMG condition for the desired ones. Thus, a limited number of species can be imaged using these methods.
The echo-shifting methods were introduced to reduce acquisition time and increase spatial resolution [17]. By shifting in time either the readout gradient or the pulses, both the spectral dimension and one spatial dimension are encoded. Phase encoding is used in the remaining spatial dimension. In this case, spectral resolution is sacrificed for shorter acquisition time [19, 20].
To reduce acquisition time and pixel bleed in MRSI, we propose a wavelet encoding (WE) method derived from the discrete wavelet transform (DWT). In the early 90’s, Weaver and Healy first introduced WE and studied its feasibility as an alternative to phase encoding in the imaging mode to speed up acquisition time in the classical spin-echo sequence, and to reduce motion artifacts [21, 22]. This method was later implemented by Panych et al [23] where excitation RF pulses with profiles resembling prototype functions called wavelets with a finite support were used to encode the space in the phase direction. The method did not see widespread application due to SNR loss relative to the phase encoding technique. If, in the phase encoding scheme, all the spins in the selected slice provide signal at each acquisition, the number of spins contributing to the signal is lower in the WE method since it is limited by the variable length of the wavelet support. As a consequence, the SNR in WE is lower than in Fourier encoding [24, 25]. The decrease in SNR is proportional to the spatial resolution in the encoded direction [24]. Nonetheless, wavelet encoding has been useful in multi-slice imaging techniques where it has been used to encode the slice dimension with a resulting increase in SNR [26, 27].
Here wavelet encoding is proposed for use in MRSI. It divides the space into sub-spaces that can either be imaged or ignored using dilated and translated wavelets. Thus, it provides a means to image only a selected portion of the field of view and to do so in a noncontiguous way. It also collects data when different sub-spaces are excited without the requirement of a TR waiting time in between, thereby speeding up data acquisition. The WE method resembles the Hadamard technique in that it modulates the RF pulses, to provide excitation profiles resembling the wavelet shapes. Like the Hadamard method, pixel bleed in the spatial dimensions is reduced in the resulting metabolite maps. Thus, minimally, the wavelet encoding method fills a niche in the small pixel number regime of MRSI. As the WE technique suffers from SNR loss compared to Fourier technique in MRI mode [24, 25], the situation should be similar in the MRSI mode since the same encoding principle is used in both modes. We expect that the WE technique will result in lower SNR compared to the CSI technique (Fourier encoding). However, the SNR loss in MRSI mode should be less than the SNR loss in MRI mode, due to the lower spatial resolution in MRSI mode than in MRI mode. Furthermore, the decrease in SNR may be compensated by signal averaging since the acquisition time is reduced.
As this technique is new for use in MRSI, the purpose of this work is to demonstrate the feasibility of wavelet encoding in obtaining 2D MRSI data. The demonstration of the 2D WE-MRSI method along with a comparison in term of SNR, acquisition time, and voxel contamination to the CSI technique is performed on a 2D water phantom. In future work, the technique will be extended to three dimensions with SNR measurement, quantification and method comparison.
Theory and methods
Encoding a finite space in one dimension up to a given resolution J using DWT can be expressed as the inner product between the spatial function f and a set of wavelet and scaling functions [28]. The wavelet functions are derived from a prototype function ψ (i.e. mother wavelet) according to: . The associated scaling functions obey a similar relation: . The integers j and k are the dilation or scale parameter, and the translation parameter, respectively. Note that for a given space resolution N = 2J, the dilation (scale) parameter j belongs to the set {1,2,....,J} and to each scale value j is associated Nj = 2J−j wavelets. The spatial function is given by:
| [1] |
where
| [2] |
The scaling function ϕJ,0 covers the entire space to be transformed in a given direction and plays the role of an averaging function similar to the center point of k-space. The wavelet function ψ is localized to parts of space in the same direction according to the translation and dilation parameter values. To cover the space in a given direction up to a resolution N, (N−1) inner products between the translated and dilated wavelets and the spatial function, plus one inner product of the averaging function are required.
The coefficients a(J,0) and d(J,0) are obtained with no translation of the scaling and the wavelet functions, respectively, at the resolution level j = J. The wavelet translation takes place only when a portion of space is covered. To encode a space in more than one direction using DWT, the number of the used prototype functions should be equal to the space dimension number to be encoded. A 2D space wavelet encoding using the same prototype function and the same spatial resolution in each direction is given by:
| [3] |
with:
where di(j,k,l) and a(J,0,0) are the 2D wavelet coefficients obtained using the equation [2] extended to two dimensions [28].
To use DWT as an encoding technique in spectroscopic imaging, some aspect of the MR pulse sequence tool has to play the role of the prototype function. As stated by equations [2] and [4], the RF pulses fulfill this condition, where the excitation profile of the RF pulse has to be similar to the shape of a given prototype function. We choose to use the Haar function here. The shape of its scale function is a boxcar, which resembles the excitation profile of a slice selective pulse, and the shape of its wavelet function is a dual boxcar given by:
| [4] |
which corresponds to the excitation profile of a dual band selective RF pulse. Note that the Haar wavelet functions have a finite support in the interval [k/2j, (k+1)/2J]. Haar functions are used in all directions when encoding the space in WE MRSI.
A slice selective 90° RF pulse followed by signal acquisition, spin echo, and PRESS are the appropriate sequences for wavelet encoding in MRSI in one, two, and three dimensions respectively. We have developed a WE spin echo sequence to acquire 2D WE-MRSI data (Fig. 1). Using the improved Shinar-LeRoux algorithm [29], one single and one dual band RF pulse for the excitation and the refocusing RF pulses -resembling scale and Haar wavelet functions respectively - are generated. The 90° RF pulse is applied along the so-called slice direction and the 180° RF pulse is orthogonal to it and applied along the so-called read direction by analogy to the imaging sequences. The translations and the dilations of the dual band RF pulses are performed as follows: the slice thickness and the FOV determine the gradient strength values in the slice and the read direction, respectively. Assume that the desired spatial resolution, which sets the number of pixels N, is the same in both directions. This number sets the number of dilations (scale) J, and consequently the number of translations steps Nj for both directions for each scale value j. The dual band RF pulse is dilated (scale operation) in each direction by multiplying the corresponding gradient strength value by the factor 2J−j, and translated by shifting its central frequency Nj times for each scale value j (j < J). The frequency shift is achieved by multiplying the RF pulse frequency bandwidth by the factor (−Nj + 2k−1)/2, where k runs from 0 to (Nj−1). Figure 1 shows the 2D WE-MRSI sequence, where the water suppression module is inserted before the WE spin-echo sequence. Figure 2 illustrates the 4 by 4 2D space encoding, with calculation of the wavelet dilation and translation parameter values based upon the sequence parameters (FOV, slice thickness and resolution).
Figure 1.
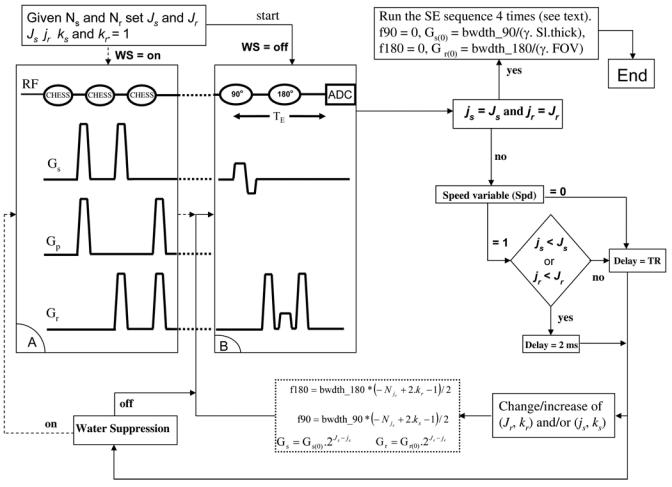
The 2D wavelet encoded MRSI sequence and algorithm. A: The water suppression module, B: The spin echo sequence used for the wavelet encoding. The translation and dilation wavelet parameters are calculated at each encoding step to set the SE-WE sequence parameters.
Figure 2.
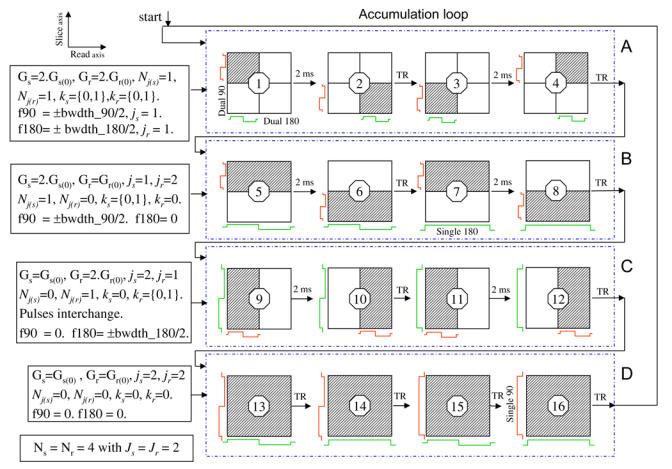
Case of a 4 by 4 wavelet encoding showing the order of data acquisition along with RF pulse combinations and the wavelet parameter values calculation, which set the RF pulses frequency shifts and the gradient values. The speed variable Spd is set to 2 ms. The profiles of the 90° and the 180° RF pulses are colored in red and green, respectively.
A: Case where j=J−1 in both directions. Signals from diagonal and anti-diagonal sub-spaces are acquired without a TR time. The dilated dual band RF pulses are translated twice.
B: Case with different j values (jslice < jread). The refocusing pulse covers the FOV. The excitation pulse covers half of the slice thickness and translated twice.
C: Case with different j values (jread <jslice). The pulses are interchanged.
D: Case where j = J in both directions. Four RF pulse combinations are necessary to collect four signals in 4 TR times.
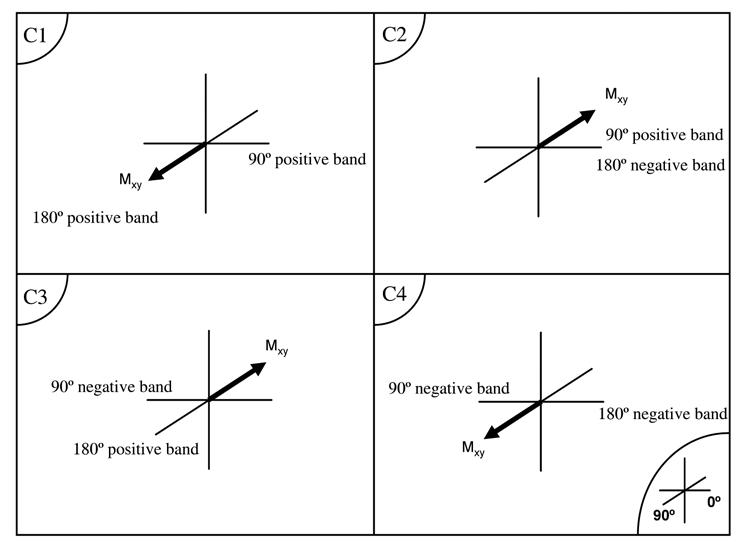
Since DWT using Haar functions is an amplitude modulation, the sign of the output functions d and a in “Eq. [4]” will depend on the signs of the Haar functions ϕ and ψ. The phase of the applied RF pulses is as follows: If the single and dual band RF excitation pulses are applied along a given axis (0° phase), the single band refocusing pulse is applied 90° out of phase, whereas the dual band is applied 90° out of phase for its positive band and 0° phase for its negative band (Fig. 3).
Figure 3.
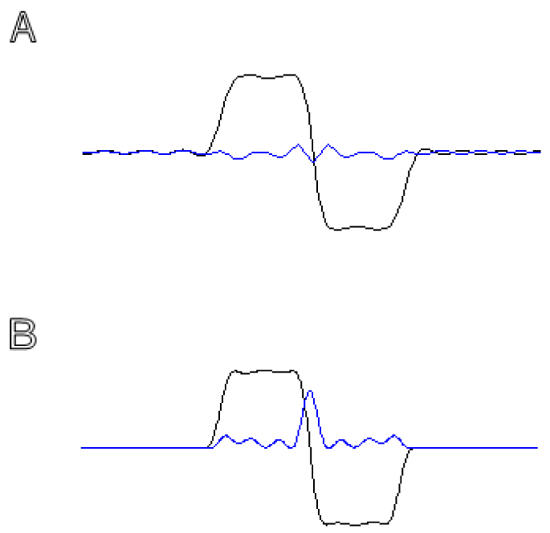
A– B: Real and imaginary (Blue) parts of the dual band excitation (A) and refocusing (B) RF pulse profiles.
C: The transverse magnetization vector orientation at t = TE for the four possible combinations of the RF pulse bands.
Timing in Wavelet Encoding
Due to the finite support of the wavelet functions, the dual band RF pulses cover only part of the space (sub-space, see Fig. 2) for each excitation. Thus, if spins experiencing the RF pulse in the corresponding sub-space are excited, those in the rest of the space are relaxed. By arranging the RF excitations in an optimal order, a series of these sub-spaces can be acquired without the need for a TR time, thus reducing acquisition time (Fig. 2). In the 2D spin echo WE sequence three different types of pulse combinations can occur depending on the desired spatial resolution:
1) When the single or the dual band excitation RF pulse with the scale parameter j = J is played in the slice direction and a single or a dual band refocusing pulse with j = J is played in the read direction, a TR time is required for each acquisition as all spins in the localized 2D space are excited (Fig. 2-D). A minimum of 4 TR times are required for any 2D space resolution. This corresponds to the acquisition of the following wavelet coefficients d1 (J,0,0), d2 (J,0,0), d3 (J,0,0), and a(J,0,0).
2) When the scale j is less than J in the slice and the read directions, only dual band RF pulses are played. They are dilated by increasing the gradient strength according to the following operations: Gr = Gr(0).2Jr−jr, Gs= Gs(0).2Js−js, and the 2D space is divided to sub-spaces (Fig. 2). Only one sub-space is covered in each acquisition. Thus, MR signals from different sub-spaces can be acquired with no TR time in between. One way to achieve this is to excite the sub-spaces that lay on a single diagonal. If j = J−1 in both directions, the dilated dual band RF pulses in the two directions cover half the slice and half the FOV. The space is divided into 4 sub-spaces and by translating the RF pulses, signals from the two diagonal sub-spaces starting from the top left are successively acquired with no TR time in between. The anti-diagonal ones are also acquired in the same manner (Fig. 2-A). The number of excited diagonal sub-spaces with no TR time in between is equal to 2J−j. When the scale value j is not equal in both directions, the number of excited diagonal sub-spaces with no TR time corresponds to the lowest value 2J−j of the two directions (Fig. 2-B). The required acquisition time for an N by N image is:
| [5] |
3) The acquisition time above is reduced further when a single or a dual band RF pulse covering the whole space (j = J) is played in one direction along with a dual band RF pulse covering a sub-space (j<J) in the other direction, by performing the following: If the slice direction is divided into sub-spaces according to the value 2J−j, the dual band excitation RF pulse is played for each sub-space, while the refocusing pulse is played for the whole space in the read direction without a TR time until all the sub-spaces are excited (Fig. 2-B). Careful attention must be paid to the sign of the acquired MR signal. When the signal from the first excited sub-space is acquired, the remaining sub-spaces experience only the refocusing pulse and their magnetization is flipped along -Z thus, the MR signal acquired from the second sub-space will be of opposite sign, the third will recover its sign, and so on. However, spins from sub-spaces with magnetization along -Z axis are subject to T1 relaxation before their signal acquisition. Correction on these signals is required as function of T1 and the time between the corresponding spins are flipped along -Z axis and their excitation. The same principle is used if the FOV in the read direction is divided to sub-spaces based upon the value 2J−j in that direction. Only the RF pulses are interchanged the dual band excitation RF pulse is played in the read direction for each sub-space and the refocusing pulse is played in the slice direction (Fig. 2-C).
Signal to Noise in Wavelet encoding
If, in all the transform methods mentioned above (Fourier, Hadamard, and Wavelet) the total energy is preserved for each frequency band (Fourier transform), each row (Hadamard transform), and each scale (Wavelet transform), the signal detected in wavelet encoding at each scale is decreased by the normalization factor . This reduction is because wavelet encoding does not include the normalization factor in the RF pulse modulation. Maximum signal is obtained with a 90° tip angle. Therefore, before data reconstruction, each acquired signal needs to be multiplied by the corresponding normalization factor. As a consequence, the noise increases and the SNR drops in Wavelet encoding compared to Fourier or Hadamard encoding. Compared to Fourier encoding, the SNR loss in WE for the MRI mode is described by the equations [12] in reference [24], and [47] in reference [25]. Extending these equations to two dimensions, the SNR in 2D WE MRSI drops by a factor of:
| [6] |
However, as the acquisition time is dramatically reduced, more acquisitions are possible to compensate for the SNR loss.
Material and Methods
The 2D wavelet encoded MRSI scheme has been implemented on a 7 Tesla 8 mm horizontal bore Brucker magnet and encouraging results have been obtained using a water solution phantom [30]. To further test the method with different spatial resolutions, the sequence is implemented on a 3 Tesla whole body magnet with a SMIS console. A volume coil is used to acquire 2D WE MRSI from two circular phantoms containing equally spaced 4 by 4 and 8 by 8 holes. Cylindrical tubes filled with pure water are placed in 6 and 20 holes in the 4 by 4 (Fig. 4) and 8 by 8 phantoms (Fig. 5), respectively. 2D CSI data is acquired from the 4 by 4 phantom for comparison. Four pulses, two single band excitation and refocusing pulses as well as two dual band pulses, with 12 ms duration and 1.5 KHz bandwidth are generated using an SLR algorithm [29]. The WE MRSI and CSI data are acquired with the following acquisition parameters: TR = 2 s, TE = 70 ms, 2 accumulations, 5 KHz bandwidth, 512 points and 102 ms acquisition duration. A localizer image is acquired first to determine the FOV and slice thickness values, which are set to 166 mm and 160 mm for both phantoms, respectively. A speed acquisition variable (Spd) is added to the sequence to acquire data in the normal mode (Spd = 0) and the speed mode (Spd =1) (Fig. 1). In the speed mode, a waiting time of 2 ms is used between successive acquisitions when the TR time is not required (Fig. 2). Data from both phantoms are acquired with and without speed acquisition. Data from the 4 by 4 phantom are quantified and the results compared in terms of acquisition time, SNR, and spatial distribution to the CSI technique. No post-processing operation is performed on the CSI data.
Figure 4.
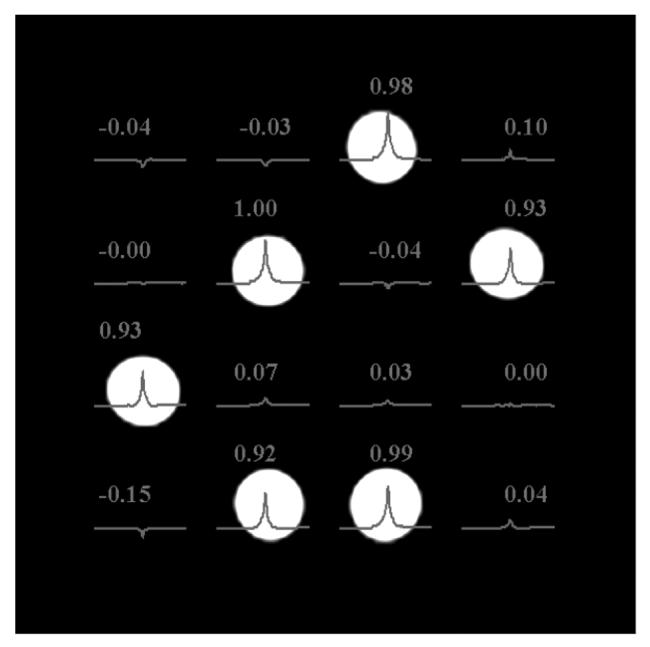
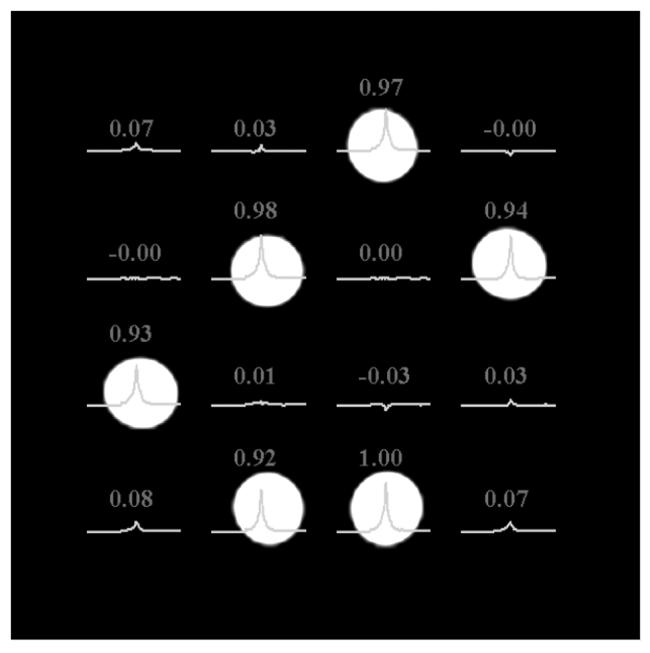
Normalized water peak values of acquired 4 by 4 WE localized MR water spectra using the normal mode (A) and the speed mode (B) of the SE-WE sequence on the top of the gradient echo localization image of small bottles where 6 are filled with water.
Figure 5.
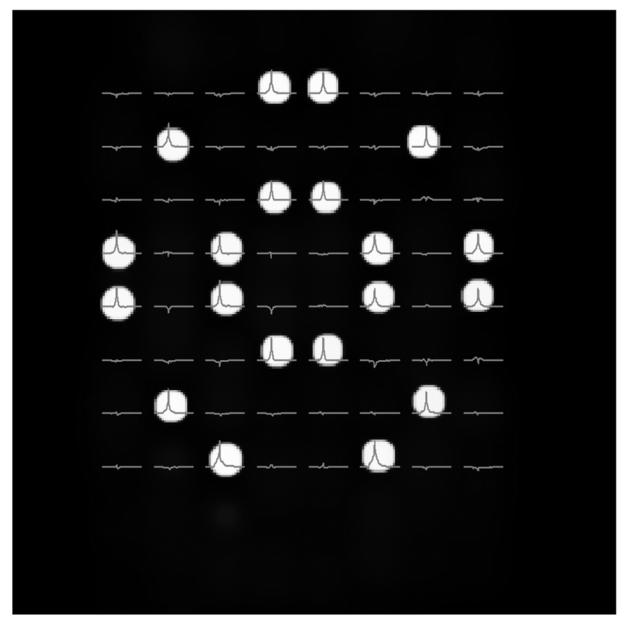
Acquired 8 by 8 WE localized water spectra using the speed mode of the SE-WE sequence on the top of the gradient echo localization image of small vials where 20 are filled with water.
Results and Discussion
The 4 by 4 WE MRSI data is acquired in 1m 4 s in the normal mode, which is equal to the acquisition time required when using the CSI method and is reduced to 43 s in the speed mode whereas the 8 by 8 data is acquired in 4m 16 s in the normal mode (CSI mode) and reduced to 2m 02 s in the speed mode. This results in a time reduction of 33 % and 52% for the 4 by 4 and 8 by 8 data, respectively. Figure 4 displays the spatial distribution of the water spectra and the normalized quantification results for both the normal mode and the speed mode acquisition for the 4 by 4 phantom. Figure 5 shows the correct spatial distribution of the 2D WE 8 by 8 MRSI data of the full water tubes on the localization image in the speed mode acquisition.
These preliminary results show that Wavelet Encoding may be used in MRSI. It allows reduction of acquisition time while preserving the spatial distribution of the signal. However, as shown in Figure 4, a residual signal appears with negative amplitude in a few empty pixels. In practice, the inverse Wavelet transformation should provide results with positive amplitudes in the reconstruction process since it is amplitude modulation, as a consequence, the negative values should be set to zero. One reason for these errors is the inverse Wavelet transformation in equation [2], which uses the Haar scale and wavelet functions set to 1 −1 and 1 1, respectively. As shown in Figure 3, the areas of the bands of the RF pulses – especially the dual band refocusing pulse – are not equal to the area of a boxcar function. This is mainly due to the large transition band and the curved edges of the RF pulse profile. Longer RF pulses are required to better approach a boxcar shape. Another reason for these errors is imperfection in the refocusing pulses. One solution to this problem is to use other wavelets with smoother decays. This reduces the errors related to the RF profile shape problem and allows the use of shorter RF pulses. Furthermore, the shimming must be very good in order to acquire data with less cross voxel contamination. The results in the lower left part of Figure 4 are less accurate than the rest of the image. This is mainly due to the poor shimming at this location, which is difficult to improve due to the shapes of the phantoms with empty holes. In term of numbers, the mean value for the results acquired in the normal mode and the speed mode are 0.958 ± 0.035 and 0.956 ± 0.032, respectively.
Compared to the CSI method, the SNR of WE MRSI is lower by a factor of 1.95 in the normal mode, and 2 in the speed mode in the 4 by 4 data. The SNR loss is consistent with the equation [6]. In terms of spatial distribution, the ratio of empty pixels/full pixels is 10%, 8% and 42% in the normal mode and the speed mode for the WE MRSI method, and for the CSI method, respectively. Wavelet encoding appears to preserve the spatial distribution of the signal better than the CSI method, especially at low resolution. The decrease in SNR can be recovered by signal averaging while preserving the better spatial discrimination of the wavelet encoding method.
In theory, wavelet encoding should provide data with higher SNR than the line scan method [24]. The size of the slice thickness is constant at each acquisition using the line scan method, whereas for the wavelet encoding method the size depends on the length of the support of the wavelet function, which varies from one level of resolution to another. Therefore, the excited space in the wavelet encoding method is larger than that in the line scan method. Furthermore, spectral resolution using the line scan method is limited by the readout gradients. The wavelet encoding method provides better spectral resolution, similar to the CSI method.
Conclusion
A 2D magnetic resonance spectroscopic imaging technique based on the wavelet encoding method is presented. Previous results [30] and the results shown here demonstrate that compared to the CSI method, the wavelet encoding technique is able to reduce acquisition time while preserving the correct spatial distribution, with less voxel contamination. The voxel contamination reduction is independent from the spatial resolution, whereas the time reduction is directly proportional to it as stated by equation [5]. This method also collects data with high spectral resolution using just four pulses for space encoding, whereas the Hadamard encoding technique necessitates a different pulse for each row of the Hadamard matrix.
Wavelet encoding appears to suffer from low SNR compared to Fourier encoding; however, it provides results with higher SNR compared to the line scan method [24]. To increase the SNR in wavelet encoding, less spatially localized wavelets should be used to approach the SNR of Fourier encoding method [25].
To reduce data reconstruction artifacts, which are the main source of pixel bleed, a smoother wavelet basis less dependent on the excitation RF profile shapes should be tested. Shorter RF pulses could be used and data with shorter TE values could be acquired. In future work, the method will be extended to 3 dimensions using the PRESS sequence where acquisition time and pixel bleed will be dramatically reduced compared to the CSI and Hadamard SI techniques.
Acknowledgments
The authors would like to thank Dr. Lizann Bolinger and Racquel Baert of the Institute for Biodiagnostics, Winnipeg (Canada) for the helpful advice.
Contributor Information
Hacene Serrai, Institute for Biodiagnostics National Research Council, 435, avenue Ellice Winnipeg, MB R3B 1Y6,CA.
Lotfi Senhadji, Laboratoire Traitement du Signal et de l'Image INSERM : U642, Université Rennes I, LTSI, Campus de Beaulieu, 263 Avenue du Général Leclerc - CS 74205 - 35042 Rennes Cedex,FR.
References
- 1.Gruber S, Stadlbauer A, Mlynarik V, Gatterbauer B, Roessler K, Moser E. Proton magnetic resonance spectroscopic imaging in brain tumor diagnosis. Neurosurg Clin N Am. 2005;16(1):101–114. doi: 10.1016/j.nec.2004.07.004. [DOI] [PubMed] [Google Scholar]
- 2.McKnight TR. Proton magnetic resonance spectroscopic evaluation of brain tumor metabolism. Seminars in Oncology. 2004;31(5):605–617. doi: 10.1053/j.seminoncol.2004.07.003. [DOI] [PubMed] [Google Scholar]
- 3.Hetherington HP, Kim JH, Pan JW, Spencer DD. 1H and 31P spectroscopic imaging of epilepsy: Spectroscopic and histologic correlations. Epilepsia. 2004;45(4):17–23. doi: 10.1111/j.0013-9580.2004.04004.x. [DOI] [PubMed] [Google Scholar]
- 4.Haselgrove JC, Subramanian VH, Leigh JS, Jr, Gyulai L, Chance B. In vivo one-dimensional imaging of phosphorus metabolites by phosphorus-31 in nuclear magnetic resonance. Science. 1983;220(4602):1170–1173. doi: 10.1126/science.6857240. [DOI] [PubMed] [Google Scholar]
- 5.Maudsley AA, Hilal K. Spatially resolved high resolution spectroscopy by four dimensional NMR. J Magn Reson. 1983;51:147–152. [Google Scholar]
- 6.Brown TB, Kincaid BM, Ugurbil K. NMR chemical shift imaging in three dimensions. Proc Nat Acad Sci. 1982;79:3523–3526. doi: 10.1073/pnas.79.11.3523. [DOI] [PMC free article] [PubMed] [Google Scholar]
- 7.Bolinger L, Leigh JS. Hadamard Spectroscopic Imaging (HSI) for Multi-Volume Localization. J Magn Reson. 1988;80:162–167. [Google Scholar]
- 8.Gonen O, Arias-Mendoza F, Goelman G. 3D localized in vivo 1H spectroscopy of human brain by using a hybrid of 1D-Hadamard with 2D-chemical-shift imaging. Magn Reson Med. 1997;37:644–650. doi: 10.1002/mrm.1910370503. [DOI] [PubMed] [Google Scholar]
- 9.Posse S, Gioacchino T, Risinger OR, Bihan DL. High-speed 1H spectroscopic imaging in human brain by echo-planar spatial-spectral encoding. Magn Reson Med. 1995;33(1):34–40. doi: 10.1002/mrm.1910330106. [DOI] [PubMed] [Google Scholar]
- 10.Oshio K, Kyriakos W, Mulkern RV. Line scan echo planar spectroscopic imaging. Magn Reson Med. 2000;44(4):521–524. doi: 10.1002/1522-2594(200010)44:4<521::aid-mrm4>3.0.co;2-#. [DOI] [PubMed] [Google Scholar]
- 11.Adalsteinsson E, Irarrazabal P, Topp S, Meyer G, Macovski A, Spielman DM. Volumetric spectroscopic imaging with spiral-based k-space trajectories. Magn Reson Med. 1998;39(8):889–898. doi: 10.1002/mrm.1910390606. [DOI] [PubMed] [Google Scholar]
- 12.Speck O, Scheffler K, Hennig J. Fast 31P chemical shift imaging using SSFP methods. Magn Reson Med. 2002;48:633–639. doi: 10.1002/mrm.10279. [DOI] [PubMed] [Google Scholar]
- 13.Duyn JH, Moonen CTW. Fast proton spectroscopic imaging of human brain using multiple spin-echoes. Magn Reson Med. 1993;30:409–414. doi: 10.1002/mrm.1910300403. [DOI] [PubMed] [Google Scholar]
- 14.Greenman RL, Elliot MA, Vandenborne K, Schnall MD, Lenkinski RE. Fast imaging of phosphocreatine using a RARE pulse sequence. Magn Reson Med. 1998;39:851–854. doi: 10.1002/mrm.1910390523. [DOI] [PubMed] [Google Scholar]
- 15.Chao H, Bowers JL, Holtzman D, Mulkern RV. RARE imaging of PCr in human forearm muscles. J Magn Reson Img. 1997;7:1048–1055. doi: 10.1002/jmri.1880070617. [DOI] [PubMed] [Google Scholar]
- 16.Wald LL, Frederick BB, Renshaw PF. NAA-weighted imaging of the human brain using a conventional readout gradient. Magn Reson Med. 1999;41(1):187–192. doi: 10.1002/(sici)1522-2594(199901)41:1<187::aid-mrm26>3.0.co;2-r. [DOI] [PubMed] [Google Scholar]
- 17.Haase A. Snapshot FLASH MRI. Applications to T1, T2, and chemical-shift imaging. Magn Reson Med. 1990;13:77–89. doi: 10.1002/mrm.1910130109. [DOI] [PubMed] [Google Scholar]
- 18.Hanson LG, Schaumburg K, Paulson OB. Reconstruction strategy for echo planar spectroscopy and its application to partially undersampled imaging. Magn Reson Med. 2000;44:412–417. doi: 10.1002/1522-2594(200009)44:3<412::aid-mrm11>3.0.co;2-p. [DOI] [PubMed] [Google Scholar]
- 19.Hugg JW, Maudsley AA, Weiner MW, Matson GB. Comparison of k- space sampling schemes for multidimensional MR spectroscopic imaging. Magn Reson Med. 1996;36:469–473. doi: 10.1002/mrm.1910360321. [DOI] [PubMed] [Google Scholar]
- 20.Phomann R, Von Kienlin M, Haase A. Theoretical evaluation and comparison of fast chemical shift imaging methods. J Magn Reson. 1997;160:145–160. doi: 10.1006/jmre.1997.1245. [DOI] [PubMed] [Google Scholar]
- 21.Healy DM, Weaver JB. Two applications of wavelet transforms in magnetic resonance imaging. IEEE Trans Inf Theory. 1992;38(2):840–860. [Google Scholar]
- 22.Weaver JB, Xu Y, Healy DM, Driscoll JR. Wavelet-encoded MR imaging. Magn Reson Med. 1992;24:275–287. doi: 10.1002/mrm.1910240209. [DOI] [PubMed] [Google Scholar]
- 23.Panych LP, Jakab PD, Jolesz FA. Implmentation of wavelet-encoded MR Imaging. J Magn Reson Img. 1993;3:649–655. doi: 10.1002/jmri.1880030415. [DOI] [PubMed] [Google Scholar]
- 24.Weaver JB, Healy DM. Signal-to-Noise ratios and effective repetition times for wavelet encoding and encoding with wavelet packet bases. J Magn Reson (A) 1995;113:1–10. [Google Scholar]
- 25.Panych LP. Theoretical comparison of fourier and wavelet encoding in magnetic resonance imaging. IEEE Trans Med Img. 1996;15(2):141–153. doi: 10.1109/42.491416. [DOI] [PubMed] [Google Scholar]
- 26.Shimizu K, Panych LP, Mulkern RV, Yoo SS, Schwartz RB, Kikinis R, Jolesz FA. Partial wavelet encoding: A new approach for accelerating the temporal resolution in contrast-enhanced MR imaging. J Magn Reson Img. 1999;9:717–724. doi: 10.1002/(sici)1522-2586(199905)9:5<717::aid-jmri15>3.0.co;2-j. [DOI] [PubMed] [Google Scholar]
- 27.Gelman N, Wood ML. Wavelet encoding for improved SNR and retrospective slice thickness adjustment. Magn Reson Med. 1998;39:383–391. doi: 10.1002/mrm.1910390308. [DOI] [PubMed] [Google Scholar]
- 28.I. Daubechies, Ten Lectures on Wavelets, CBMS-NSF Lecture Notes nr. 61, SIAM, 1992.
- 29.Cunningham CH, Wood ML. Method for improved multiband Excitation profiles using the Shinnar-Le Roux transform. Magn Reson Med. 1999;42:577–584. doi: 10.1002/(sici)1522-2594(199909)42:3<577::aid-mrm21>3.0.co;2-e. [DOI] [PubMed] [Google Scholar]
- 30.Serrai H, Senhadji L, Wang G, Bolinger L. A new high speed spectroscopic imaging sequence using Wavelet Encode. ESMRMB; Copenhagen: 2004. p. 335. [Google Scholar]


