Abstract
Conventional static automated perimetry provides important clinical information, but its utility is limited by considerable test-retest variability. Fixational eye movements during testing could contribute to variability. To assess this possibility, it is important to know how much sensitivity change would be caused by a given eye movement. To investigate this, we have evaluated the gradient, the rate at which sensitivity changes with location. We tested one eye each, twice within 3 weeks, of 29 patients with glaucoma, 17 young normal subjects and 13 older normal subjects. The 10-2 test pattern with the SITA Standard algorithm was used to assess sensitivity at locations with 2° spacing. Variability and gradient were calculated at individual test locations. Matrix correlations were determined between variability and gradient, and were substantial for the patients with glaucoma. The results were consistent with a substantial contribution to test-retest variability from small fixational eye movements interacting with visual field gradient. Successful characterization of the gradient of sensitivity appears to require sampling at relatively close spacing, as in the 10-2 test pattern.
Keywords: visual field, perimetry, variability, eye-movement, glaucoma
Introduction
Conventional automated static perimetry is widely used for assessing functional status of patients with visual disorders. The technique has been a powerful clinical tool, particularly in the case of diseases such as glaucoma where the pattern of visual field loss can be pathognomic and the stability of the condition can be monitored. One difficulty with conventional perimetry is that the results can be quite variable and, at least in the case of glaucoma and optic neuritis, variability has been found to increase in areas of the visual field that have suffered more damage (Chauhan & Johnson, 1999, Heijl, Lindgren & Lindgren, 1989, Heijl, Lindgren & Olsson, 1987, Henson, Chaudry, Artes, Faragher & Ansons, 2000, Lewis, Johnson, Keltner & Labermeier, 1986, Spry, Johnson, Mckendrick & Turpin, 2001, Wall, Kutzko & Chauhan, 1997). High variability makes it more difficult to determine whether a decrease in visual field sensitivity is a true case of progression of damage, or simply an instance of variation of test results.
A better understanding of test-retest variability would clearly be of benefit. Aside from possible actual changes due to progression, there are a number of possible causes of variability; e.g., variations in retinal cell behavior, reduction in numbers of cells generating the signal, and fixational eye movements.
There is a nonmonotonic relation between the amount of variability of perimetric results with sensitivity in patients with glaucoma or optic neuritis: variability tends to increase with sensitivity down to about 10dB within the limits of the perimetric instrument, then tends to decrease (Artes, Hutchison, Nicolela, LeBlanc & Chauhan, 2005, Flammer, Drance & Zulauf, 1984, Piltz & Starita, 1990). When sensitivity drops below this range, the maximum stimulus will not be seen on most trials and test-retest variability becomes reduced as an artifact of the limits of the device, in what can be called a “floor” effect.
There have been reports that variability increases near the edges of scotomas (Demirel, Johnson, Fendrich & Vingrys, 1997, Haefliger & Flammer, 1989, Haefliger & Flammer, 1991) and that the number of steep scotoma boundaries in a field is correlated with the variability (Henson & Bryson, 1990). To the extent that eye movements contribute to perimetric variability, variability should be correlated with the slope or gradient of the visual sensitivity. Previous researchers have concluded that gradient of sensitivity has less effect on variability for glaucomatous defects than for the physiological blind spot (Haefliger & Flammer, 1991), and that fixation errors may have only a minor influence on perimetric variability (Henson, Evans, Chauhan & Lane, 1996). However, these studies did not use fine two-dimensional grids to assess visual field gradient, and did not consider the potential effects of changes in fixation by less than 1 degree of arc. In the present study, we used a fine two-dimensional grid to examine the relationship between variability, sensitivity, and gradient of sensitivity in eyes of patients with glaucoma. Results were assessed to determine the extent to which small eye movements could affect variability.
Methods
Patients with glaucoma
Twenty-nine patients with glaucoma were recruited from the Glaucoma Institute in the University Optometric Center at SUNY College of Optometry. (Average age 67; range 41–88.) Each patient was experienced at visual fields, having produced reliable data on at least two consecutive tests, where reliability was defined as fixation loss rate and false positive rate less than 20%. (Fixation loss rate for the 29 patients: mean = 4%; 1st quartile = 0%; median = 1%; 3rd quartile = 6%.) Eighteen of the patients had been previously tested with a full-threshold protocol, providing false positive rates (mean = 1%; 1st quartile = 0%; median = 0%; 3rd quartile = 2%.) The remainder had been tested with a SITA Standard protocol, providing false positive rate estimates (mean = 2%; 1st quartile = 0%, median = 1%; 3rd quartile = 3%). Each patient had characteristic visual field loss consistent with glaucoma, was free of systemic conditions known to have an effect on the eye or visual pathway (e.g. cerebral-vascular disease), and was free of eye disease other than glaucoma (e.g., retinal vascular disease, visually significant media opacity). To be eligible for the study, an eye was required to show some visual loss within 10 deg of fixation, but no serious defect within 1 degree of fixation, and visual acuity no worse than 20/40 (Median 20/30, 1st quartile = 20/20, 3rd quartile = = 20/30). Degree of visual field loss for 10-2 fields ranged from mean deviation (MD) −31.4 to −2.9 dB (mean: −15.0 dB; median: −14.0 dB); pattern standard deviation (PSD) from 15.1 to 3.0 dB (mean: 10.2 dB; median 11.2 dB). Considering the most sensitive of the four 10-2 test locations nearest to fixation, the average across subjects was 29.3 dB (1st quartile = 27.5, median = 29.5, 3rd quartile = 32.0).
Each patient was tested at two visits at least 2 days apart and no more than 21 days apart. 10-2 data were obtained from one eye of each patient. (The points tested in the 10-2 protocol are in a square grid with 2 degree spacing, within 10 deg of the fixation point.) Testing was performed on a Humphrey Visual Field Analyzer using the SITA Standard threshold program (Carl Zeiss, Meditec, Inc., Dublin, CA) with Size III stimulus. Protocols were approved by the institution’s IRB, and informed consent was obtained from each patient, in accord with the principles of the Declaration of Helsinki.
In addition to the 10-2 data on which this report is focused, retrospective data from 24-2 or 30-2 SITA Standard visual fields for 20 of the 29 eyes were collected from the patients’ records. (The points tested in the 24-2 and 30-2 protocols are in a square grid with 6 degree spacing.) 24-2 fields were not available for all eyes, because in cases of advanced loss, 24-2 fields can be of limited use (Blumenthal & Sapir-Pichhadze, 2003), and clinical field testing emphasized 10-2 fields.
Young Normal subjects
17 students from the student population at SUNY College of Optometry participated in these experiments. (Average age: 24; range 20–27.) All subjects had received a complete ocular examination within one year of the testing, and had been determined to be free of ocular disease. Refractive error was no greater than +/− 6.00D sphere and no greater than +/− 2.00 D cylinder. The subjects were tested with the SITA Standard 10-2 protocol. One eye of each subject was tested a total of four times; only the 3rd and 4th tests were used as data. The average time interval between the two tests was approximately 1 week.
Older Normal subjects
13 subjects over 45 years old participated in these experiments (average age 57; range 47–62). As with the younger subjects, all subjects had been determined to be free of ocular disease and were within the same refractive limits. All of these subjects had participated in earlier experiments and had experience with visual field testing. One eye of each subject was tested twice within a period of 3 weeks.
Sensitivity
Sensitivity at each test location of a given eye was taken to be the average sensitivity over repeated testing. Sensitivity values are reported in decibels (dB) where 1 dB = 0.1 log units.
Variability
Variability was taken to be the SD of sensitivity across repeats at each location. This makes the algorithm applicable to two or more fields; for two fields, the SD is √2 times the average deviation from the mean or (1/√2) times the magnitude of the test-retest difference. The presence or absence of a factor of √2 does not affect any of the correlations.
Gradient
The gradient, ∇S, was determined at each test location from the 8 nearest-neighbor test locations. The need for neighboring points meant that the best gradient estimates were obtained from the central 6 × 6 array of test locations (36 points) for 10-2 fields, plus 8 additional locations at (x,y) = (±1 deg, ±7 deg) and (±7 deg, ±1 deg). All of these locations provide data from 7 or 8 out of 8 possible surrounding locations. To estimate the gradient at a test location, the partial derivatives in the horizontal (x) and vertical (y) directions were first estimated. Each of these was estimated with two-point differences. The partial derivative in the x-direction was estimated from adjacent points in the x-direction; for example, if a group of 3 sensitivities, S−1, S0, and S+1, at x-coordinate locations x = −1, 0, and +1 grid units was used to estimate a derivative in the x-direction, the slope was taken to be
| (1) |
This is actually equivalent to fitting a parabola to the three values to give the slope estimate at the central location in dB per grid interval.1 An exception to this was made if S0 was zero and if S−1 and/or S+1 were also zero; in that case, fitting a parabola would force negative values to one side of the center point, so the slope was taken to be zero at the center point. This estimate of the x-derivative, which we refer to as the “axial” estimate, was combined with similar estimates made using differences of diagonally-adjacent points. Using S(x = +1, y = +1) instead of S+1, and S(x = −1, y = −1) instead of S−1, in eq(1) gave an estimate of the slope in the plus-45-degree direction; this was scaled for the greater point separation and the vector component in the +x direction was determined. (The point separation is a factor of √2 greater, and cos(45 deg) = 1/√2. Thus, the diagonal difference corresponding to eq(1) is divided by 2 to get an estimated component in the x-direction in dB per grid interval.) Similarly, we obtained an estimate of the x-component of the slope in the minus-45-degree direction. The sum of the two x-components of these diagonal estimates gives a second, independent estimate for ∂S/∂x, which we refer to as the “diagonal” estimate. For our estimate of ∂S/∂x, we used the average of the axial and diagonal estimates. The estimate for ∂S/∂y was obtained in analogous fashion to the estimate for ∂S/∂x. The magnitude of the gradient was then estimated using
| (2) |
(The gradient values presented here have been converted from dB per grid interval to dB/deg.)
As noted earlier, there are 32 locations in a 10-2 visual field which have data available for all 8 surrounding locations, and 12 locations which have data for 7 surrounding locations. For the 12 locations lacking data at one adjacent location, the formulas were slightly modified to allow for the omission of one point. For convenience, we will refer to these 44 locations as the “core” locations, and the estimates of gradients should be most reliable for those locations. Fig 1A shows an example of 10-2 data from one patient in this study; the 44 core locations are indicated by a heavy border.
Fig. 1.
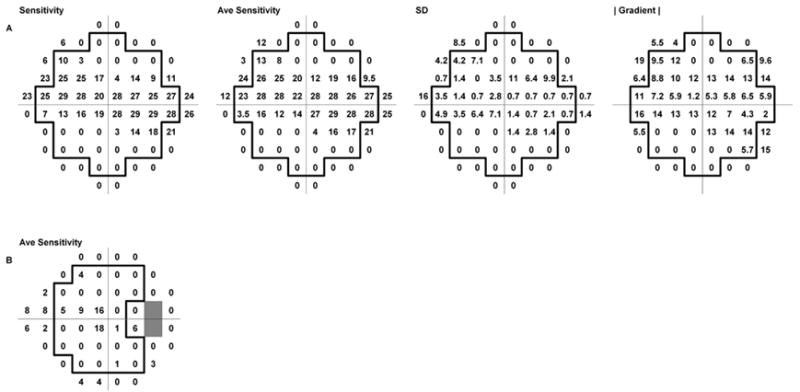
A. Visual field data (10-2 SITA Standard) from one eye of an 88 year old patient with glaucoma. Left to right: sensitivity data from a single visual field, averaged sensitivity data from 2 fields, the SD values for each test point, and the magnitude of the gradient determined from the average sensitivity data. (Decimal places are omitted, to improve readability.) The heavy outline indicates the 44 “core” test locations discussed in the text. B. 24-2 SITA Standard data from the same subject, showing the arrangement of test locations
In addition to the 44 core locations, it is possible to estimate gradients at other locations if fewer surrounding points are employed. The calculations are similar to those discussed above, except further modifications of the formulas are required. We have performed such gradient calculations in order to provide additional graphical information for illustrations; however for array comparisons (see below), we have only used the core locations. We did not use any test locations with fewer than 4 surrounding points in gradient calculations.
For 24-2 data, the situation is somewhat different. The two points adjacent to the horizontal at eccentricity 15 deg temporal, corresponding to the blind spot, are omitted. This, together with the layout of the 24-2 test array, restricts the number of locations which have data available from at least 7 of the 8 surrounding locations. We considered a “core” of 26 locations, indicated in Fig. 1B by the heavy border. As with 10-2 data, formulas for estimating the gradient at locations with fewer than 8 surrounding locations were modified to allow for missing adjacent points.
Array comparisons
These arrays were compared by determining the matrix correlation from the covariance matrix for pairs of arrays from an eye. The matrix correlation ρA,B is a scalar number (−1 ≤ ρ ≤ 1) that describes the similarity of a pair of matrices or arrays, A and B:
| (3) |
| (4) |
σA and σB are the standard deviations of the values in arrays A and B, respectively, and Aave and Bave are the means of the values in the arrays. Calculations were performed in Excel (Microsoft, Inc.), plotting was performed in SigmaPlot (SPSS, Inc.), and statistical calculations were performed in SigmaPlot and Statistica (StatSoft, Inc.). The correlations for the arrays were calculated using the correlation function provided in Excel.
Results
As expected from the inclusion criteria, all of the patients performed well on the visual fields. The average fixation loss rate was 5% (1st quartile = 0.0, median = 0.0, 3rd quartile = 6%). Fig. 1 shows a 10-2 visual field result from one patient. SD values were determined from the pair of fields and gradient values were determined from the average sensitivity data (see Methods). The upper row of contour plots in Fig. 2 shows average sensitivity, SD and |gradient| for the patient of Fig. 1. It may be seen that, although the variability plot bears a general geometric resemblance to the sensitivity plot, it looks considerably more like the gradient plot. The lower row of plots in Fig. 2 shows another example from 10-2 data. Again, the variability plot resembles the gradient plot more closely than it does the sensitivity plot.
Fig. 2.
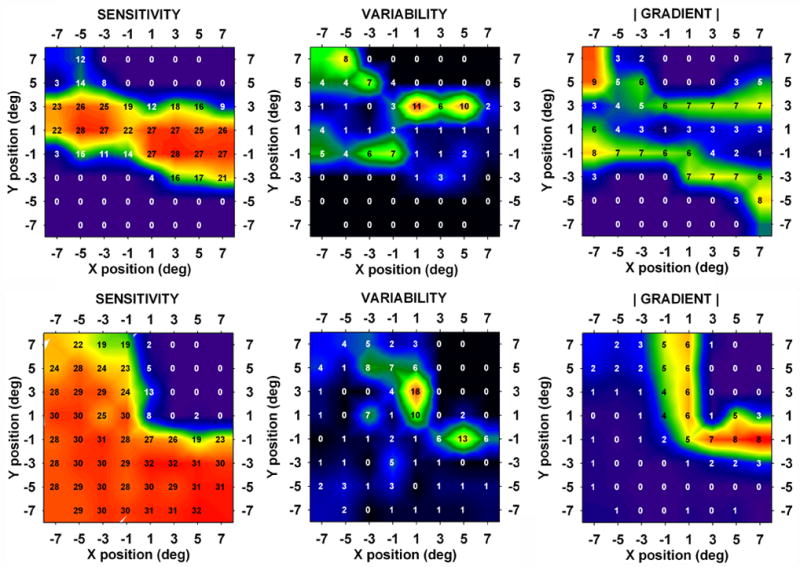
Contour plots of average sensitivity, variability (i.e., the SD) and |gradient|. Average sensitivity values are superimposed on the plots. Top row: patient of Fig. 1. Correlation (variability, |gradient|) = 0.651. Bottom row: Visual field data from a 68 year old patient with glaucoma. Correlation (variability, |gradient|) = 0.593.
Fig. 3 shows 10-2 data from the eye in the study that gave the lowest matrix correlation (−0.260) between variability and gradient. This negative correlation between variability and gradient was a unique occurrence in our 10-2 data; in the case of Fig. 3, it may be seen that most of the high variability and large gradient values lay outside of the “core” locations, and were therefore not included in the correlations (see Fig. 1 and Methods). However, the area of steep gradient did appear to be associated with a region of high variability; if the matrix correlation was extended to include all points for which gradients were calculated, the correlation between variability and gradient became 0.511.
Fig. 3.
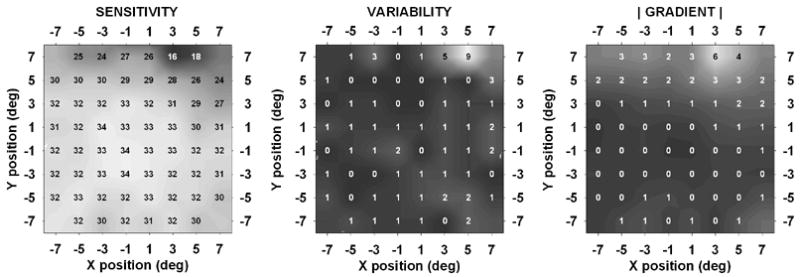
10-2 data from a 50 year old patient with glaucoma that gave the lowest observed correlation between variability and gradient (−0.260).
The general properties of the matrix correlations may be seen in Fig. 4, which is a histogram of the [variability, gradient] matrix correlations for the eyes in the study. The open bars show the distribution of values for 10-2 data; the filled bars show the distributions for 24-2 and 30-2 data for 20 of the 29 eyes. For 10-2 data, the correlation was 0.46 ± 0.24 (mean ± SD; significantly different from 0, p < 0.0001); for 24-2 data, it was 0.35 ± 0.32 (marginally different from 0). The results shown are for data from all 24-2 core locations; if only 24-2 core locations lying within 10 deg of fixation were considered, the correlations were similar but somewhat smaller: 0.24 ± 0.34.
Fig. 4.
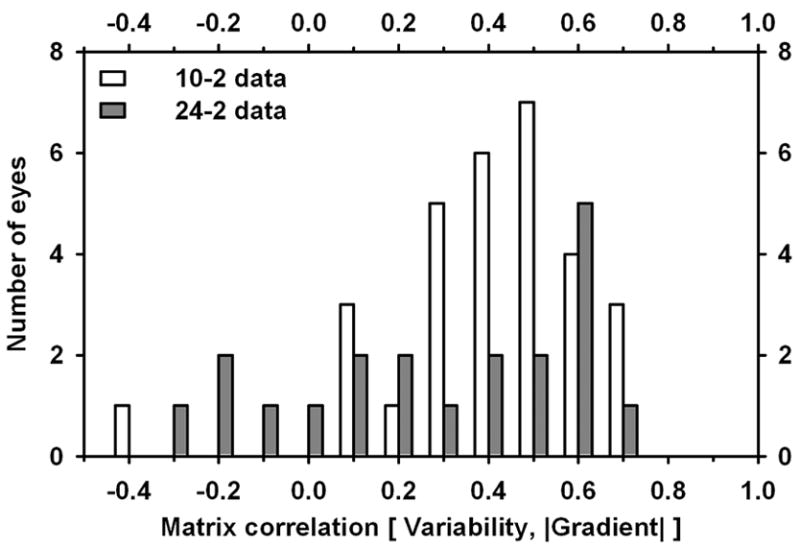
Histogram of values of Matrix correlation between variability and gradient for patients with glaucoma. Open bars: 10-2 data; filled bars: 24/30-2 data.
Fig. 5 shows scatterplots, for individual test locations, of variability vs. sensitivity (Fig. 5A) and variability vs. gradient (Fig. 5B–D). Fig. 5A shows a maximum around 10–15 dB as has been demonstrated by other workers; on the other hand, Fig. 5B shows variability increasing approximately linearly with gradient. The slope of the regression was 0.51 dB/(dB/deg), with correlation coefficient r = 0.42 (p < 0.0001). For 24-2 and 30-2 data, there were similar correlations for locations less than 10 deg from fixation (Fig. 5C: r = 0.23, p=0.001, regression slope 1.2 dB/(dB/deg)) and more than 10 deg from fixation (Fig. 5D: r = 0.47, p < 0.0001, regression slope 2.7 dB/(dB/deg)).
Fig. 5.
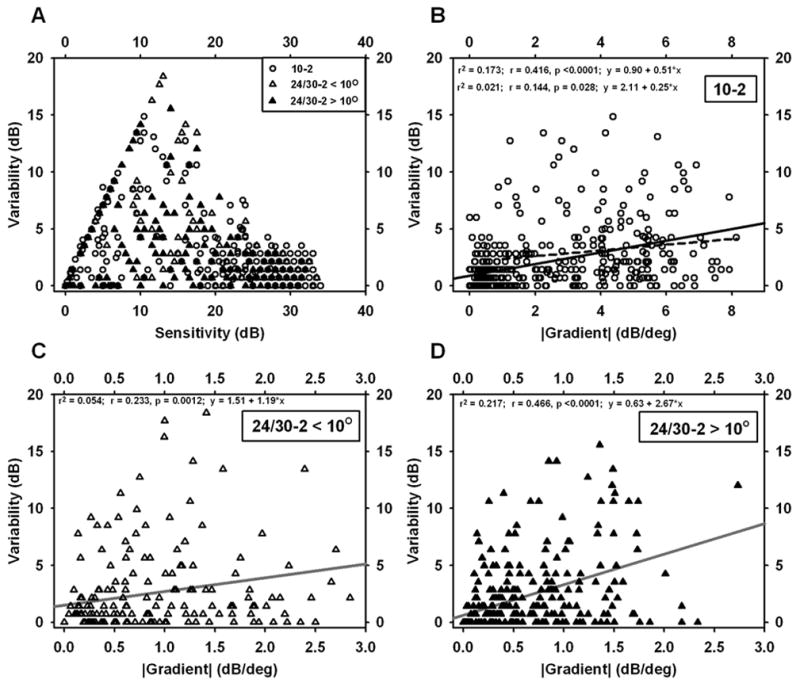
Scatterplots for individual test locations in visual fields of patients glaucoma. A. Variability vs. Sensitivity. B–D. Variability vs. |Gradient|. B. 10-2 data. C. 24-2 data for eccentricities < 10 deg. D. 24-2 data for eccentricities > 10 deg. Note the shorter gradient axis in C and D compared to B; gradients from 24-2 data were all < 3.0. Linear regressions are included in B–D; the dashed line in B is the regression after exclusion of points with gradients less than 1.
The correlations between variability and gradient, described in the preceding paragraph, are driven, to some extent, by a number of points for which both gradient and variability are near zero. (Many points in a scotoma with very low sensitivity have little variability – stimuli at that location are not seen – and, in the floor of a large scotoma, the gradient is small.) To assess the relationship without this influence, the regressions were repeated and points with gradient values less than either 0.5 or 1.0 dB/deg were excluded. For the 10-2 data, the relationship became r = 0.23, p < 0.0001, slope = 0.33 dB/(dB/deg) (excluding gradient < 0.5); r = 0.14, p = 0.028, slope = 0.25 dB/(dB/deg) (excluding gradient < 1.0). For 24/30-2 data less than 10 deg from fixation, the relationship was no longer significant when gradient values less than 0.5 or 1.0 were excluded. For 24/30-2 data more than 10 deg from fixation, the relationship became r = 0.22, p = 0.014, slope 2.0 dB/(dB/deg) (excluding gradient < 0.5); not significant (excluding gradient < 1.0). Thus, the 10-2 relationship remained significant (but weaker) when low-gradient locations were excluded and the 24/30-2 relationship became generally weak.
Relationship of correlations to visual field global measures
A further way of studying matrix correlations is to compare them to the global measure of Mean Deviation for each eye; this is shown in Fig. 62. In this part of the analysis, we calculated matrix correlations between variability and gradient, as before, and also the correlation between variability and sensitivity. (As discussed later, it is not really appropriate to look for a correlation with sensitivity, since the variability/sensitivity relationship is non-monotonic; however, the results are interesting enough to warrant inclusion.) The correlation with gradient remained quite high, on average, over most of the range of MD. The correlation of variability with sensitivity had negative values for large negative values of MD, passed through zero for moderate levels of MD, and had substantial positive values for eyes with relatively little damage. For very small values of MD – i.e., for nearly normal eyes – both relationships appear to become very noisy.
Fig. 6.
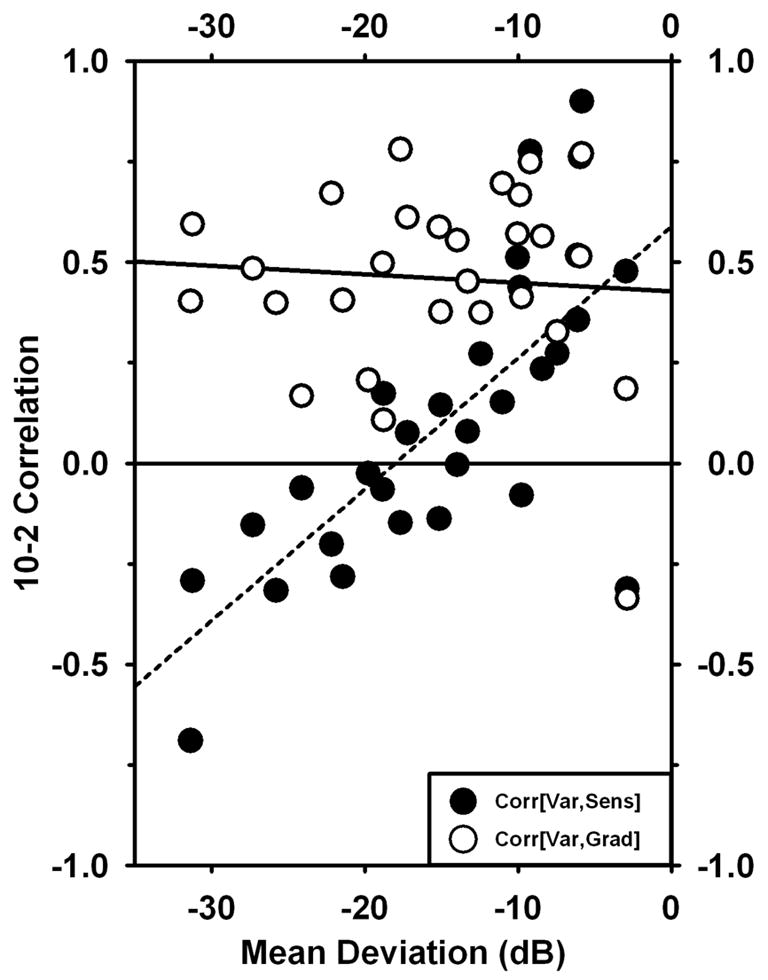
Matrix correlations based on 10-2 data plotted against Mean Deviation for the same eye. Filled circles represent correlations of Variability with −1*Sensitivity; open circles represent correlations of Variability with |gradient|.
Statistics of gradient measurements
Determination of the gradient of sensitivity in visual fields is central to the present findings, and it is therefore useful to consider the distribution of gradients observed. Fig. 7 shows histograms of the gradients determined from 10-2 data, 24-2 data (eccentricities < 10 deg) and 24-2 data (eccentricities > 10 deg). There was a large difference between 10-2 and 24-2 data, and a moderate dependence on eccentricity for the 24-2 data. (For 10-2, 24-2<10 deg, and 24-2>10 deg, the means were 2.2, 0.8, and 0.5 dB/deg.
Fig. 7.
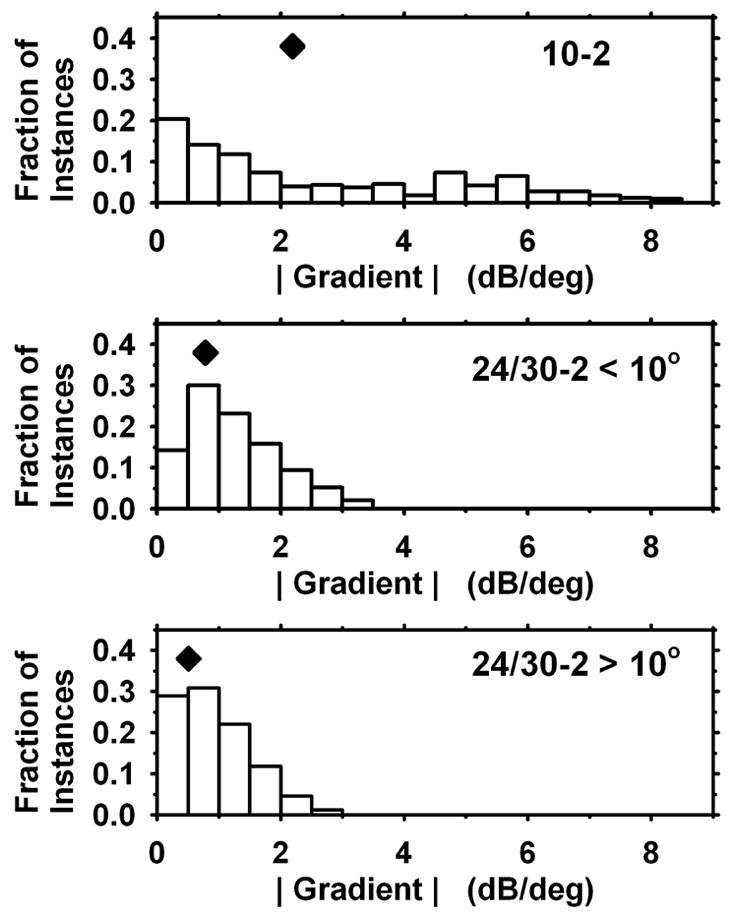
Distributions of gradient values determined for 10-2 data (top), 24-2 data for eccentricities < 10 deg (middle), and 24-2 data for eccentricities > 10 deg (bottom). Diamonds indicate mean values.
Normal Subjects
The results for younger normal subjects and older normal subjects were very similar, and are summarized in Fig. 8, which shows the data for each of the two groups “folded” by averaging into one half-quadrant. There are several significant aspects of these results: (a) The older subjects were slightly less sensitive than the younger (average difference 1.5 dB), most notably at the four locations nearest to the fovea, where the difference between the two groups was 2.5 dB. (b) Variability did not appear to vary systematically with eccentricity. The older subjects were very slightly more variable than the younger (average difference 0.1 dB). (c) The gradient was similar for the two groups, with average value 0.7 dB/deg. However, the gradient in both groups was somewhat smaller at the most central 4 locations than elsewhere, indicating that the hill of vision is a little flatter at 1 deg eccentricity than it is more eccentrically.
Fig. 8.
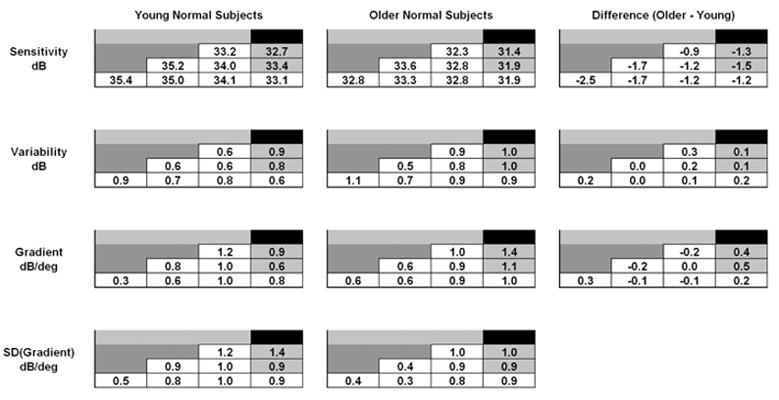
Average sensitivity, variability, and gradient values for young normal subjects (left column) and older normal subjects (middle column). Values have been averaged into one half-quadrant. Values in open cells are for core locations (compare to Fig. 1A). Differences between the two groups are shown in the right column.
Discussion
In general, variability was found to correlate with the gradient of sensitivity, particularly for 10-2 data. The regression in Fig. 5B has a slope of approximately ½ dB/(dB/deg) = ½ deg. In principal, such a slope could be produced if fixational eye movements had a characteristic extent, in the direction of the field gradient, of approximately ½ deg. Somewhat more generally, if eye position can be thought of as normally distributed about the fixation target with standard deviation equal to SDe (in the x-direction, for simplicity); if the sensitivity at a given x position, x0, equals S0; and if the x-direction slope of sensitivity at x0 equals (∂S/∂x)0, then the measured sensitivity at x0 would be normally distributed about S0 with standard deviation equal to SDe*(∂S/∂x)0. Together with the results of Fig. 5B, this suggests that the average variability of eye position during the present visual field determinations was approximately 0.5 deg in the direction of the field gradient. If eye position is normally distributed with standard deviation SDe in the x-direction, then the average magnitude of displacement in the x-direction would be approximately ⅔ * SDe. The smaller slope of the dashed regression line in Fig. 5B (0.25 dB/deg; points with gradient less than 1.0 excluded) would suggest a narrower distribution of eye position than the full regression.
If the linear regressions of Fig. 5B are interpreted as suggesting a contribution to variability from eye movements, then the y-intercepts would indicate an “intrinsic” level of variability that is not dependent on eye movements. Depending on the choices made regarding exclusion of data with near-zero gradient values (see Results), the intercept is 1–2 dB. This compares reasonably well with the average value of variability in the normal subjects, which was 0.8–0.9 dB for both young and older subjects.
Henson et al (Henson, Evans, Chauhan & Lane, 1996, Henson, Evans & Lane, 1994) found average extent of “fixation loss” during perimetry to be 0.5–2 deg, varying with subject, which is consistent with an SD of 0.75–3 deg. Demirel and Vingrys (Demirel & Vingrys, 1992) found that fixation spent 50% of the time within approximately 1.5 deg of the target, suggesting an SD of about 2.2 deg. If these fixation errors were distributed equally in all directions, this would suggest an average magnitude in a given direction of 2/π times the SD in the x-y plane, or about 0.5–2 deg. These considerations make it plausible that fixational eye movements could account for a significant component of the observed variability. To assess this possibility more fully, simultaneous visual field testing and eye-position measurement are necessary, and we have begun conducting such a study.
Although the present results are consistent with an interpretation based on eye movements, other interpretations of the gradient/variability correlation are possible. For example, if regions of steep gradient represent boundary zones between relatively healthy visual field and badly damaged visual field, the ganglion cells serving such zones might be maximally variable in their behavior. We have no direct evidence for or against such a hypothesis; however, the correlation observed between gradient and variability on a pointwise basis, and the amplitudes of eye movements observed during perimetry, are consistent with the possibility that eye movements could underlie a significant amount of the observed variability.
Henson and Bryson (1991), following similar reasoning, hypothesized that fixation inaccuracy could cause a significant proportion of variability in glaucomatous scotomas. However, Henson et al. (1996) subsequently rejected this hypothesis because fixation accuracy was not related to variability and variability was not reduced when fixation errors in excess of 60 minutes of arc were removed. Our analysis indicates that variability can be produced by normal fixational eye movements (less than 60 minutes of arc), rather than fixation errors, so there need not be a strong relation between fixation errors and variability.
In addition, we have been studying sensitivity, variability and gradient near the edge of the blind spot in healthy eyes, and we have observed a relationship very similar to that reported here for cases of glaucomatous damage (Wyatt, Lam, Chan, Swanson & Dul, “Retest variability is correlated with gradient of the visual field near the normal physiological blind spot”, Annual meeting of American Academy of Optometry, December, 2006). Haefliger & Flammer (1989) proposed that increased short-term fluctuations in glaucomatous defects were related to the fact that the measurements were made at the edge of a scotoma. Subsequently, they rejected this notion because they found less variability at the edge of the blind spot (sensitivity SD range1.5 to 5 dB) than at the edges of glaucomatous defects (2 to 15 dB), even though the slope of sensitivity was at least as steep at the former as at the latter (Haefliger & Flammer, 1991). The slopes observed by Haefliger & Flammer at the edge of the blind spot (Fig. 3 of Haefliger & Flammer, 1989; Fig. 1 of Haefliger & Flammer, 1991) were very steep – up to 15 dB/deg – so it is hard to imagine that still steeper slopes were present but not observed. The slopes at the edges of glaucomatous defects in their work appear to have ranged from 6 to 15 dB/deg, based on their Fig. 1 (Haefliger & Flammer, 1991). Since their choice of contour for glaucoma patients was based on coarse-grid visual fields, it is possible that steeper slopes may have been present along contours with other orientations. However, 6–15 dB/deg is as steep as the slopes we have found (Fig. 7). One possibility is that the fixational eye movements of the patients in whom Haefliger & Flammer studied field defects may have been larger than those of the control subjects in whom they studied the blind spot. It is worth noting that they originally observed somewhat greater variability at the edges of the blind spot (2 to 7 dB). If the interaction between eye movement and gradient is a major cause of variability, both eye movement and gradient are critical. With slopes as steep as 15 dB/deg, a 1 deg eye movement can change sensitivity by 15 dB.
Test-retest variability resulting from eye movements and from other causes
The analysis at the beginning of the Discussion permits an approximate statement regarding variability of eye position, gradient of visual field sensitivity, and variability. If one assumes that variability results from “intrinsic” variability (not dependent on eye position) together with a component related to eye position, as described, the combined SD would be approximately (S02 + (SEM × G)2)0.5, where S0 is the SD due to intrinsic variability, SEM is the SD of eye position parallel to the gradient, and G is the local magnitude of the gradient. Generally, variability related to eye movements would be expected to be significant when (SEM × G) ≥ S0. The results from the normal subjects suggest that S0 ~ 1 dB. Given that the gradient in normal eyes in the central 10 deg is approximately 1 dB/deg, this would mean that in normal eyes, eye position would have to vary by at least 1 deg to generate variability comparable to the intrinsic variability. In addition to these considerations, it is possible that S0 could increase in damaged areas of the visual field in glaucomatous eyes.
If fixational eye movements, interacting with sensitivity gradients, are partly responsible for the high observed variability in glaucomatous eyes, then field areas in glaucomatous eyes which have abnormally low sensitivity (where variability is generally regarded as high), but which are also relatively level should show relatively low variability. It turns out that level but depressed regions are fairly uncommon in the eyes of patients we have studied. We searched the “core” test locations in our 10-2 results for locations with sensitivity between 10 and 23 dB and gradient less than 2 dB/deg; we found 22 such locations out of 29 × 44 = 1276 locations. The average sensitivity at these locations was 18.5 dB (1st quartile 15.3 dB; median 19.0 dB; 3rd quartile 21.9 dB) and the average gradient was 1.1 dB/deg (1st quartile 0.6 dB/deg; median 1.1 dB/deg; 3rd quartile 1.4 dB/deg). The average variability was 2.7 dB (1st quartile 0.9 dB; median 1.8 dB; 3rd quartile 2.8 dB). The average variability at all 197 locations with sensitivity in the same range was 4.6 dB, and the average variability at the 175 locations with gradient 2 was 6.0 dB. This provides some support for the suggestion that steeper gradients and greater variability are linked; it also provides a possible explanation for the large range of variabilities at test locations where sensitivity is in the mid-range (Fig. 5A).
Fig. 9 shows data from one subject who had six locations of the type described above, with low sensitivity and low gradient. These locations, indicated by the outlines superimposed on the graphs, had average sensitivity = 21.4 dB, average gradient = 0.7 dB/deg, and average variability = 1.1 dB.
Fig. 9.
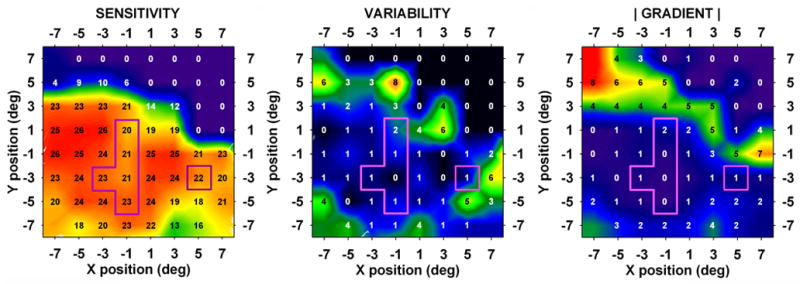
Results from a 67 year old patient with glaucoma. This eye had six core test locations with sensitivity in the low-sensitivity/low-gradient class (see text).
A further possible contribution to test-retest variability in conventional perimetry in areas of steep gradients could result from the nature of test protocols. The Humphrey Field Analyzer used in the present study employs a “growth pattern” in both SITA standard and Full Threshold testing: four primary locations are tested first, and initial stimulus values for neighboring locations are based on the results at the primary locations (Anderson & Patella, 1999). If a primary location lies near a scotoma edge, then the initial estimates for neighboring points may lie far from the final values. Since the distance between starting stimulus and final value has been shown to affect variability (Malik, Swanson & Garway-Heath, 2006, Spenceley & Henson, 1996, Swanson & Birch, 1992, Turpin, McKendrick, Johnson & Vingrys, 2003), this could potentially lead to increased variability near scotoma edges. However, Pan, Swanson and Dul (2006) assessed test-retest variability on a custom station, with all staircases beginning at maximum available contrast (minimizing the distance between starting and final values in areas of damage); they still found that variability was greatest in damaged areas, as has been found with conventional perimetric instrumentation. Thus, we believe that this is not a major factor in the present results.
24-2 data vs. 10-2 data
What is the cause of the smaller matrix correlation of variability with gradient in the case of 24-2 data? It seems unlikely that genuine differences in variability at individual test locations would exist for the two field types, especially for 24-2 test points with eccentricities less than 10 deg, which lie within the territory 10-2 tests. The cause seems more likely to be related to the gradients, or at least to the evaluation of the gradients. The results of Fig. 7 indicated that determination of gradients in the same eyes give different results when they are based on 24-2 vs. 10-2 data. (The striking difference between the two can also be stated in the following way: one-third of the gradients based on 10-2 data were greater than 3 dB/deg, but none of the gradients based on 24-2 data were greater than 3 dB/deg.) It is hardly likely that there was an actual difference between the distributions of retinal sensitivity, given that the same eyes were studied. Thus, the apparent differences probably result from the nature of the visual field data and the calculation of gradients. The major difference is the 2 deg spacing of test points for 10-2 fields compared to the 6 deg spacing for 24-2 and 30-2 fields.
The way in which grid spacing can affect gradient calculation is apparent if one considers the case of a “cliff” of visual sensitivity – for example, a change of 12 dB occurring over a retinal distance of 2 deg. The gradient calculated from 24-2 data can be no larger than (12dB / 6deg) = 2 dB/deg. On the other hand, for 10-2 data, the identical retina can give values as large as (12dB / 2deg) = 6 dB/deg. The mean gradients measured (Fig. 7), averaging together all 24-2 eccentricities, are 2.2 for 10-2 data vs. 0.6 for 24-2 data, a factor of about 3.5. If actual gradients extend uniformly over many degrees, then both types of field data should give approximately the same calculated values; the differences in Fig. 7 are consistent with most gradients extending over less than 6 deg and closer to 2 deg.
To sum up so far, it is suggested that test-retest variability depends in significant part on fixational eye movements shifting the test stimulus on the retina from trial to trial, and that the gradient of sensitivity normal to a movement will be the key quantity determining change in threshold. It is further suggested that differences in correlation between variability and field gradient, that depend on the type of field, are likely to result in considerable part from differences in calculated, rather than true, gradients. Coarser test grids, as used in 24-2 test patterns, may undersample the field to the extent that the actual gradient cannot be recovered.
One appealing aspect of a possible functional relationship between variability and field gradient is that the relationship is monotonic, as opposed to the relationship between variability and sensitivity. In fact, if variability is correlated with the gradient, then a scatterplot of variability vs. sensitivity would actually be expected to have a maximum at intermediate sensitivities. (Approximately speaking, a high-sensitivity plateau would have little slope and little variability, as would a low-sensitivity plateau; however, in regions of changing sensitivity — where gradients and therefore variability are large — the sensitivity would be likely to have an intermediate value.) In Fig. 10, this is demonstrated for the 10-2 data; the data for individual test locations (Fig. 5A, circles) have been grouped into sensitivity bins and averaged (Fig. 10, circles). Plotted alongside are the values of gradients from the same locations in the same fields, grouped into the same groups according to sensitivity, and averaged (Fig. 10, triangles). Also shown (filled squares) are data from a study of variability in 24-2 fields (Artes, Henson, Harper & McLeod, 2003) adapted from their Fig. 6.
Fig. 10.
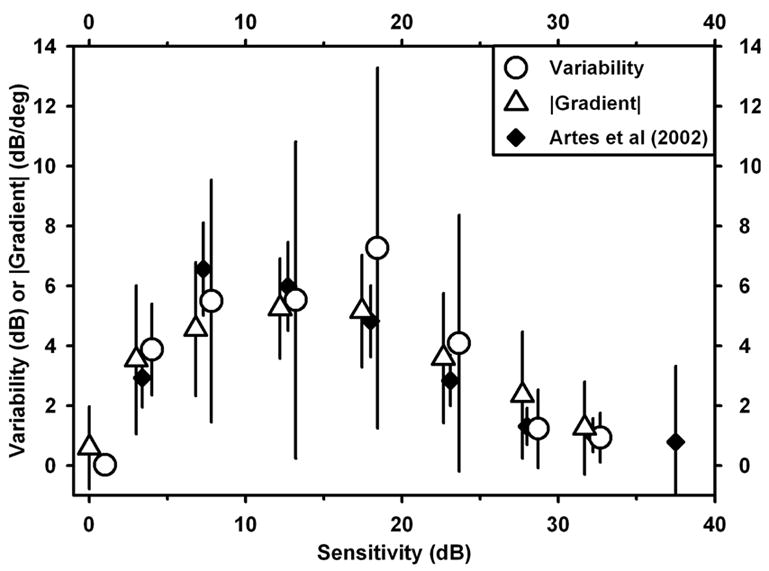
Comparison of variability data from individual test locations in 10-2 fields, grouped by sensitivity, together with magnitude of gradient for the same data grouped by sensitivity. Also shown for comparison are the variability vs. sensitivity data from Artes et al (2002) for 24-2 data, based on their Fig. 6.
Stimulus size
It has been observed that larger stimuli lead to reduced variability in perimetry (Wall et al., 1997). Although other mechanisms besides fixational eye movements may certainly be involved, it is worth considering those observations in the context of the present findings. To the extent that a stimulus may be considered a “point”, an eye movement should change sensitivity by an amount equal to the dot-product of the eye movement vector and the gradient of sensitivity. For a given amplitude of eye movement, the sensitivity change cannot exceed the movement amplitude times the magnitude of the gradient; however, depending on the relative direction, the change in sensitivity could be anywhere in the range −1 to +1 times the magnitude of the gradient. The effect of increasing stimulus size would depend on how larger stimuli are detected. If, for example, signals are averaged, summed, or otherwise combined over the stimulus area, fixational eye movements would have less effect with larger stimuli because there would be more overlap of stimulated areas at the beginning and end of an eye movement of a given amplitude. (Additionally, if there are fine scale spatial fluctuations in sensitivity present, combining signals over a large area could have a smoothing effect, even without eye movements.)
Interaction of eye movements, visual field, and visual field test procedure
The discussion, above, of eye movements and test-retest variability has implicitly treated the determination of sensitivity at each test location as if eye movements do not intervene between the stimuli presented at that location. In an actual visual field test, the sensitivity recorded at a given location is the result of a series of test flash luminances (typically 3–5) presented at that nominal location. Since eye position varies from moment to moment, the test flashes at one nominal location during one session will be distributed on the retina by eye movements. In theory, if a (non-fatiguing) patient were run for a very long session, with the sensitivity at each location based on many staircase reversals, the effects of eye movements would be less. However, in clinical testing, staircases are relatively short and generally end after 2 reversals. Depending on the details of odd or even starting luminance, distance between starting luminance and actual threshold, and the distribution of sensitivity at each nominal location, it is possible to have SD’s of thresholds, determined at different times at the same nominal location, as large as the SD of sensitivity at the location (Artes et al., 2003, Malik et al., 2006, Pan et al., 2006). Thus, while it is a simplification to treat one threshold as a sample of a distribution of sensitivities, it does not greatly misrepresent the probabilistic nature of the sampling with a staircase as employed in visual field testing.
Sampling grids
The present findings are consistent with the concept that the 6 deg sampling grids employed in 24-2 perimetry may be too coarse to successfully characterize the gradient of field sensitivity. The Nyquist criterion for sampling waveforms requires that the spatial wavelength of the fluctuation being characterized must be at least 2 sampling intervals long. It is not surprising that a 24-2 grid cannot capture field details accurately, since inspection of 10-2 fields reveals that fluctuations can often have characteristic spatial extents much smaller than 12 deg. (It is worth noting related findings that finer test grids may be capable of detecting localized field defects sometimes missed with coarser grids (Schiefer, Flad, Stumpp, Malsam, Paetzold, Vonthein, Denk & Sample, 2003) or of revealing inhomogeneities in some glaucomatous eyes (Fellman, Lynn, Starita & Swanson, 1990).) A question arises as to whether fluctuations on a still finer scale can also occur — too fine to be captured by the 10-2 grid. To the extent that there may be still finer-scale fluctuations, they would not be characterized by 10-2 testing, and that would lead to similar distortions.
Relationship of the present results to the “floor effect” in visual field testing
In visual field testing, a finding of “<0” means that the patient failed to detect all available stimuli at the given location. This does not imply that the retina is equally sensitive at all such locations; the actual sensitivity could lie just below the level for which the test system could provide a detectable stimulus, or it could lie far below that level. Thus, there can be a gradient of true retinal sensitivity in parts of the visual field that give nominally constant values of “<0” in perimetry. However, that does not invalidate the present analysis: it is only the gradient of sensitivity within the measurable range of sensitivity that is of concern here. For example, if there were a steep gradient of true sensitivity, with all points having perimetric sensitivities of “<0”, then a small eye movement could create a large change in true sensitivity. However, since even the most sensitive location that the stimulus could fall on would still have a measured sensitivity “<0”, the large change would not be observable.
Assessment of variability from two visual fields
In the present work, we have used two visual field determinations to estimate variability and average sensitivity, and the gradient was determined from the latter. This proved to be adequate to make a case for a role played by the gradient. In clinical settings, it has been found that three fields give a significantly more reliable determination of abnormality than two fields (Keltner, Johnson, Levine, Fan, Cello, Kass & Gordon, 2005). The worst consequence of using fewer than three fields in the present work would be that greater variability might make it difficult to interpret the results, but this appears not to have been the case. As noted below, an increased number of fields would only be likely to increase the clarity of the results. It is in fact possible that the weaker correlations found between variability and gradient (both for pointwise correlations as in Fig. 5B and for matrix correlation as in Fig. 6) for eyes with less damage (discussed earlier) might be improved by an increased number of field determinations.
A reasonable criticism of the present work is that the 24-2 data were obtained under less rigorous circumstances with respect to visual field dates than the 10-2 data, and that all eyes were not included in the 24-2 dataset. Although these are valid concerns, the analysis techniques employed here appear to be surprisingly robust with respect to such experimental details. For example, 10-2 fields were also obtained from the same eyes studied in the present work, but with dilated pupils. The correlations were, if anything, stronger when the undilated and dilated data were pooled. Similarly, when a substantial number of fields were obtained from a large number of patients’ records, with each patient’s fields separated by periods of months to years, the sets of correlations based on 10-2 data and 24-2 data were remarkably similar to those obtained in the present work. It is our suggestion, therefore, that the present findings may apply over a wide range of situations.
Acknowledgments
Supported by NIH grants NEI R03-EY014549 (Wyatt), R01-EY007716 (Swanson) and the Glaucoma Institute of SUNY.
Footnotes
The three sensitivity values (S−1, S0 and S+1) give three equations in three unknowns for the constants in the parabola F(x) = a + bx + cx2. Solving for b gives b = (S+1 − S−1)/2. The derivative of the parabola, dF/dx, evaluated at x=0, is equal to b.
“Mean Deviation” (MD) is a global measure or index of deviation from normality, based on a reference set of data for normal eyes; it is commonly used in clinical descriptions of the mean level of a patient’s visual field. The plots and correlations of Fig. 6 were very similar if mean sensitivity was used instead of MD.
Publisher's Disclaimer: This is a PDF file of an unedited manuscript that has been accepted for publication. As a service to our customers we are providing this early version of the manuscript. The manuscript will undergo copyediting, typesetting, and review of the resulting proof before it is published in its final citable form. Please note that during the production process errors may be discovered which could affect the content, and all legal disclaimers that apply to the journal pertain.
References
- Anderson DR, Patella VM. Automated Static Perimetry. St. Louis: Mosby-Year Book; 1999. [Google Scholar]
- Artes PH, Henson DB, Harper R, McLeod D. Multisampling suprathreshold perimetry: a comparison with conventional suprathreshold and full-threshold strategies by computer simulation. Invest Ophthalmol Vis Sci. 2003;44 (6):2582–2587. doi: 10.1167/iovs.02-1036. [DOI] [PubMed] [Google Scholar]
- Artes PH, Hutchison DM, Nicolela MT, LeBlanc RP, Chauhan BC. Threshold and variability properties of matrix frequency-doubling technology and standard automated perimetry in glaucoma. Invest Ophthalmol Vis Sci. 2005;46 (7):2451–2457. doi: 10.1167/iovs.05-0135. [DOI] [PubMed] [Google Scholar]
- Blumenthal EZ, Sapir-Pichhadze R. Misleading statistical calculations in far-advanced glaucomatous visual field loss. Ophthalmology. 2003;110 (1):196–200. doi: 10.1016/s0161-6420(02)01297-6. [DOI] [PubMed] [Google Scholar]
- Chauhan B, Johnson C. Test-retest variability of frequency-doubling perimetry and conventional perimetry in glaucoma patients and normal subjects. Investigative Ophthalmology Visual Sci. 1999;40:648–656. [PubMed] [Google Scholar]
- Demirel S, Johnson CA, Fendrich R, Vingrys A. The slope of frequency-of-seeing curves in normal, amblyopic and pathologic vision. JOSA Technical Digest Series. 1997:244–247. [Google Scholar]
- Demirel S, Vingrys A. Fixational instability during perimetry and the blindspot monitor. In: Mills R, editor. Perimetry Update 1992/93. Proceedings of the Xth International Perimetric Society Meeting. Amsterdam: Kugler; 1992. pp. 515–520. [Google Scholar]
- Fellman R, Lynn J, Starita R, Swanson W. Clinical importance of spatial summation in glaucoma. In: Heijl A, editor. Perimetry Update 1988/89. Proceedings of the VIIIth International Perimetric Society Meeting. Amsterdam: Kugler & Ghedini; 1990. pp. 313–324. [Google Scholar]
- Flammer J, Drance SM, Zulauf M. Differential light threshold. Short- and long-term fluctuation in patients with glaucoma, normal controls, and patients with suspected glaucoma. Arch Ophthalmol. 1984;102 (5):704–706. doi: 10.1001/archopht.1984.01040030560017. [DOI] [PubMed] [Google Scholar]
- Haefliger IO, Flammer J. Increase of the short-term fluctuation of the differential light threshold around a physiologic scotoma. Am J Ophthalmol. 1989;107 (4):417–420. doi: 10.1016/0002-9394(89)90667-3. [DOI] [PubMed] [Google Scholar]
- Haefliger IO, Flammer J. Fluctuation of the differential light threshold at the border of absolute scotomas. Comparison between glaucomatous visual field defects and blind spots. Ophthalmology. 1991;98 (10):1529–1532. doi: 10.1016/s0161-6420(91)32093-1. [DOI] [PubMed] [Google Scholar]
- Heijl A, Lindgren A, Lindgren G. Test-retest variability in glaucomatous visual fields. Am J Ophthalmol. 1989;108:130–135. doi: 10.1016/0002-9394(89)90006-8. [DOI] [PubMed] [Google Scholar]
- Heijl A, Lindgren G, Olsson J. Normal variability of static perimetric threshold values across the central visual field. Arch Ophthalmol. 1987;105 (11):1544–1549. doi: 10.1001/archopht.1987.01060110090039. [DOI] [PubMed] [Google Scholar]
- Henson DB, Bryson H. Is the variability in glaucomatous field loss due to poor fixation control? In: Mills R, Heijl A, editors. Perimetry Update 1990/91. Proceedings of the IXth International Perimetric Society Meeting. Amsterdam: Kugler; 1990. pp. 217–220. [Google Scholar]
- Henson DB, Chaudry S, Artes PH, Faragher EB, Ansons A. Response variability in the visual field: comparison of optic neuritis, glaucoma, ocular hypertension, and normal eyes. Invest Ophthalmol Vis Sci. 2000;41 (2):417–421. [PubMed] [Google Scholar]
- Henson DB, Evans J, Chauhan BC, Lane C. Influence of fixation accuracy on threshold variability in patients with open angle glaucoma. Invest Ophthalmol Vis Sci. 1996;37 (2):444–450. [PubMed] [Google Scholar]
- Henson DB, Evans J, Lane C. Fixation accuracy of patients with glaucoma during full threshold perimetry. In: Mills R, Wall M, editors. Perimetry Update 1994/95. Proceedings of the XIth International Perimetric Society Meeting. Amsterdam: Kugler; 1994. [Google Scholar]
- Keltner JL, Johnson CA, Levine RA, Fan J, Cello KE, Kass MA, Gordon MO. Normal visual field test results following glaucomatous visual field end points in the Ocular Hypertension Treatment Study. Arch Ophthalmol. 2005;123 (9):1201–1206. doi: 10.1001/archopht.123.9.1201. [DOI] [PMC free article] [PubMed] [Google Scholar]
- Lewis R, Johnson C, Keltner J, Labermeier P. Variability of quantitative automated perimetry in normal observers. Ophthalmology. 1986;93:878–881. doi: 10.1016/s0161-6420(86)33647-9. [DOI] [PubMed] [Google Scholar]
- Malik R, Swanson WH, Garway-Heath DF. Development and evaluation of a linear staircase strategy for the measurement of perimetric sensitivity. Vision Res. 2006;46 (18):2956–2967. doi: 10.1016/j.visres.2006.03.004. [DOI] [PMC free article] [PubMed] [Google Scholar]
- Pan F, Swanson WH, Dul MW. Evaluation of a two-stage neural model of glaucomatous defect: an approach to reduce test-retest variability. Optom Vis Sci. 2006;83 (7):499–511. doi: 10.1097/01.opx.0000225091.60457.f4. [DOI] [PMC free article] [PubMed] [Google Scholar]
- Piltz J, Starita R. Test-retest variability in glaucomatous visual fields. Am J Ophthalmol. 1990;109 (1):109. [PubMed] [Google Scholar]
- Schiefer U, Flad M, Stumpp F, Malsam A, Paetzold J, Vonthein R, Denk PO, Sample PA. Increased detection rate of glaucomatous visual field damage with locally condensed grids: a comparison between fundus-oriented perimetry and conventional visual field examination. Arch Ophthalmol. 2003;121 (4):458–465. doi: 10.1001/archopht.121.4.458. [DOI] [PubMed] [Google Scholar]
- Spenceley SE, Henson DB. Visual field test simulation and error in threshold estimation. Br J Ophthalmol. 1996;80 (4):304–308. doi: 10.1136/bjo.80.4.304. [DOI] [PMC free article] [PubMed] [Google Scholar]
- Spry P, Johnson C, Mckendrick A, Turpin A. Variability components of standard automated perimetry and frequency-doubling technology perimetry. Investigative Ophthalmology Visual Sci. 2001;42:1404–1410. [PubMed] [Google Scholar]
- Swanson WH, Birch EE. Extracting thresholds from noisy psychophysical data. Perception & Psychophysics. 1992;51:409–422. doi: 10.3758/bf03211637. [DOI] [PubMed] [Google Scholar]
- Turpin A, McKendrick AM, Johnson CA, Vingrys AJ. Properties of perimetric threshold estimates from full threshold, ZEST, and SITA-like strategies, as determined by computer simulation. Invest Ophthalmol Vis Sci. 2003;44 (11):4787–4795. doi: 10.1167/iovs.03-0023. [DOI] [PubMed] [Google Scholar]
- Wall M, Kutzko K, Chauhan B. Variability in patients with glaucomatous visual field damage is reduced using size V stimuli. Investigative Ophthalmology Visual Sci. 1997;38:426–435. [PubMed] [Google Scholar]


