

Abstract
Harmonic complex tones elicit a pitch sensation at their fundamental frequency (F0), even when their spectrum contains no energy at F0, a phenomenon known as “pitch of the missing fundamental.” The strength of this pitch percept depends upon the degree to which individual harmonics are spaced sufficiently apart to be “resolved” by the mechanical frequency analysis in the cochlea. We investigated the resolvability of harmonics of missing-fundamental complex tones in the auditory nerve (AN) of anesthetized cats at low and moderate stimulus levels and compared the effectiveness of two representations of pitch over a much wider range of F0s (110–3,520 Hz) than in previous studies. We found that individual harmonics are increasingly well resolved in rate responses of AN fibers as the characteristic frequency (CF) increases. We obtained rate-based estimates of pitch dependent upon harmonic resolvability by matching harmonic templates to profiles of average discharge rate against CF. These estimates were most accurate for F0s above 400–500 Hz, where harmonics were sufficiently resolved. We also derived pitch estimates from all-order interspike-interval distributions, pooled over our entire sample of fibers. Such interval-based pitch estimates, which are dependent on phase-locking to the harmonics, were accurate for F0s below 1,300 Hz, consistent with the upper limit of the pitch of the missing fundamental in humans. The two pitch representations are complementary with respect to the F0 range over which they are effective; however, neither is entirely satisfactory in accounting for human psychophysical data.
INTRODUCTION
A harmonic complex tone is a sound consisting of frequency components that are all integer multiples of a common fundamental (F0). The pitch elicited by a harmonic complex tone is normally very close to that of a pure tone at the fundamental frequency, even when the stimulus spectrum contains no energy at that frequency, a phenomenon known as “pitch of the missing fundamental.”
Investigating the neural mechanisms underlying the perception of the pitch of harmonic complex tones is of great importance for a variety of reasons. Changes in pitch convey melody in music, and the superposition of different pitches is the basis for harmony. Pitch has an important role in speech, where it carries prosodic features and information about speaker identity. In tone languages such as Mandarin Chinese, pitch also cues lexical contrasts. Pitch plays a major role in auditory scene analysis: differences in pitch are a major cue for sound source segregation, while frequency components that share a common fundamental tend to be grouped into a single auditory object (Bregman 1990; Darwin and Carlyon 1995).
Pitch perception with missing fundamental stimuli is not unique to humans; it also occurs in birds (Cynx and Shapiro 1986) and nonhuman mammals (Heffner and Whitfield 1976; Tomlinson and Schwartz 1988), making animal models suitable for studying neural representations of pitch. Pitch perception mechanisms in animals may play a role in processing conspecific vocalizations, which often contain harmonic complex tones.
The neural mechanisms underlying pitch perception of harmonic complex tones have been at the center of a debate among scientists for over a century (Ohm 1843; Seebeck 1841). This debate arises because the peripheral auditory system provides two types of cues to the pitch of complex tones: place cues dependent upon the frequency selectivity and tonotopic mapping of the cochlea and temporal cues dependent on neural phase locking.
The peripheral auditory system can be thought of as containing a bank of band-pass filters representing the mechanical frequency analysis performed by the basilar membrane. When two partials of a complex tone are spaced sufficiently apart relative to the auditory filter bandwidths, each of them produces an individual local maximum in the spatial pattern of basilar membrane motion. In this case, the two harmonics are said to be “resolved” by the auditory periphery. On the other hand, when two or more harmonics fall within the pass-band of a single peripheral filter, they are said to be “unresolved.” Because the bandwidths of the auditory filters increase with their center frequency, only low-order harmonics are resolved. Based on psychophysical data, the first 6–10 harmonics are thought to be resolved in humans (Bernstein and Oxenham 2003b; Plomp 1964).
When a complex tone contains resolved harmonics, its pitch can be extracted by matching the pattern of activity across a tonotopic neural map to internally stored harmonic templates (Cohen et al. 1994; Goldstein 1973; Terhardt 1974; Wightman 1973). This type of model accounts for many pitch phenomena, including the pitch of the missing fundamental, the pitch shift associated with inharmonic complexes, and the pitch ambiguity of complex tones comprising only a few harmonics. However, a key issue in these models is the exact nature of the neural representation upon which the hypothetical template matching mechanism operates.
Pitch percepts can also be produced by complex tones consisting entirely of unresolved harmonics. In general, though, these pitches are weaker and more dependent on phase relationships among the partials than the pitch based on resolved harmonics (Bernstein and Oxenham 2003b; Carlyon and Shackleton 1994; Houtsma and Smurzynski 1990). With unresolved harmonics, there are no spectral cues to pitch, and therefore harmonic template models are not applicable. On the other hand, unresolved harmonics produce direct temporal cues to pitch because the waveform of a combination of unresolved harmonics has a period equal to that of the complex tone. These periodicity cues, which are reflected in neural phase locking, can be extracted by an autocorrelation-type mechanism (Licklider 1951; Meddis and Hewitt 1991; Moore 1990; Yost 1996), which is mathematically equivalent to an all-order interspike-interval distribution for neural spike trains. The autocorrelation model also works with resolved harmonics, since the period of the F0 is always an integer multiple of the period of any of the harmonics; this common period can be extracted by combining (e.g., summing) autocorrelation functions from frequency channels tuned to different resolved harmonics (Meddis and Hewitt 1991; Moore 1990).
Previous neurophysiological studies of the coding of the pitch of complex tones in the auditory nerve and cochlear nucleus have documented a robust temporal representation based on pooled interspike-interval distributions obtained by summing the interval distributions from neurons covering a wide range of characteristic frequencies (Cariani and Delgutte 1996a,b; Palmer 1990; Palmer and Winter 1993; Rhode 1995; Shofner 1991). This representation accounts for a wide variety of pitch phenomena, such as the pitch of the missing fundamental, the pitch shift of inharmonic tones, pitch ambiguity, the pitch equivalence of stimuli with similar periodicity, the relative phase invariance of pitch, and, to some extent, the dominance of low-frequency harmonics in pitch. Despite its remarkable effectiveness, the autocorrelation model has difficulty in accounting for the greater pitch salience of stimuli containing resolved harmonics compared to stimuli consisting entirely of unresolved harmonics (Bernstein and Oxenham 2003a; Carlyon 1998; Carlyon and Shackleton 1994; Meddis and O’Mard 1997). This issue was not addressed in previous physiological studies because they did not have a means of assessing whether individual harmonics are resolved or not. Moreover, the upper F0 limit over which the interspike-interval representation of pitch is physiologically viable has not been determined. The existence of such a limit is expected due to the degradation in neural phase locking with increasing frequency (Johnson 1980).
In contrast to the wealth of data on the interspike-interval representation of pitch, possible rate-place cues to pitch that might be available when individual harmonics are resolved by the peripheral auditory system have rarely been investigated. The few studies that provide relevant information (Hirahara et al. 1996; Sachs and Young 1979; Shamma 1985a,b) show no evidence for rate-place cues to pitch, even at low stimulus levels where the limited dynamic range of individual neurons is not an issue. The reason for this failure could be that the stimuli used had low fundamental frequencies in the range of human voice (100–300 Hz) and therefore produced few, if any, resolved harmonics in typical experimental animals, which have a poorer cochlear frequency selectivity compared to humans (Shera et al. 2002). Rate-place cues to pitch might be available in animals for complex tones with higher F0s in the range of conspecific vocalizations, which corresponds to about 500–1,000 Hz for cats (Brown et al. 1978; Nicastro and Owren 2003; Shipley et al. 1991). This hypothesis is consistent with a report that up to 13 harmonics of a complex tone could be resolved in the rate responses of high-CF units in the cat anteroventral cochlear nucleus (Smoorenburg and Linschoten 1977).
In this study, we investigated the resolvability of harmonics of complex tones in the cat auditory nerve and compared the effectiveness of rate-place and interval-based representations of pitch over a much wider range of fundamental frequencies (110–3,520 Hz) than in previous studies. We found that the two representations are complementary with respect to the F0 range over which they are effective, but that neither representation is entirely satisfactory in accounting for human psychophysical data. Preliminary reports of our findings have been presented (Cedolin and Delgutte 2003, 2005a).
METHODS
Procedures
Methods for recording from auditory nerve (AN) fibers in anesthetized cats are as described by Kiang et al. (1965) and Cariani and Delgutte (1996a). Cats were anesthetized with Dial in urethane (75 mg/kg), with supplementary doses given as needed to maintain an areflexic state. The posterior portion of the skull was removed, and the cerebellum was retracted to expose the auditory nerve. The tympanic bullae and the middle-ear cavities were opened to expose the round window. Throughout the experiment, the cat was given injections of dexamethasone (0.26 mg/kg) to prevent brain swelling and Ringer solution (50 ml/d) to prevent dehydration.
The cat was placed on a vibration-isolated table in an electrically shielded, temperature-controlled, soundproof chamber. A silver electrode was positioned at the round window to record the compound action potential (CAP) in response to click stimuli, in order to assess the condition and stability of cochlear function.
Sound was delivered to the cat’s ear through a closed acoustic assembly driven by an electrodynamic speaker (Realistic 40–1377). The acoustic system was calibrated to allow accurate control over the sound-pressure level at the tympanic membrane. Stimuli were generated by a 16-bit D/A converter (Concurrent DA04H) using sampling rates of 20 or 50 kHz. Stimuli were digitally filtered to compensate for the transfer characteristics of the acoustic system.
Spikes were recorded with glass micropipettes filled with 2 M KCl. The electrode was inserted into the nerve and mechanically advanced using a micropositioner (Kopf 650). The electrode signal was bandpass filtered and fed to a custom spike detector. The times of spike peaks were recorded with 1-μs resolution and saved to disk for subsequent analysis.
A click stimulus at ~55 dB SPL was used to search for single units. Upon contact with a fiber, a frequency tuning curve was measured by an automatic tracking algorithm (Kiang et al. 1970) using 100-ms tone bursts, and the characteristic frequency (CF) was determined. The spontaneous firing rate (SR) of the fiber was measured over an interval of 20 s. The responses to complex-tone stimuli were then studied.
Complex-tone stimuli
Stimuli were harmonic complex tones whose F0 was stepped up and down over a two-octave range. The harmonics of each complex tone were all of equal amplitude, and the fundamental component was always missing. Depending on the fiber’s CF, one of four presynthesized stimuli covering different F0 ranges was selected so that some of the harmonics would likely be resolved (Table 1). For example, for a fiber with a 1,760-Hz CF, we typically used F0s ranging from 220 to 880 Hz so that the order of the harmonic closest to the CF would vary from 2 to 8. In each of the four stimuli, the harmonics were restricted to a fixed frequency region as F0 varied (Table 1). For each fiber, the stimulus was selected so that the CF fell approximately at the center of the frequency region spanned by the harmonics. In some cases, data were collected from the same fiber in response to two different stimuli whose harmonics spanned overlapping frequency ranges.
Table 1.
Parameters of the four complex tone stimuli with varying F0 and range of CFs for which each stimulus was used
| CF Range, Hz | F0 Range, Hz | Fixed Stimulus Frequency Region, Hz |
|---|---|---|
| 440–1,760 | 110–440 | 440–1,760 |
| 880–3,520 | 220–880 | 880–3,520 |
| 1,760–7,040 | 440–1,760 | 1,760–7,040 |
| 3,520–14,080 | 880–3,520 | 3,520–14,080 |
Each of the 50 F0 steps (25 up, 25 down) lasted 200 ms, including a 20-ms transition period during which the waveform for one F0 gradually decayed while overlapping with the gradual build up of the waveform for the subsequent F0. Spikes recorded during these transition periods were not included in the analysis. Responses were typically collected over 20 repetitions of the 10-s stimulus (50 steps × 200 ms) with no interruption.
We used mostly low and moderate stimulus levels in order to minimize rate saturation, which would prevent us from accurately assessing harmonic resolvability by the cochlea. Specifically, the sound pressure level of each harmonic was initially set at 15–20 dB above the fiber’s threshold for a pure tone at CF and ranged from 10 to 70 dB SPL, with a median of 25 dB SPL. Because our stimuli contain many harmonics, overall stimulus levels are about 5–10 dB higher than the level of each harmonic, depending on F0. In some cases, responses were measured for two or more stimulus levels differing by 10–20 dB.
To compare neural responses to psychophysical data on the phase dependence of pitch, three versions of each stimulus were generated with different phase relationships among the harmonics: cosine phase, alternating (sine-cosine) phase, and negative Schroeder phase (Schroeder 1970). The three stimuli have the same power spectrum and autocorrelation function, but differ in their temporal fine structure and envelope: while the cosine-phase and alternating-phase stimuli have very “peaky” envelopes, the envelope of the Schroeder-phase stimulus is nearly flat (Fig. 1). Moreover, the envelope periodicity is at F0 for the cosine-phase stimulus, but at 2 × F0 for the alternating-phase stimulus. Alternating-phase stimuli have been widely used in previous studies of neural coding (Horst et al. 1990; Palmer and Winter 1992, 1993).
Fig. 1.
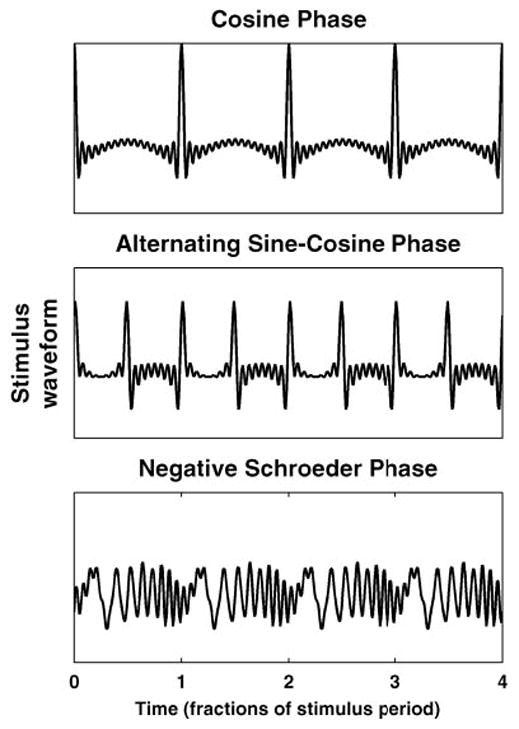
Different phase relationships among harmonics give rise to different stimulus waveforms. For harmonics in cosine phase (top), waveform shows one peak per period of fundamental frequency (F0). When the harmonics are in alternating phase (middle), waveform peaks twice every period of the F0. A negative Schroeder phase relationship among the harmonics (bottom) minimizes amplitude of oscillations of the envelope of waveform.
Average-rate analysis
For each step in the F0 sequence, spikes were counted over a 180-ms window extending over the stimulus duration but excluding the transition period between F0 steps. Spikes counts from the two stimulus segments having the same F0 (from the ascending and descending parts of the F0 sequence) were added together because response to both directions were generally similar. The spike counts were converted to units of discharge rate (spikes/s) and plotted either as a function of F0 for a given fiber or as a function of fiber CF for a given F0 to form a “rate-place profile” (Sachs and Young 1979).
To assess the statistical reliability of these discharge rate estimates, “bootstrap” resampling (Efron and Tibshirani 1993) was performed on the data recorded from each fiber. One hundred resampled data sets were generated by drawing with replacement from the set of spike trains in response to each F0. Spike counts in the ascending and descending part of the F0 sequence were drawn independently from each other. Spike counts from each bootstrap data set were converted to discharge rate estimates as for the original data, and the standard deviation of these estimates was used as an error bar for the mean discharge rate.
Simple phenomenological models were used to analyze average-rate responses to the complex-tone stimuli. Specifically, a single-fiber model was fit to responses of a given fiber as a function of stimulus F0 to quantify harmonic resolvability, while a population model was used to estimate pitch from profiles of average discharge rate against CF for a given F0.
The single-fiber model (Fig. 2) is a cascade of three stages. The linear band-pass filtering stage, representing cochlear frequency selectivity, is implemented by a symmetric rounded exponential function (Patterson 1976). The model of Sachs and Abbas (1974) of rate-level functions is then used to derive the mean discharge rate r from the r.m.s. amplitude p at the output of the band-pass filter
Fig. 2.
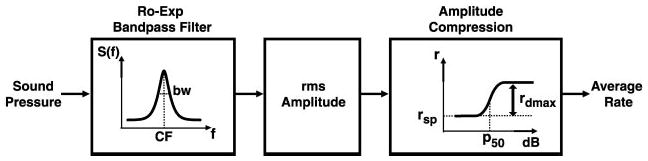
Single-fiber average-rate model. First stage represents cochlear frequency selectivity, implemented by a symmetric rounded-exponential band-pass filter (Patterson 1976). The model of Sachs and Abbas (1974) of rate-level functions is used to compute the mean discharge rate from the r.m.s. amplitude at the output of the band-pass filter.
| (1) |
In this expression, rsp is the spontaneous rate, rdmax is the maximum driven rate, and p50 is the value of p for which the driven rate reaches one-half of its maximum value. The exponent α was fixed at 1.77 to obtain a dynamic range of about 20 dB (Sachs and Abbas 1974). The single-fiber model has a total of five free parameters: the center frequency and bandwidth of the band-pass filter, rsp, rdmax, and p50. This number is considerably smaller than the 25 F0 values for which responses were obtained in each fiber. The model was fit to the data by the least squares method using the Levenberg-Marquardt algorithm as implemented by Matlab’s “lsqcurvefit” function.
The population model is an array of single-fiber models indexed on CF so as to predict the AN rate response to any stimulus as a function of cochlear place. The population model has no free parameters; rather, it is used to find the stimulus parameters (F0 and SPL) most likely to have produced the measured rate-place profile, assuming that the spike counts are statistically independent random variables with Poisson distributions whose expected values are given by the model response at each CF. The resulting maximum-likelihood F0 estimate gives a rate-based estimate of pitch that does not require a priori knowledge of the stimulus F0. This strategy effectively implements the concept of “harmonic template” used in pattern recognition models of pitch (Cohen et al. 1994; Goldstein 1973; Terhardt 1974; Wightman 1973): here, the template is the model response to a harmonic complex tone with equal amplitude harmonics. In practice, the maximum-likelihood F0 estimate was obtained by computing the model responses to complex tones covering a wide range of F0 in fine increments (0.1%) and finding the F0 value that maximizes the likelihood of the data.
While the population model has no free parameters, five fixed (i.e., stimulus-independent) parameters still need to be specified for each fiber in the modeled population. These parameters were selected so as to meet two separate requirements: 1) the model’s normalized driven rate must vary smoothly with CF, and 2) the model must completely specify the Poisson distribution of spike counts for each fiber so as to be able to apply the maximum-likelihood method. To meet these requirements, three of the population-model parameters were directly obtained from the corresponding parameters for the single-fiber model: the center frequency of the band-pass filter (effectively the CF), the spontaneous rate rsp, and the maximum driven rate rdmax. The sensitivity parameter p50 in the population model was set to the median value of this parameter over our fiber sample. Finally, the bandwidth of the band-pass filter was derived from its center frequency by assuming a power law relationship between the two (Shera et al. 2002). The parameters of this power function were obtained by fitting a straight line in double logarithmic coordinates to a scatter plot of filter bandwidth against center frequency for our sample of fibers.
Interspike-interval analysis
As in previous studies of the neural coding of pitch (Cariani and Delgutte 1996a,b; Rhode 1995), we derived pitch estimates from pooled interspike-interval distributions. The pooled interval distribution is the sum of the all-order interspike-interval distributions for all the sampled auditory-nerve fibers and is closely related to the summary autocorrelation in the model of Meddis and Hewitt (1991). The single-fiber interval distribution (bin width 0.1 ms) was computed for each F0 using spikes occurring in the same time window as used in the rate analysis.
To derive pitch estimates from pooled interval distributions, we used “periodic templates” that select intervals at a given period and its multiples. Specifically, we define the contrast ratio of a periodic template as the ratio of the weighted mean number of intervals for bins within the template to the weighted mean number of intervals per bin in the entire histogram. The estimated pitch period is the period of the template that maximizes the contrast ratio. In computing the contrast ratio, each interval is weighted by an exponentially decaying function of its length to give greater weight to short intervals. This weighting implements the idea that the lower F0 limit of pitch at about 30 Hz (Pressnitzer et al. 2001) implies that the auditory system is unable to use very long intervals in forming pitch percepts. A 3.6-ms decay time constant was found empirically to minimize the number of octave and suboctave errors in pitch estimation. The statistical reliability of the pitch estimates was assessed by generating 100 bootstrap replications of the pooled interval distribution (using the same resampling techniques as in the rate analysis) and computing a pitch estimate for each bootstrap replication.
RESULTS
Our results are based on 122 measurements of responses to harmonic complex tones recorded from 75 AN fibers in two cats. Of these, 54 had high SR (>18 spikes/s), 10 had low SR (<0.5 spike/s), and 11 had medium SR. The CFs of the fibers ranged from 450 to 9,200 Hz. We first describe the rate responses of single fibers as a function of F0 to characterize harmonic resolvability. We then derive pitch estimates from both rate-place profiles and pooled interspike-interval distributions and quantify the accuracy and precision of these estimates as a function of F0.
Single-fiber cues to resolved harmonics
Figure 3 shows the average discharge rate as a function of complex-tone F0 (harmonics in cosine phase) for two AN fibers with CFs of 952 (A) and 4,026 Hz (B), respectively. Data are plotted against the dimensionless ratio of fiber CF to stimulus F0, which we call harmonic number (lower horizontal axis). Because this ratio varies inversely with F0, F0 increases from right to left along the top axis in these plots. The harmonic number takes an integer value when the CF coincides with one of the harmonics of the stimulus, while it is an odd integer multiple of 0.5 (2.5, 3.5, etc.) when the CF falls halfway between two harmonics. Thus resolved harmonics should appear as peaks in firing rate for integer values of the harmonic number, with valleys in between. This prediction is verified for both fibers at lower values of the harmonic number (higher F0s), although the oscillations are more pronounced and extend to higher harmonic numbers for the high-CF fiber than for the low-CF fiber. This observation is consistent with the higher quality factor (Q = CF/Bandwidth) of high-CF fibers compared with low-CF fibers (Kiang et al. 1965; Liberman 1978).
Fig. 3.
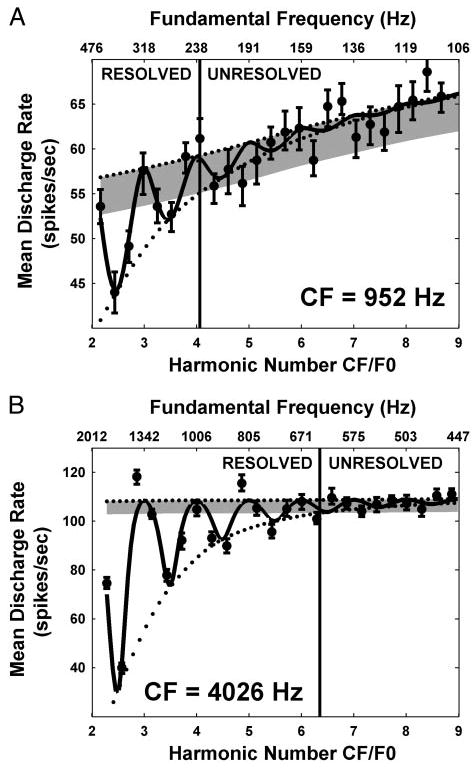
Average discharge rate against complex-tone F0 for 2 auditory nerve (AN) fibers from the same cat with characteristic frequencies (CFs) of 952 (A) and 4,026 Hz (B). Because the bottom axis shows the harmonic number CF/F0, F0 increases from right to left along the top axis. Filled circles with error bars show mean discharge rate ± SD obtained by bootstrap resampling of the stimulus trials. Solid lines show response of best-fitting single-fiber model (Fig. 2). The top and bottom envelopes of the fitted curve are shown by dotted lines. Intersection of the bottom envelope with 2 typical SD from the top envelope (gray shading) gives the maximum harmonic number Nmax for which harmonics are resolved (vertical lines).
To quantify the range of harmonics that can be resolved by each fiber, a simple peripheral auditory model was fit to the data (see METHODS). For both fibers, the response of the best-fitting model (Fig. 3, solid lines) captures the oscillatory trend in the data. The rate of decay of these oscillations is determined by the bandwidth of the band-pass filter representing cochlear frequency selectivity in the model (Fig. 2). The harmonics of F0 are considered to be resolved so long as the oscillations in the fitted curve exceed two typical standard deviation of the discharge rate obtained by bootstrapping (gray shading). The maximum resolved harmonic number Nmax is 4.1 for the low-CF fiber, smaller than Nmax for the high-CF fiber (6.3). The ratio CF/Nmax gives F0min, the lowest fundamental frequency for which harmonics are resolved in a fiber’s rate response. In the examples of Fig. 3, F0min is 232 Hz for the low-CF fiber and 639 Hz for the high-CF fiber.
Figure 4 shows how F0min varies with CF for our entire sample of fibers. To be included in this plot, the variance of the residuals after fitting the single-fiber model to the data had to be significantly smaller (P < 0.05, F-test) than the variance of the raw data so that Nmax (and therefore F0min) could be reliably estimated. Thirty-five of 122 measurements were thus excluded; 23 of these had CFs <2,000 Hz. On the other hand, the figure includes data from fibers (shown by triangles) for which F0min was bounded by the lowest F0 presented and was therefore overestimated. F0min increases systematically with CF, and the increase is well fit by a power function with an exponent of 0.63 (solid line). This increase is consistent with the increase in tuning curve bandwidths with CF (Kiang et al. 1965).
Fig. 4.
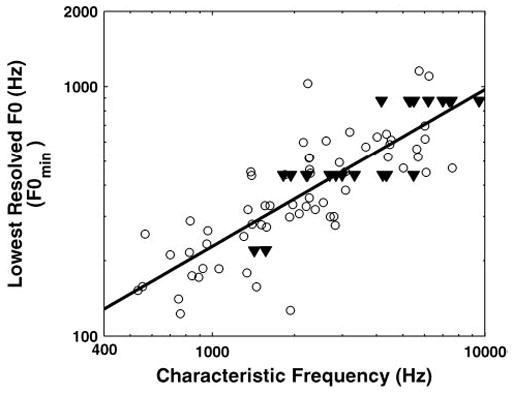
Lowest resolved F0 as a function of CF. Each point shows data from 1 AN fiber. Triangles show data points for which F0min was somewhat overestimated because harmonics were still resolved for the lowest F0 presented. Solid line shows best-fitting straight line on double logarithmic coordinates (a power law).
Rate responses of AN fibers to complex stimuli are known to depend strongly on stimulus level (Sachs and Young 1979). The representation of resolved harmonics in rate responses is expected to degrade as the firing rates become saturated. The increase in cochlear filter bandwidths with level may further degrade harmonic resolvability. We were able to reliably fit single-fiber models to the rate-F0 data for stimulus levels as high as 38 dB above the threshold at CF per component. In general, this limit increased with CF, from roughly 15 dB above threshold for CFs below 1 kHz to about 30 dB above threshold for CFs above 5 kHz. No obvious dependence of this limit on fiber’s spontaneous rate was noticed.
To more directly address the level dependence of responses, we held 24 fibers long enough to record the responses to harmonic complex tones at two or more stimulus levels differing by 10–20 dB. In 23 of these 24 cases, the maximum resolved harmonic number Nmax decreased with increasing level. One example is shown in Fig. 5 for a fiber with CF at 1,983 Hz. For this fiber, Nmax decreased from 7.1 at 20 dB SPL to 4.9 at 30 dB SPL.
Fig. 5.
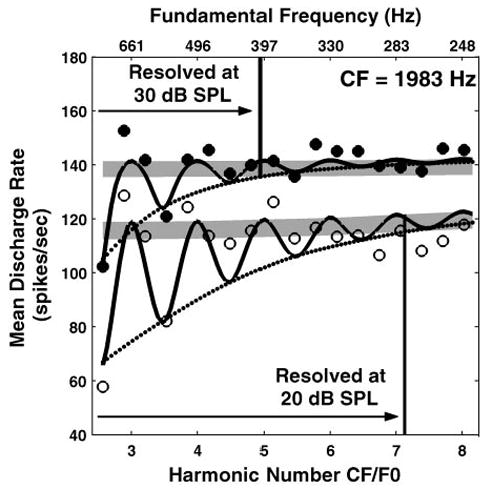
Effect of stimulus level on harmonic resolvability in rate responses of an AN fiber (CF = 1,983 Hz). Open and filled circles show mean discharge rate against F0 for complex tones at 20 and 30 dB SPL, respectively. Solid lines show response of best-fitting model when model parameters were constrained to be the same for both stimulus levels. Other features as in Fig. 3.
The observed decrease in Nmax with level could reflect either broadened cochlear tuning or rate saturation. To distinguish between these two hypotheses, two versions of the single-fiber model were compared when data were available at two stimulus levels. In one version, all the model parameters were constrained to be the same at both levels; in the other version, the bandwidth of the band-pass filter representing cochlear frequency selectivity was allowed to vary with level. The variable-bandwidth model is guaranteed to fit the data better (in a least-squares sense) than the fixed-bandwidth model because it has an additional free parameter. However, an F-test for the ratio of the variances of the residuals revealed no statistically significant difference between the two models at the 0.05 level for any of the 24 fibers, meaning than the additional free parameter of the variable-bandwidth model gave it only an insignificant advantage over the fixed-bandwidth model. This result suggests that rate saturation, which is present in both models, may be the main factor responsible for the decrease in Nmax with stimulus level.
Pitch estimation from rate-place profiles
Having characterized the limits of harmonic resolvability in rate responses of AN fibers, the next step is to determine how accurately pitch can be estimated from rate-place cues to resolved harmonics. For this purpose, we fit harmonic templates to profiles of average discharge rate against CF and derive pitch estimates by the maximum likelihood method, assuming that the spike counts from each fiber are random variables with statistically independent Poisson distributions. In our implementation, a harmonic template is the response of a peripheral auditory model to a complex tone with equal-amplitude harmonics. The estimated pitch is therefore the F0 of the complex tone most likely to have produced the observed response if the stimulus-response relationship were defined by the model.
Figure 6 shows the normalized driven discharge rate of AN fibers as a function of CF in response to two complex tones (harmonics in cosine phase) with F0s of 541.5 (A) and 1,564.4 Hz (C). The rate is normalized by subtracting the spontaneous rate and dividing by the maximum driven rate (Sachs and Young 1979), and these parameters are estimated by fitting the single-fiber model to the rate-F0 data. As for the single-fiber responses in Figs. 3 and 5, responses are plotted against the dimensionless harmonic number CF/F0, with the difference that F0 is now fixed while CF varies, instead of the opposite. Resolved harmonics should again result in peaks in firing rate at integer values of the harmonic number. Despite considerable scatter in the data, this prediction is verified for both F0s, although the oscillations are more pronounced for the higher F0. Many factors are likely to contribute to the scatter, including the threshold differences among fibers with the same CF (Liberman 1978), pooling data from two animals, intrinsic variability in neural responses, and inaccuracies in estimating the minimum and maximum discharge rates used in computing the normalized rate.
Fig. 6.
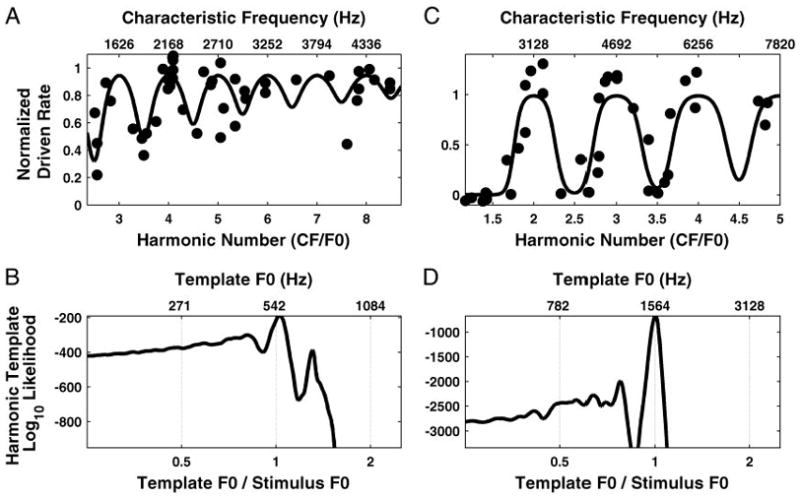
Maximum-likelihood pitch estimation from rate-place profiles using harmonic templates for 2 complex tones with F0s at 542 (A and B) and 1,564 Hz (C and D), respectively. A and C: filled circles show normalized driven rate as a function of both CF (top axis) and harmonic number CF/F0 (bottom axis). Solid lines show maximum-likelihood harmonic template, which is the response of a population model to a complex tone with equal-amplitude harmonics. B and D: log-likelihood of the harmonic template model in producing the data points as a function of template F0.
The solid lines in Fig. 6, A and C, show the normalized rate response of the population model to the complex tone whose F0 maximizes the likelihood, i.e., the best-fitting harmonic template. Note that, while Fig. 6 shows the normalized model response, unnormalized rates (actually, spike counts) are used when applying the maximum likelihood method because only spike counts have the integer values required for a Poisson distribution. For both F0s, the model response shows local maxima near integer values of the harmonic number, indicating that the pitch estimates are very close to the stimulus F0s. This point is shown more precisely in Fig. 6, B and D, which show the log-likelihood of the model response as a function of template F0. Despite the very moderate number of data points in the rate-place profiles, for both F0s, the likelihood shows a sharp maximum when the template F0 is very close to the stimulus F0. For the complex tone with F0 at 541.5 Hz, the estimated pitch is 554.2 Hz, about 2% above the actual F0. For the 1,564.4 Hz tone, the estimated pitch is 1,565.7 Hz, only 0.1% above the actual F0. The likelihood functions also show secondary maxima for template F0s that form ratios of small integers (e.g., 4/3, 3/4) with respect to the stimulus F0. However, because these secondary maxima are much lower than the absolute maximum, the estimated pitch is highly unambiguous, consistent with psychophysical observations for complex tones containing many harmonics (Houtsma and Smurzynski 1990).
To assess the reliability of the maximum-likelihood pitch estimates, estimates were computed for 100 bootstrap resamplings of the data for each F0 (see METHODS). Figure 7A shows the median absolute estimation error of these bootstrap estimates as a function of F0 for complex tones with harmonics in cosine phase. With few exceptions, median pitch estimates only deviate by a few percent from the stimulus F0 above 500 Hz. Larger deviations are more common for lower F0s. The number and CF distribution of the fibers had to meet certain constraints for each F0 to be included in the figure because, to reliably estimate F0, the sampling of the CF axis has to be sufficiently dense to capture the harmonically related oscillations in the rate-CF profiles. This is why Fig. 7 shows no estimates for F0s below 220 Hz and for a small subset of F0s (12 of 56) above 220 Hz.
Fig. 7.
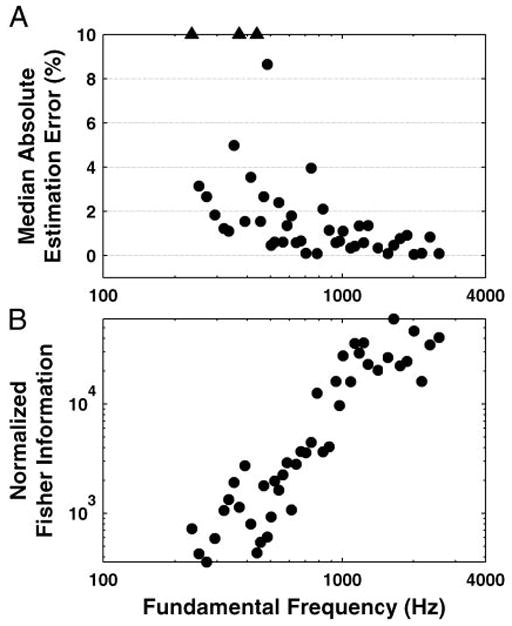
Pitch estimation based on rate-place profiles: median absolute estimation error (A) and normalized Fisher Information (B) as a function of F0. Median is obtained over 100 bootstrap resamplings of the data. Triangles indicate data points for which the median was out of the range defined by the vertical axes. The Fisher Information is a measure of pitch strength defined as the curvature of the log-likelihood with respect to template F0 at the location of the maximum.
To quantify the salience of the rate-place cues to pitch as a function of F0, we used the Fisher Information, which is the expected value of the curvature of the log-likelihood function, evaluated at its maximum. The expected value was approximated by averaging the likelihood function over 100 bootstrap replications of the rate-place data. A steep curvature means that the likelihood varies fast with template F0 and therefore that the F0 estimate is very reliable. The Fisher information was normalized by the number of data points in the rate profile for each F0 to allow comparisons between data sets of different size. Figure 7B shows that the Fisher information increases monotonically with F0 up to about 1,000 Hz and then remains essentially constant. Overall, pitch estimation from rate-place profiles works best for F0s above 400–500 Hz, although reliable estimates were obtained for F0s as low as 250 Hz.
Harmonic templates were fit to rate-place profiles obtained in response to complex tones with harmonics in alternating phase and in Schroeder phase as well as in cosine phase to test whether the pitch estimates depend on phase. Figure 8 shows an example for an F0 of 392 Hz. The numbers of data points differ somewhat for the three phase conditions because we could not always “hold” a unit sufficiently long to measure responses to all three conditions. Despite these sampling differences, the pitch estimates for the three phase conditions are similar to each other (Fig. 8, A–C) and similar to the pitch estimate obtained by combining data across all three phase conditions (Fig. 8D).
Fig. 8.
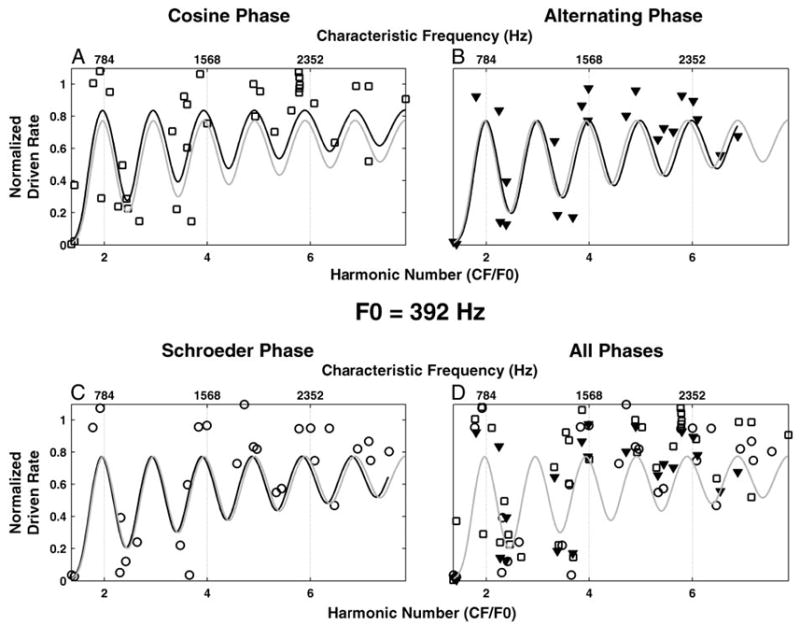
Effect of the relative phase of the harmonics on pitch estimation based on rate-place profiles. Stimulus F0 = 392 Hz. A–C: normalized driven rate (symbols) and maximum-likelihood harmonic templates (black lines) for harmonics in cosine (squares), alternating (triangles), and Schroeder (circles) phase, respectively. D: normalized driven rate and maximum-likelihood harmonic template (gray line) for data pooled across phases (symbols as in A–C). Maximum-likelihood harmonic template for data pooled across phases is plotted in gray also in A–C.
We devised a statistical test for the effect of phase on pitch estimates. This test compares the likelihoods of the rate-place data given two different models. In one model, the estimated pitch is constrained to be the same for all three phase conditions by finding the F0 value that maximizes the likelihood of the combined data (Fig. 8D). In the other model, a maximum likelihood pitch estimate is obtained separately for each phase condition (Fig. 8, A–C), and then the maximum log-likelihoods are summed over the three conditions, based on the assumption that the three data sets are statistically independent. If the rate-place patterns for the different phases differed appreciably, the maximum likelihood for the phase-dependent model should be higher than that for the phase-independent model because the phase-dependent model has the additional flexibility of fitting each data set separately. Contrary to this expectation, when the two models were fit to 1,000 bootstrap replications of the rate-place data, the distributions of the maximum likelihoods for the two models did not significantly differ (P = 0.178), indicating that the additional free parameters of the phase-dependent model offer no significant advantage for this F0.
This test was performed for three different values of F0 (612, 670, and 828 Hz) in addition to the 392-Hz case shown in Fig. 8.1 In three of these four cases, the results were as in Fig. 8 in that the differences in maximum likelihoods for the two models did not reach statistical significance (P < 0.05). For 612 Hz, the comparison did reach significance (P = 0.007), but for this F0, the rate-place profiles for harmonics in alternating and Schroeder phase showed large gaps in the distribution of data points over harmonic numbers, making the reliability of the F0-estimates for these two phases questionable. When the actual pitch estimates for the different phase conditions were compared, there was no clear pattern to the results across F0s, i.e., the pitch estimate for any given phase condition could be the largest in one case and the smallest in another case. These results indicate that phase relationships among the partials of a complex tone do not seem to greatly influence the pitch estimated from rate-place profiles, consistent with psychophysical data on the phase invariance of pitch based on resolved harmonics (Houtsma and Smurzynski 1990).
Pitch estimation from pooled interspike-interval distributions
Pitch estimates were derived from pooled interspike-interval distributions to compare the accuracy of these estimates with that of rate-place estimates for the same stimuli. Figure 9, A and B, shows pooled all-order interspike-interval distributions for two complex-tone stimuli with F0s of 320 and 880 Hz (harmonics in cosine phase). For both F0s, the pooled distributions show modes at the period of F0 and its integer multiples. However, these modes are less prominent at the higher F0 for which only the first few harmonics are located in the range of robust phase locking.
Fig. 9.
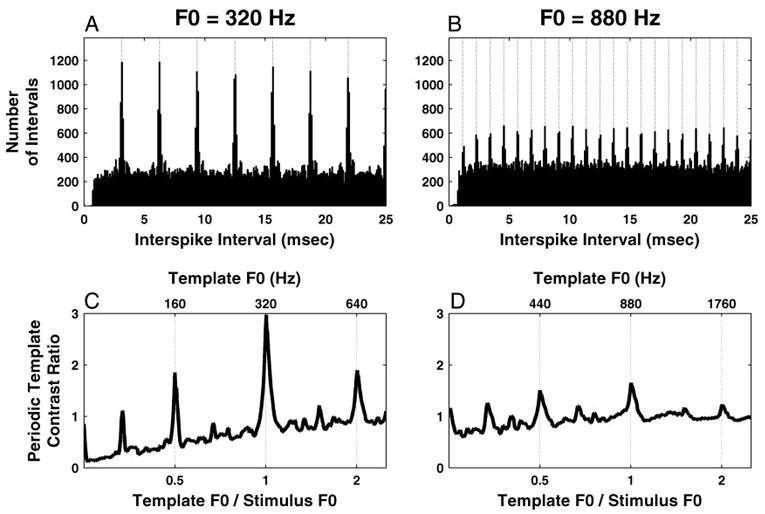
Pitch estimation based on pooled all-order interspike-interval distributions for 2 F0s: 320 (A and C) and 880 Hz (B and D). A and B: pooled all-order interspike interval distributions with periodic templates maximizing the “contrast ratio” (vertical dotted lines). C and D: periodic template contrast ratio as a function of its F0.
In previous work (Cariani and Delgutte 1996a,b; Palmer 1990; Palmer and Winter 1993), the pitch period was estimated from the location of the largest maximum (mode) in the pooled interval distribution. This simple method is also widely used in autocorrelation models of pitch (Meddis and Hewitt 1991; Yost 1982, 1996). However, when tested over a wide range of F0s, this method was found to yield severe pitch estimation errors for two reasons. First, for higher F0s as in Fig. 9B, the first interval mode near 1/F0 is always smaller than the modes at integer multiples of the fundamental period, due to the neural relative refractory period. Moreover, the location of the first mode is slightly but systematically delayed with respect to the period of F0 (Fig. 9B), an effect also attributed to refractoriness (McKinney and Delgutte 1999; Ohgushi 1983). In fact, a peak at the pitch period is altogether lacking if the period is shorter than the absolute refractory period, about 0.6 ms for AN fibers (McKinney and Delgutte 1999). These difficulties at higher F0s might be overcome by using shuffled autocorrelograms (Louage et al. 2004), which, unlike conventional autocorrelograms, are not distorted by neural refractoriness. However, a more fundamental problem is that, at lower F0s, the modes at 1/F0 and its multiples all have approximately the same height (Fig. 9A) so that, due to the intrinsic variability in neural responses, some of the later modes will unavoidably be larger than the first mode in many cases and therefore lead to erroneous pitch estimates at integer submultiples of F0.
We therefore modified our pitch estimation method to make use of all pitch-related modes in the pooled interval distribution rather than just the first one. Specifically, we used periodic templates that select intervals at a given period and its multiples and determined the template F0 which maximizes the contrast ratio, a signal-to-noise ratio measure of the number of intervals within the template relative to the mean number of intervals per bin (see METHODS). When computing the contrast ratio, short intervals were weighted more than long intervals according to an exponentially decaying weighting function of interval length. This weighting implements the psychophysical observation of a lower limit of pitch near 30 Hz (Pressnitzer et al. 2001) by preventing long intervals to contribute significantly to pitch. Figure 9, C and D, shows the template contrast ratio as a function of template F0 for the same two stimuli as on top. For both stimuli, the contrast ratio reaches an absolute maximum when the template F0 is very close to the stimulus F0, although the peak contrast ratio is larger for the lower F0. The contrast ratio also shows local maxima one octave above and below the stimulus F0. In Fig. 9C, these secondary maxima are small relative to the main peak at F0, but in Fig. 9D, the maximum at F0/2 is almost as large as the one at F0. Despite the close call, F0 was correctly estimated in both cases of Fig. 9, and overall, our pitch estimation algorithm produced essentially no octave or sub-octave errors over the entire range of F0 investigated (110–3,520 Hz).
Figure 10 shows measures of the accuracy and strength of the interval-based pitch estimates as a function of F0 for harmonics in cosine phase. The accuracy measure is the median absolute value of the pitch estimation error over bootstrap replications of the pooled interval distributions. The estimates are highly accurate below 1,300 Hz, where their medians are within 1–2% of the stimulus F0 (Fig. 10A). However, the interval-based estimates of pitch abruptly break down near 1,300 Hz. While the existence of such an upper limit is consistent with the degradation in phase locking at high frequencies, the location of this limit at 1,300 Hz is low compared with the 4- to 5-kHz upper limit of phase locking, a point to which we return in the DISCUSSION.
Fig. 10.
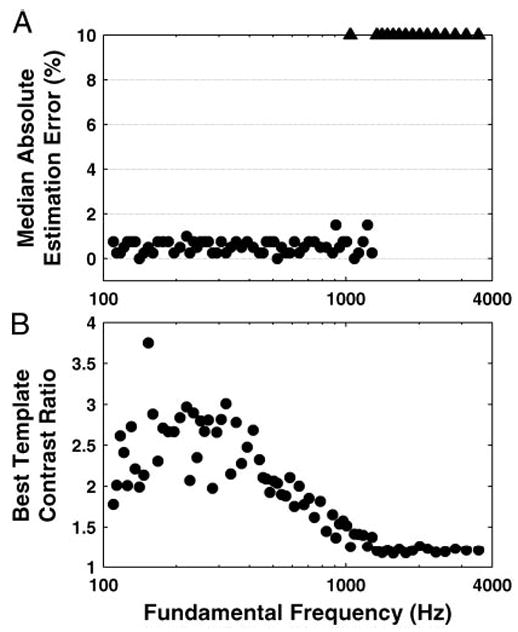
Pitch estimation based on pooled all-order interspike-interval distributions: median absolute estimation error and best-template contrast ratio as a function of F0. A: median (over 100 bootstrap resampling trials) pitch absolute estimation error, expressed as percentage of the true F0. Triangles: pitch absolute estimation error exceeded 10% of the true F0. B: contrast ratio of the best-matching periodic template.
Figure 10B shows a measure of the strength of the estimated pitch, the contrast ratio of the best-fitting periodic template, as a function of F0. The contrast ratio is largest below 500 Hz and decreases gradually with increasing F0, to reach essentially unity (meaning a flat interval distribution) at 1,300 Hz. For F0s >1,300 Hz, the modes in the pooled interval distribution essentially disappear into the noise floor. Thus the strength of interval-based estimates of pitch is highest in the F0 range where rate-based pitch estimates are the least reliable due to the lack of strongly resolved harmonics. Conversely, rate-based estimates of pitch become increasingly strong in the range of F0s where the interval-based estimates break down.
For a few F0s, interval-based estimates of pitch were derived for complex tones with harmonics in alternating phase and in Schroeder phase as well as for harmonics in cosine phase. Figure 11 compares the pooled all-order interval distributions in the three phase conditions for two F0s: 130 (left) and 612 Hz (right). Based on the rate-place results, the harmonics of the 130-Hz F0 are not resolved, whereas some of the harmonics of the 612-Hz F0 are resolved. This is because we obtained a reliable pitch estimate based on rate-place profiles at 612 Hz but not at 130 Hz (Fig. 7).
Fig. 11.
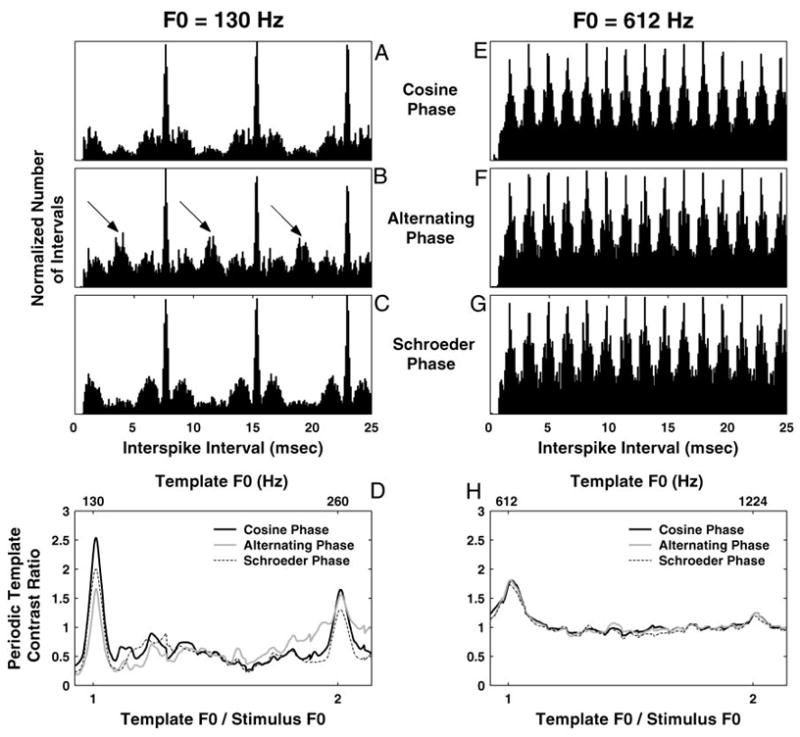
Effect of the relative phase of the harmonics on pitch estimation based on pooled all-order interval distributions for 2 FOs (130 Hz in A–D and 612 Hz in E–H). Pooled interval distributions for harmonics in cosine phase (A and E), alternating sine-cosine phase (B and F), and Schroeder phase (C and G). Arrows in B point to secondary local maxima in the interval distribution at one-half the period (i.e., twice the frequency) of the stimulus F0 and its odd multiples. D and H: periodic template contrast ratio as a function of its F0 for the 3 phase conditions.
For both F0s and all phase conditions, the distributions have modes at the period of the fundamental frequency and its integer multiples (Fig. 11 A–C and E–G). For the lower F0 (130 Hz), the pooled interval distribution for harmonics in alternating phase (Fig. 11B) also shows secondary peaks at half the period of F0 and its odd multiples (arrows), reflecting the periodicity of the stimulus envelope at 2 × F0 (Fig. 1). Such frequency doubling has previously been observed in AN fiber responses to alternating-phase stimuli using both period histograms (Horst et al. 1990; Palmer and Winter 1992) and autocorrelograms (Palmer and Winter 1993). At 130 Hz, the pooled interval distribution for harmonics in negative Schroeder phase (Fig. 11C) shows pronounced modes at the period of F0 and its multiples and strongly resembles the interval distribution for harmonics in cosine phase (Fig. 11A), even though the waveforms of the two stimuli have markedly different envelopes (Fig. 1).
The interval-based pitch estimates are nearly identical for all three phase conditions, but the maximum contrast ratio is substantially lower for harmonics in alternating phase than for harmonics in cosine or in Schroeder phase (Fig. 11D). In addition, for harmonics in alternating phase, the contrast ratio of the periodic template at the envelope frequency 2 × F0 is almost as large as the contrast ratio at F0. In contrast, for the higher F0 (612 Hz), there are no obvious differences between phase conditions in the pooled all-order interval distributions (Fig. 11, E–G). In particular, the secondary peaks at half the period of F0, which were found at 130 Hz for the alternating-phase stimulus, are no longer present at 612 Hz. Moreover, the maximum contrast ratios are essentially the same for all three phase conditions (Fig. 11H).
Overall, these results show that, while phase relationships among harmonics have little effect on the pitch values estimated from pooled interval distributions, which are always close to the stimulus F0, the salience of these estimates can be significantly affected by phase when harmonics are unresolved. These results are consistent with psychophysical results showing a greater effect of phase on pitch and pitch salience for stimuli consisting of unresolved harmonics than for stimuli containing resolved harmonics (Houtsma and Smurzynski 1990; Shackleton and Carlyon 1994). However, these results fail to account for the observation that the dominant pitch is often heard at the envelope frequency 2 × F0 for unresolved harmonics in alternating phase.
DISCUSSION
Harmonic resolvability in AN fiber responses
We examined the response of cat AN fibers to complex tones with a missing fundamental and equal-amplitude harmonics. We used low and moderate stimulus levels (15–20 dB above threshold) to minimize rate saturation that would prevent us from accurately assessing cochlear frequency selectivity and therefore harmonic resolvability from rate responses. In general, the average-rate of a single AN fiber was stronger when its CF was near a low-order harmonic of a complex tone than when the CF fell halfway in between two harmonics (Fig. 3). This trend could be predicted using a phenomenological model of single-fiber rate responses incorporating a band-pass filter representing cochlear frequency selectivity (Fig. 2). The amplitude of the oscillations in the response of the best-fitting single-fiber model, relative to the typical variability in the data, gave an estimate of the lower F0 of complex tones whose harmonics are resolved at a given CF (Fig. 3). This limit, which we call F0min, increases systematically with CF, and this increase is well fit by a power function with an exponent of 0.63 (Fig. 4). That the exponent is less than 1 is consistent with the progressive sharpening of peripheral tuning with increasing CF when expressed as a Q factor, the ratio CF/Bandwidth. The exponent for Q would be 0.37, which closely matches the 0.37 exponent found by Shera et al. (2002) for the CF dependence of Q10 in pure-tone tuning curves from AN fibers in the cat.
Our definition of the lower limit of resolvability F0min is to some extent arbitrary because it depends on the variability in the average discharge rates, which in turn depends on the number of stimulus repetitions and the duration of the stimulus. Nevertheless, our results are consistent with those of Wilson and Evans (1971) for AN fibers in the guinea pig using ripple noise (comb-filtered noise), a stimulus with broad spectral maxima at harmonically related frequencies. These authors found that the number of such maxima that can be resolved in the rate responses of single fibers (equivalent to our Nmax) increases with CF from 2–3 at 200 Hz to about 10 at 10 kHz and above. Similarly, Smoorenburg and Linschoten (1977) reported that the number of harmonics of a complex tone that are resolved in the rate responses of single units in the cat anteroventral cochlear nucleus (AVCN) increases from 2 at 250 Hz to 13 at 10 kHz. Despite the different metrics used to define resolvability, both studies are in good agreement with the data of Fig. 4 if we use the conversion F0min = CF/Nmax.
Consistent with a previous report for AVCN neurons (Smoorenburg and Linschoten 1977), we found that the ability of AN fibers to resolve harmonics in their rate response degrades rapidly with increasing stimulus level. This degradation could be due either to the broadening of cochlear tuning with increasing level or to saturation of the average rate. Saturation seems to be the most likely explanation because a single-fiber model with level-dependent bandwidth did not fit the data significantly better than a model with fixed bandwidth. However, the level dependence of cochlear filter bandwidths might have a greater effect on responses to complex tones if level were varied over a wider range than the 10–20 dB used here (Cooper and Rhode 1997; Ruggero et al. 1997).
Rate-place representation of pitch
A major finding is that the pitch of complex tones could be reliably and accurately estimated from rate-place profiles for fundamental frequencies above 400–500 Hz by fitting a harmonic template to the data (Figs. 6 and 7, A and B). The harmonic template was implemented as the response of a simple peripheral auditory model to a harmonic complex tone with equal-amplitude harmonics, and the estimated pitch was the F0 of the complex tone most likely to have produced the rate-place data assuming that the stimulus-response relationship is characterized by the model. Despite the nonuniform sampling of CFs and the moderate number of fibers sampled at each F0 (typically 20–40), these pitch estimates were accurate within a few percent.
Pitch estimation became increasingly less reliable for F0s below 400–500 Hz, with large estimation errors becoming increasingly common. Nevertheless, some reliable estimates could be obtained for F0s as low as 250 Hz. This result is consistent with the failure of previous studies to identify rate-place cues to pitch in AN responses to harmonic complex tones with F0s below 300 Hz (Hirahara et al. 1996; Sachs and Young 1979; Shamma 1985a,b), although Hirahara et al. did find a weak representation of the first two to three harmonics in rate-place profiles for vowels with an F0 at 350 Hz.
In interpreting these results, it is important to keep in mind that the precision of the rate-based pitch estimates depends on many factors such as the number of fibers sampled, the CF distribution of the fibers, pooling of data from two animals, the number of stimulus repetitions, and the particular method for fitting harmonic templates. For example, since the lowest CF sampled was 450 Hz, the second harmonic and, in some cases, the third could not be represented in the rate-place profiles for F0s <220 Hz, possibly explaining why we never obtained a reliable pitch estimate in that range. In fact, because our stimuli had missing fundamentals, we cannot rule out that the fundamental might always be resolved when it is present.
In one respect, our method may somewhat overestimate the accuracy of the rate-based pitch estimates because we only included data from measurements for which the rate response as a function of F0 oscillated sufficiently to be able to reliably fit a single-fiber model. This constraint was necessary because, for responses that do not oscillate, we could not reliably estimate the minimum and maximum discharge rates that are essential in fitting harmonic templates to the rate-place data. Thirty-five of 122 responses were thus excluded. Because our design minimizes rate saturation, and because 23 of these 35 excluded responses were from fibers with CFs <2 kHz, we infer that insufficient frequency selectivity for resolving harmonics rather than rate saturation was the primary reason for the lack of F0-related oscillations in these measurements.
A factor whose effect on pitch estimation performance is hard to evaluate is that the rate-place profiles included responses to stimuli presented at different sound levels. At first sight, pooling data across levels might seem to increase response variability and therefore decrease estimation performance. However, because the stimulus level was usually selected to be 15–20 dB above the threshold of each fiber so that responses would be robust without being saturated, our procedure might actually have reduced the variability due to threshold differences among fibers. The rationale for this procedure is that an optimal central processor would focus on unsaturated fibers because these fibers are the most informative. Because level (re. threshold) rather than absolute level is the primary determinant of rate responses, we are effectively invoking a form of the “selective listening hypothesis” (Delgutte 1982, 1987; Lai et al. 1994), according to which the central processor attends to low-threshold, high-spontaneous rate fibers at low levels and to high-threshold, low-spontaneous rate fibers at high levels.
Our harmonic template differs from those typically used in pattern recognition models of pitch in that it has very broad peaks at the harmonic frequencies. Most pattern recognition models (Duifhuis et al. 1982; Goldstein 1973; Terhardt 1974) use very narrow templates or “sieves,” typically a few percent of each harmonic’s frequency. One exception is the model of Wightman (1973), which effectively uses broad cosinusoidal templates by performing a Fourier transform operation on the spectrum. Our method also resembles the Wightman model and differs from the other models in that it avoids an intermediate, error-prone stage that estimates the frequencies of the individual resolved harmonics; rather, a global template is fit to the entire rate-place profile. Broad templates are well adapted to the measured rate-place profiles because the dips between the harmonics are often sharper than the peaks at the harmonic frequencies (Figs. 6 and 8). On the other hand, the templates are the response of the peripheral model to complex tones with equal-amplitude harmonics, which exactly match the stimuli that were presented. It remains to be seen how well such templates would work when the spectral envelope of the stimulus is unknown or when the amplitudes of the individual harmonics are roved from trial to trial, conditions that cause little degradation in psychophysical performance (Bernstein and Oxenham 2003a; Houtsma and Smurzynski 1990).
Given the uncertainties about HOW the various factors discussed above may affect our pitch estimation procedure, a comparison of the pitch estimation performance with psychophysical data should focus on robust overall trends as a function of stimulus parameters rather than on absolute measures of performance. Both the precision of the pitch estimates (Fig. 7A) and their salience (as measured by the Fisher information; Fig. 7B), improve with increasing F0 as the harmonics of the complex become increasingly resolved. This result is in agreement with psychophysical observations that both pitch strength and pitch discrimination performance improve as the degree of harmonic resolvability increases (Bernstein and Oxenham 2003b; Carlyon and Shackleton 1994; Houtsma and Smurzynski 1990; Plomp 1967; Ritsma 1967). However, the continued increase in Fisher information with F0 beyond 1,000 Hz conflicts with the existence of an upper limit to the pitch of missing-fundamental stimuli, which occurs at about 1,400 Hz in humans (Moore 1973b). This discrepancy between the rapid degradation in pitch discrimination at high frequencies and the lack of a concomitant degradation in cochlear frequency selectivity is a general problem for place models of pitch perception and frequency discrimination (Moore 1973a).
We also found that the relative phases of the resolved harmonics of a complex tone do not greatly influence rate-based estimates of pitch (Fig. 8). This result is consistent with expectations for a purely place representation of pitch, as well as with psychophysical results for stimuli containing resolved harmonics (Houtsma and Smurzynski 1990; Shackleton and Carlyon 1994; Wightman 1973).
The restriction of our data to low and moderate stimulus levels raises the question of whether the rate-place representation of pitch would remain robust at the higher stimulus levels typically used in speech communication or when listening to music. Previous studies have used signal detection theory to quantitatively assess the ability of rate-place information in the AN to account for behavioral performance in tasks such as intensity discrimination (Colburn et al. 2003; Delgutte 1987; Viemeister 1988; Winslow and Sachs 1988; Winter and Palmer 1991) and formant-frequency discrimination for vowels (Conley and Keilson 1995; May et al. 1996). These studies give a mixed message. On the one hand, the rate-place representation generally contains sufficient information to account for behavioral performance up to the highest sound levels tested. On the other hand, because the fraction of high-threshold fibers is small compared to low-threshold fibers, predicted performance of optimal processor models degrades markedly with increasing level, whereas psychophysical performance remains stable. Thus while a rate-place representation cannot be ruled out, it fails to account for a major trend in the psychophysical data. Extending this type of analysis to pitch discrimination for harmonic complex tones is beyond the scope of this paper. Given the failure of the rate-place representation to account for the level dependence of performance in the other tasks, a more productive approach may be to explore alternative spatio-temporal representations that would rely on harmonic resolvability like the rate-place representation, but would be more robust with respect to level variations by exploiting phase locking (Heinz et al. 2001; Shamma 1985a). Preliminary tests of one such spatio-temporal representation are encouraging (Cedolin and Delgutte 2005b).
Interspike-interval representation of pitch
Our results confirm previous findings (Cariani and Delgutte 1996a,b; Palmer 1990; Palmer and Winter 1993), that fundamental frequencies of harmonic complex tones are precisely represented in pooled all-order interspike-interval distributions of the AN. These interval distributions have prominent modes at the period of F0 and its integer multiples (Fig. 9, A and B). Pitch estimates derived using periodic templates that select intervals at a given period and its multiples were highly accurate (often within 1%) for F0s up to 1,300 Hz (Fig. 10). The determination of this upper limit to the interval-based representation of pitch is a new finding. Moreover, the use of periodic templates for pitch estimation improves on the traditional method of picking the largest mode in the interval distribution by greatly reducing suboctave errors.
While the existence of an upper limit to the representation of pitch in interspike intervals is expected from the degradation in phase locking at high frequencies, the location of this limit at 1,300 Hz is low compared with the usually quoted 4- to 5-kHz limit of phase locking in the AN (Johnson 1980; Rose et al. 1967). Of course, both the limit of pitch representation and the limit of phase locking depend to some extent on the signal-to-noise ratio of the data, which in turn depends on the duration of the stimulus, the number of stimulus repetitions and, for pooled interval distributions, the number of sampled fibers. However the discrepancy between the two limits appears too large to be entirely accounted for by differences in signal-to-noise ratio. Fortunately, the discrepancy can be largely reconciled by taking into account harmonic resolvability and the properties of our stimuli. For F0s near 1,300 Hz, all the harmonics within the CF range of our data (450–9,200 Hz) are well resolved (Fig. 4), so that information about pitch in pooled interval distributions must depend on phase locking to individual resolved harmonics rather than on phase locking to the envelope generated by interactions between harmonics within a cochlear filter. Moreover, because our stimuli have missing fundamentals, an unambiguous determination of pitch from the pooled distribution requires phase locking to at least two resolved harmonics. As F0 increases above 1,300 Hz, the third harmonic (3,900 Hz) begins to exceed the upper limit of phase locking, leaving only ambiguous pitch information and therefore leading to severe estimation errors.
A major finding is that the range of F0s over which interval-based estimates of pitch are reliable roughly covers the entire human perceptual range of the pitch of missing-fundamental stimuli, which extends up to 1,400 Hz for stimuli containing many harmonics (Moore 1973b). It is widely recognized that the upper limit of phase locking to pure tones matches the limit in listeners’ ability to identify musical intervals (Semal and Demany 1990; Ward 1954). The present results extend this correspondence to complex tones with missing F0.
Our results predict that pitch based on pooled interval distributions is strongest for F0s <400 Hz (Fig. 10B), a range for which the decreased effectiveness of pitch estimation based on rate-place information implies that individual harmonics are poorly resolved in the cat. Thus the interval-based representation of pitch seems to have trouble predicting the greater salience of pitch based on resolved harmonics compared to that based on unresolved harmonics (Bernstein and Oxenham 2003b; Shackleton and Carlyon 1994). This conclusion based on physiological data supports similar conclusions previously reached for autocorrelation models of pitch perception (Bernstein and Oxenham 2003a; Carlyon 1998; Meddis and O’Mard 1997).
We found that neither the pitch values nor the pitch strength estimated from pooled interval distributions depend on the phase relationships among the harmonics at higher F0s where some harmonics are well resolved (Fig. 11, E–G). This finding is consistent with psychophysical observations on the phase invariance of pitch and pitch salience for stimuli containing resolved harmonics (Carlyon and Shackleton 1994; Houtsma and Smurzynski 1990; Wightman 1973). However, pitch salience and, in some cases, pitch values do depend on phase relationships for stimuli consisting of unresolved harmonics (Houtsma and Smurzynski 1990; Lundeen and Small 1984; Ritsma and Engel 1964). In particular, for stimuli in alternating sine-cosine phase, the pitch often matches the envelope periodicity at 2 × F0 rather than the fundamental (Lundeen and Small 1984). Consistent with previous studies (Horst et al. 1990; Palmer and Winter 1992, 1993), we found a correlate of this observation in the pooled interval distributions in that our interval-based measure of pitch strength was almost as large at the envelope frequency 2 × F0 as at the fundamental F0 for alternating-phase stimuli with unresolved harmonics (Fig. 11D). Despite this frequency doubling, the pitch values estimated from interval distributions were always at F0 and never at 2 × F0, in contrast to psychophysical judgments for unresolved harmonics in alternating phase (Lundeen and Small 1984). Thus pitch estimation based on interspike intervals does not seem to be sufficiently sensitive to the relative phases of unresolved harmonics compared to psychophysical data. A similar conclusion has been reached for the autocorrelation model of pitch, and modifications to the model have been proposed in part to handle this difficulty (de Cheveigné 1998; Patterson and Holdsworth 1994).
Vocalizations and pitch perception
A widely held view is that pitch perception for harmonic complex tones is closely linked to the extraction of biologically relevant information from conspecific vocalizations including human speech. For example, Terhardt (1974) argued: “The virtual pitch cues can be generated only if a learning process previously has been performed. … In that process, the correlations between the spectral-pitch cues of voiced speech sounds … are recognized and stored. The knowledge about harmonic pitch relations which is acquired in this way is employed by the system in the generation of virtual pitch.” While the role of a learning mechanism may be questioned given that the perception of missing-fundamental pitch appears to be already present in young infants (Clarkson and Clifton 1985; Montgomery and Clarkson 1997), a link between vocalization and pitch perception is supported by other arguments. Many vertebrate vocalizations, such as the vowels of human speech, contain harmonic complex tones. Because the fundamental component is rarely the most intense component in these vocalizations, it would often be masked in the presence of environmental noise, thereby creating a selective pressure for a missing-fundamental mechanism. The link between vocalization and pitch perception has recently been formalized using a model which predicts many psychophysical pitch phenomena from the probability distribution of human voiced speech sounds, without explicit reference to any specific pitch extraction mechanism (Schwartz and Purves 2004).
In cats, the fundamental frequency range most important for vocalizations lies at 500–1,000 Hz (Brown et al. 1978; Nicastro and Owren 2003; Shipley et al. 1991). In this range, pitch is robustly represented in both rate-place profiles and pooled interspike-interval distributions. The difficulties encountered by the rate-place representation over the F0-region below 300 Hz, which is the most important for human voice, may reflect the poorer frequency selectivity of the cat cochlea compared to the human (Shera et al. 2002). If we assume that human cochlear filters are about three times as sharply tuned as cat filters, consistent with the Shera et al. data, the rate-place representation would hold in humans for F0s at least as low as 100 Hz, thereby encompassing most voiced speech sounds. Thus, in humans as well as in cats, the pitch of most conspecific vocalizations may be robustly represented in both rate-place profiles and interspike-interval distributions. Such a dual representation may be advantageous in situations when either mechanism is degraded by either cochlear damage or central disorders of temporal processing because it would still allow impaired individuals to extract pitch information.
Despite its appeal, the idea that the pitch of conspecific vocalizations has a dual representation in spatial and temporal codes is not likely to hold across vertebrate species. At one extreme is the mustached bat, where the F0s of vocalizations range from 8 to 30 kHz (Kanwal et al. 1994), virtually ruling out any temporal mechanism. Evidence for a perception of the pitch of missing fundamental stimuli at ultrasonic frequencies is available for one species of bats (Preisler and Schmidt 1998). At the other extreme is the bullfrog, where the fundamental frequency of vocalizations near 100 Hz appears to be coded in the phase locking of AN fibers to the sound’s envelope rather than by a place mechanism (Dear et al. 1993; Simmons et al. 1990). Although this species is sensitive to the fundamental frequency of complex tones (Capranica and Moffat 1975), it is not known whether it experiences a missing fundamental phenomenon similar to that in humans. These examples suggest that a tight link between pitch and vocalization may be incompatible with the existence of a general pitch mechanism common to all vertebrate species. Either different species use separate pitch mechanisms to different degrees or the primary function of the pitch mechanism is not to extract information from conspecific vocalizations, or both.
Conclusion
We compared the effectiveness of two possible representations of the pitch of harmonic complex tones in the responses of the population of AN fibers at low and moderate stimulus levels: a rate-place representation based on resolved harmonics and a temporal representation based on pooled interspike-interval distributions. A major finding is that the rate-place representation was most effective for F0s >400–500 Hz, consistent with previous reports of a lack of rate-place cues to pitch for lower F0s, and with the improvement in cochlear frequency selectivity with increasing frequency. The interspike-interval representation gave precise estimates of pitch for low F0s, but broke down near 1,300 Hz. This upper limit is consistent with the psychophysical limit of the pitch of the missing fundamental for stimuli containing many harmonics, extending to missing-fundamental stimuli the correspondence between the frequency range of phase locking and that of musical pitch. Both rate-place and interspike-interval representations were effective in the F0 range of cat vocalizations, and a similar result may hold for human voice if we take into account the differences in cochlear frequency selectivity between the two species. Consistent with psychophysical data, neither of the two pitch representations was sensitive to the relative phases of the partials for stimuli containing resolved harmonics.
On the other hand, neither representation of pitch is entirely consistent with the psychophysical data. The rate-place representation fails to account for the upper limit of musical pitch and is known to degrade rapidly with increases in sound level and decreases in signal-to-noise ratio. The interval representation has trouble accounting for the greater salience of pitch based on resolved harmonics compared to pitch based on unresolved harmonics and appears to be insufficiently sensitive to phase for stimuli consisting of unresolved harmonics. These conclusions suggest a search for alternative neural codes for pitch that would combine some of the features of place and temporal codes to overcome the limitations of either code. One class of codes that may meet these requirements are spatio-temporal codes that depend on both harmonic resolvability and phase locking (Heinz et al. 2001; Loeb et al. 1983; Shamma 1985a; Shamma and Klein 2000).
Acknowledgments
The authors thank C. Micheyl, C. Shera, and J. Bernstein for valuable comments on the manuscript and A. Oxenham for advice on the design of the experiments. Thanks also to C. Miller for expert surgical preparation of the animals.
GRANTS
This work was supported by a National Science Foundation Graduate Student Fellowship and by National Institute on Deafness and Other Communication Disorders Grants DC-00361, DC-02258, DC-00038, and DC-05209.
Footnotes
A programming error resulted in erroneous phase relationships among the harmonics for most F0s. We only performed the test for the four F0 values for which the phases were correct.
References
- Bernstein JG, Oxenham AJ. Effects of relative frequency, absolute frequency, and phase on fundamental frequency discrimination: data and an autocorrelation model. J Acoust Soc Am. 2003a;113:2290. doi: 10.1121/1.1904268. [DOI] [PMC free article] [PubMed] [Google Scholar]
- Bernstein JG, Oxenham AJ. Pitch discrimination of diotic and dichotic tone complexes: harmonic resolvability or harmonic number? J Acoust Soc Am. 2003b;113:3323–3334. doi: 10.1121/1.1572146. [DOI] [PubMed] [Google Scholar]
- Bregman AS. Auditory Scene Analysis: The Perceptual Organization of Sound. Cambridge, MA: MIT Press; 1990. [Google Scholar]
- Brown CH, Beecher MD, Moody DB, Stebbins WC. Localization of primate calls by old world monkeys. Science. 1978;201:753–754. doi: 10.1126/science.97785. [DOI] [PubMed] [Google Scholar]
- Capranica RR, Moffat AJM. Selectivity of the peripheral auditory system of spadefoot toads (Scaphiopus couchi) for sounds of biological significance. J Comp Physiol. 1975;100:231–249. [Google Scholar]
- Cariani PA, Delgutte B. Neural correlates of the pitch of complex tones. I. Pitch and pitch salience. J Neurophysiol. 1996a;76:1698–1716. doi: 10.1152/jn.1996.76.3.1698. [DOI] [PubMed] [Google Scholar]
- Cariani PA, Delgutte B. Neural correlates of the pitch of complex tones. II. Pitch shift, pitch ambiguity, phase invariance, pitch circularity, rate pitch, and the dominance region for pitch. J Neurophysiol. 1996b;76:1717–1734. doi: 10.1152/jn.1996.76.3.1717. [DOI] [PubMed] [Google Scholar]
- Carlyon RP. Comments on “A unitary model of pitch perception.” [J Acoust Soc Am 102: 1811–1820, 1997] J Acoust Soc Am. 1998;104:1118–1121. doi: 10.1121/1.423319. [DOI] [PubMed] [Google Scholar]
- Carlyon RP, Shackleton TM. Comparing the fundamental frequencies of resolved and unresolved harmonics: evidence for two pitch mechanisms? J Acoust Soc Am. 1994;95:3541–3554. doi: 10.1121/1.409970. [DOI] [PubMed] [Google Scholar]
- Clarkson MG, Clifton RK. Infant pitch perception: evidence for responding to pitch categories and the missing fundamental. J Acoust Soc Am. 1985;77:1521–1528. doi: 10.1121/1.391994. [DOI] [PubMed] [Google Scholar]
- Cedolin L, Delgutte B. Dual representation of the pitch of complex tones in the auditory nerve. Abstr Assoc Res Otolaryngol. 2003;26 [Google Scholar]
- Cedolin L, Delgutte B. Representations of the pitch of complex tones in the auditory nerve. In: Pressnitzer D, deCheveigne A, McAdams S, Collet L, editors. Auditory Signal Processing: Physiology, Psychoacoustics, and Models. New York: Springer; 2005a. pp. 107–116. [Google Scholar]
- Cedolin L, Delgutte B. Spatio-temporal representation of the pitch of complex tones in the auditory nerve. Abstr Assoc Res Otolaryngol. 2005b;28 [Google Scholar]
- Cohen MA, Grossberg S, Wyse LL. A spectral network model of pitch perception. J Acoust Soc Am. 1994;98:862–879. doi: 10.1121/1.413512. [DOI] [PubMed] [Google Scholar]
- Colburn HS, Carney LH, Heinz MG. Quantifying the information in auditory-nerve responses for level discrimination. J Assoc Res Otolaryngol. 2003;4:294–311. doi: 10.1007/s10162-002-1090-6. [DOI] [PMC free article] [PubMed] [Google Scholar]
- Conley RA, Keilson SE. Rate representation and discriminability of second formant frequencies for/ε/-like steady-state vowels in cat auditory nerve. J Acoust Soc Am. 1995;98:3223–3234. doi: 10.1121/1.413812. [DOI] [PubMed] [Google Scholar]
- Cooper NP, Rhode WS. Mechanical responses to two-tone distortion products in the apical and basal turns of the mammalian cochlea. J Neurophysiol. 1997;78:261–270. doi: 10.1152/jn.1997.78.1.261. [DOI] [PubMed] [Google Scholar]
- Cynx J, Shapiro M. Perception of missing fundamental by a species of songbird (Sturnus vulgaris) J Comp Psychol. 1986;100:356–360. [PubMed] [Google Scholar]
- Darwin CJ, Carlyon RP. Auditory grouping. In: Moore BCJ, editor. The Handbook of Perception and Cognition, vol. 6, Hearing. London: Academic; 1995. pp. 387–424. [Google Scholar]
- de Cheveigné A. Cancellation model of pitch perception. J Acoust Soc Am. 1998;103:1261–1271. doi: 10.1121/1.423232. [DOI] [PubMed] [Google Scholar]
- Dear SP, Fritz J, Haresign T, Ferragamo M, Simmons JA. Tonotopic and functional organization in the auditory cortex of the big brown bat. J Neurophysiol. 1993;70:1988–2009. doi: 10.1152/jn.1993.70.5.1988. [DOI] [PubMed] [Google Scholar]
- Delgutte B. Some correlates of phonetic distinctions at the level of the auditory nerve. In: Granström RCAB, editor. The Representation of Speech in the Peripheral Auditory System. Amsterdam: Elsevier; 1982. pp. 131–150. [Google Scholar]
- Delgutte B. Peripheral auditory processing of speech information: implications from a physiological study of intensity discrimination. In: Schouten M, editor. The Psychophysics of Speech Perception. Nijhof; Dordrecht: 1987. pp. 333–353. [Google Scholar]
- Duifhuis H, Willems LF, Sluyter RJ. Measurement of pitch in speech: An implementation of Goldstein’s theory of pitch perception. J Acoust Soc Am. 1982;71:1568–1580. doi: 10.1121/1.387811. [DOI] [PubMed] [Google Scholar]
- Efron B, Tibshirani RJ. An Introduction to the Bootstrap. New York: Chapman and Hall; 1993. [Google Scholar]
- Goldstein JL. An optimum processor theory for the central formation of the pitch of complex tones. J Acoust Soc Am. 1973;54:1496–1516. doi: 10.1121/1.1914448. [DOI] [PubMed] [Google Scholar]
- Heffner H, Whitfield IC. Perception of the missing fundamental by cats. J Acoust Soc Am. 1976;59:915–919. doi: 10.1121/1.380951. [DOI] [PubMed] [Google Scholar]
- Heinz MG, Colburn HS, Carney LH. Rate and timing cues associated with the cochlear amplifier: level discrimination based on monaural cross-frequency coincidence detection. J Acoust Soc Am. 2001;110:2065–2084. doi: 10.1121/1.1404977. [DOI] [PubMed] [Google Scholar]
- Hirahara T, Cariani PA, Delgutte B. Proceedings European Speech Communication Association Workshop on Auditory Basis of Speech Perception. Keele University; UK: July 15–19, 1996. Representation of low-frequency vowel formants in the auditory nerve; pp. 83–86. [Google Scholar]
- Horst JW, Javel E, Farley GR. Coding of spectral fine structure in the auditory nerve. II. Level-dependent nonlinear responses. J Acoust Soc Am. 1990;88:2656–2681. doi: 10.1121/1.399986. [DOI] [PubMed] [Google Scholar]
- Houtsma AJM, Smurzynski J. Pitch identification and discrimination for complex tones with many harmonics. J Acoust SocAm. 1990;87:304–310. [Google Scholar]
- Johnson DH. The relationship between spike rate and synchrony in responses of auditory-nerve fibers to single tones. J Acoust Soc Am. 1980;68:1115–1122. doi: 10.1121/1.384982. [DOI] [PubMed] [Google Scholar]
- Kanwal JS, Matsumura S, Ohlemiller K, Suga N. Analysis of acoustic elements and syntax in communication sounds emitted by mustached bats. J Acoust Soc Am. 1994;96:1229–1254. doi: 10.1121/1.410273. [DOI] [PubMed] [Google Scholar]
- Kiang NYS, Moxon EC, Levine RA. Auditory-nerve activity in cats with normal and abnormal cochleas. In: Wolstenholme G, Knight J, editors. Sensorineural Hearing Loss Ciba Foundation Symposium. London: J. & A. Churchill; 1970. pp. 241–273. [DOI] [PubMed] [Google Scholar]
- Kiang NYS, Watanabe T, Thomas EC, Clark LF. Discharge Patterns of Single FIbers in the Cat’s Auditory Nerve. Cambridge, MA: MIT Press; 1965. [Google Scholar]
- Lai YC, Winslow RL, Sachs MB. A model of selective processing of auditory-nerve inputs by stellate cells of the antero-ventral cochlear nucleus. J Comput Neurosci. 1994;1:167–194. doi: 10.1007/BF00961733. [DOI] [PubMed] [Google Scholar]
- Liberman MC. Auditory-nerve responses from cats raised in a low-noise chamber. J Acoust Soc Am. 1978;63:442–455. doi: 10.1121/1.381736. [DOI] [PubMed] [Google Scholar]
- Licklider JCR. A duplex theory of pitch perception. Experientia. 1951;7:128–134. doi: 10.1007/BF02156143. [DOI] [PubMed] [Google Scholar]
- Loeb GE, White MW, Merzenich MM. Spatial cross-correlation. A proposed mechanism for acoustic pitch perception. Biol Cybern. 1983;47:149–163. doi: 10.1007/BF00337005. [DOI] [PubMed] [Google Scholar]
- Louage DH, van der Heijden M, Joris PX. Temporal properties of responses to broadband noise in the auditory nerve. J Neurophysiol. 2004;91:2051–2065. doi: 10.1152/jn.00816.2003. [DOI] [PubMed] [Google Scholar]
- Lundeen C, Small AMJ. The influence of temporal cues on the strength of periodicity pitches. J Acoust Soc Am. 1984;75:1578–1587. doi: 10.1121/1.390867. [DOI] [PubMed] [Google Scholar]
- May BJ, Huang AY, Le Prell GS, Hienz RD. Vowel formant frequency discrimination in cats: comparison of auditory nerve representations and psychophysical thresholds. Aud Neurosci. 1996;3:135–162. [PMC free article] [PubMed] [Google Scholar]
- McKinney MF, Delgutte B. A possible neurophysiological basis of the octave enlargement effect. J Acoust Soc Am. 1999;73:1694–1700. doi: 10.1121/1.428098. [DOI] [PMC free article] [PubMed] [Google Scholar]
- Meddis R, Hewitt MJ. Virtual pitch and phase sensitivity of a computer model of the auditory periphery. I. Pitch identification. J Acoust Soc Am. 1991;89:2866–2882. [Google Scholar]
- Meddis R, O’Mard L. A unitary model of pitch perception. J Acoust Soc Am. 1997;102:1811–1820. doi: 10.1121/1.420088. [DOI] [PubMed] [Google Scholar]
- Montgomery C, Clarkson M. Infants’ pitch perception: masking by low-and high-frequency noises. J Acoust Soc Am. 1997;102:3665–3672. doi: 10.1121/1.420153. [DOI] [PubMed] [Google Scholar]
- Moore BCJ. Frequency difference limens for short-duration tones. J Acoust Soc Am. 1973a;54:610–619. doi: 10.1121/1.1913640. [DOI] [PubMed] [Google Scholar]
- Moore BCJ. Some experiments relating to the perception of complex tones. Q J Exp Psychol. 1973b;25:451–475. doi: 10.1080/14640747308400369. [DOI] [PubMed] [Google Scholar]
- Moore BCJ. Introduction to the Psychology of Hearing. London: Academic; 1990. [Google Scholar]
- Nicastro N, Owren MJ. Classification of domestic cat (Felis catus) vocalizations by naive and experienced human listeners. J Comp Psychol. 2003;117:44–52. doi: 10.1037/0735-7036.117.1.44. [DOI] [PubMed] [Google Scholar]
- Ohgushi K. The origin of tonality and a possible explanation of the octave enlargement phenomenon. J Acoust Soc Am. 1983;73:1694–1700. doi: 10.1121/1.389392. [DOI] [PubMed] [Google Scholar]
- Ohm G. Über die Definition des Tones nebst daran geknüpfte Theorie der Sirene und ähnlicher tonbildender Vorrichtungen. Ann Phys Chem. 1843;59:513–565. [Google Scholar]
- Palmer AR. The representation of the spectra and fundamental frequencies of steady-state single- and double-vowel sounds in the temporal discharge patterns of guinea pig cochlear-nerve fibers. J Acoust Soc Am. 1990;88:1412–1426. doi: 10.1121/1.400329. [DOI] [PubMed] [Google Scholar]
- Palmer AR, Russell IJ. Phase-locking in the cochlear nerve of the guinea pig and its relation to the receptor potential of inner hair cells. Hearing Res. 1986;24:1–15. doi: 10.1016/0378-5955(86)90002-x. [DOI] [PubMed] [Google Scholar]
- Palmer AR, Winter IM. Cochlear nerve and cochlear nucleus responses to the fundamental frequency of voiced speech sounds and harmonic complex tones. In: Horner K, editor. Auditory Physiology and Perception. Oxford: Pergamon; 1992. pp. 231–240. [Google Scholar]
- Palmer AR, Winter IM. Coding of the fundamental frequency of voiced speech sounds and harmonic complex tones in the ventral cochlear nucleus. In: Mugnaini E, editor. Mammalian Cochlear Nuclei: Organization and Function. New York: Plenum; 1993. pp. 373–384. [Google Scholar]
- Patterson R. Auditory filter shapes derived with noise stimuli. J Acoust Soc Am. 1976;59:640–654. doi: 10.1121/1.380914. [DOI] [PubMed] [Google Scholar]
- Patterson R, Holdsworth J. A functional model of neural activity patterns and auditory images. In: Ainsworth W, editor. Advances in Speech, Hearing and Language Processing. London: JAI; 1994. pp. 547–563. [Google Scholar]
- Plomp R. The ear as a frequency analyzer. J Acoust Soc Am. 1964;36:1628–1636. doi: 10.1121/1.1910894. [DOI] [PubMed] [Google Scholar]
- Plomp R. Pitch of complex tones. J Acoust Soc Am. 1967;41:1526–1533. doi: 10.1121/1.1910515. [DOI] [PubMed] [Google Scholar]
- Preisler A, Schmidt S. Spontaneous classification of complex tones at high and ultrasonic frequencies in the bat, Megaderma lyra. J Acoust Soc Am. 1998;103:2595–2607. doi: 10.1121/1.422780. [DOI] [PubMed] [Google Scholar]
- Pressnitzer D, Patterson RD, Krumbholz K. The lower limit of melodic pitch. J Acoust Soc Am. 2001;109:2074–2084. doi: 10.1121/1.1359797. [DOI] [PubMed] [Google Scholar]
- Rhode WS. Interspike intervals as a correlate of periodicity pitch in cat cochlear nucleus. J Acoust Soc Am. 1995;97:2413–2429. doi: 10.1121/1.411963. [DOI] [PubMed] [Google Scholar]
- Ritsma RJ. Frequencies dominant in the perception of the pitch of complex sounds. J Acoust Soc Am. 1967;42:191–198. doi: 10.1121/1.1910550. [DOI] [PubMed] [Google Scholar]
- Ritsma RJ, Engel FL. Pitch of frequency-modulated signals. J Acoust Soc Am. 1964;36:1637–1644. [Google Scholar]
- Rose JE, Brugge JR, Anderson DJ, Hind JE. Phase-locked response to low-frequency tones in single auditory nerve fibers of the squirrel monkey. J Neurophysiol. 1967;30:769–793. doi: 10.1152/jn.1967.30.4.769. [DOI] [PubMed] [Google Scholar]
- Ruggero MA, Rich NC, Recio A, Narayan SS, Robles L. Basilar-membrane responses to tones at the base of the chinchilla cochlea. J Acoust Soc Am. 1997;101:2151–2163. doi: 10.1121/1.418265. [DOI] [PMC free article] [PubMed] [Google Scholar]
- Sachs MB, Abbas PJ. Rate versus level functions for auditory-nerve fibers in cats: tone-burst stimuli. J Acoust Soc Am. 1974;56(No 6):1835–1847. doi: 10.1121/1.1903521. [DOI] [PubMed] [Google Scholar]
- Sachs MB, Young ED. Encoding of steady-state vowels in the auditory nerve: representation in terms of discharge rate. J Acoust Soc Am. 1979;66:470–479. doi: 10.1121/1.383098. [DOI] [PubMed] [Google Scholar]
- Schroeder MR. Synthesis of low peak-factor signals and binary sequences with low autocorrelation. IEEE Trans Inform Theory. 1970;16:85–89. [Google Scholar]
- Schwartz DA, Purves D. Pitch is determined by naturally occurring periodic sounds. Hear Res. 2004;194:31–46. doi: 10.1016/j.heares.2004.01.019. [DOI] [PubMed] [Google Scholar]
- Seebeck A. Beobachtungen über einige Bedingungen der Entstehung von Tönen. Ann Phys Chem. 1841;53:417–436. [Google Scholar]
- Semal C, Demany L. The upper limit of “musical” pitch. Music Percept. 1990;8:165–175. [Google Scholar]
- Shackleton TM, Carlyon RP. The role of resolved and unresolved harmonics in pitch perception and frequency modulation discrimination. J Acoust Soc Am. 1994;95:3529–3540. doi: 10.1121/1.409970. [DOI] [PubMed] [Google Scholar]
- Shamma SA. Speech processing in the auditory system. I: The representation of speech sounds in the responses of the auditory nerve. J Acoust Soc Am. 1985a;78:1612–1621. doi: 10.1121/1.392799. [DOI] [PubMed] [Google Scholar]
- Shamma SA. Speech processing in the auditory system. II: Lateral inhibition and the central processing of speech evoked activity in the auditory nerve. J Acoust Soc Am. 1985b;78:1622–1632. doi: 10.1121/1.392800. [DOI] [PubMed] [Google Scholar]
- Shamma SA, Klein D. The case of the missing pitch templates: how harmonic templates emerge in the early auditory system. J Acoust Soc Am. 2000;107:2631–2644. doi: 10.1121/1.428649. [DOI] [PubMed] [Google Scholar]
- Shera CA, Guinan JJ, Jr, Oxenham AJ. Revised estimates of human cochlear tuning from otoacoustic and behavioral measurements. Proc Natl Acad Sci USA. 2002;99:3318–3323. doi: 10.1073/pnas.032675099. [DOI] [PMC free article] [PubMed] [Google Scholar]
- Shipley C, Carterette EC, Buchwald JS. The effect of articulation on the acoustical structure of feline vocalizations. J Acoust Soc Am. 1991;89:902–909. doi: 10.1121/1.1894652. [DOI] [PubMed] [Google Scholar]
- Shofner WP. Temporal representation of rippled noise in the anteroventral cochlear nucleus of the chinchilla. J Acoust Soc Am. 1991;90:2450–2466. doi: 10.1121/1.402049. [DOI] [PubMed] [Google Scholar]
- Siebert WM. Stimulus transformations in the peripheral auditory system. In: Kollers PA, Eden M, editors. Recognizing Patterns. Cambridge: MIT Press; 1968. pp. 104–133. [Google Scholar]
- Simmons JA, Moss CF, Ferragamo M. Convergence of temporal and spectral information into acoustic images of complex sonar targets perceived by the echolocating bat, Eptesicus fuscus. J Comp Physiol A. 1990;166:449–470. doi: 10.1007/BF00192016. [DOI] [PubMed] [Google Scholar]
- Smoorenburg GF, Linschoten DH. A neurophysiological study on auditory frequency analysis of complex tones. In: Wilson JP, editor. Psychophysics and Physiology of Hearing. London: Academic; 1977. pp. 175–184. [Google Scholar]
- Suta D, Kvasnak E, Popelar J, Syka J. Representation of species-specific vocalizations in the inferior colliculus of the guinea pig. J Neurophysiol. 2003;90:3794–3808. doi: 10.1152/jn.01175.2002. [DOI] [PubMed] [Google Scholar]
- Terhardt E. Pitch, consonance, and harmony. J Acoust Soc Am. 1974;55:1061–1069. doi: 10.1121/1.1914648. [DOI] [PubMed] [Google Scholar]
- Tomlinson RWW, Schwartz DWF. Perception of the missing fundamental in nonhuman primates. J Acoust Soc Am. 1988;84:560–565. doi: 10.1121/1.396833. [DOI] [PubMed] [Google Scholar]
- Viemeister NF. Psychophysical aspects of auditory coding. Auditory Function. In: Edelman GM, Gall WE, Cowan WM, editors. Neurobiological Bases of Hearing. New York: John Wiley; 1988. pp. 213–241. [Google Scholar]
- Ward WD. Subjective musical pitch. J Acoust Soc Am. 1954;26:369–380. [Google Scholar]
- Wightman FL. The pattern-transformation model of pitch. J Acoust Soc Am. 1973;54:407–416. doi: 10.1121/1.1913592. [DOI] [PubMed] [Google Scholar]
- Wilson J, Evans E. Proc 7th Int Congr on Acoustics. Budapest: 1971. Grating acuity of the ear: psychophysical and neurophysiological measures of frequency resolving power; pp. 397–400. [Google Scholar]
- Winslow RL, Sachs MB. Single-tone intensity discrimination based on auditory-nerve rate responses in backgrounds of quiet, noise, and with stimulation of the crossed olivocochlear bundle. Hear Res. 1988;35:165–190. doi: 10.1016/0378-5955(88)90116-5. [DOI] [PubMed] [Google Scholar]
- Winter IM, Palmer AR. Intensity coding in low-frequency auditory-nerve fibers of the guinea pig. J Acoust Soc Am. 1991;90:1958–1967. doi: 10.1121/1.401675. [DOI] [PubMed] [Google Scholar]
- Yost WA. The dominance region and ripple noise pitch: a test of the peripheral weighting model. J Acoust Soc Am. 1982;72:416–425. doi: 10.1121/1.388094. [DOI] [PubMed] [Google Scholar]
- Yost WA. Pitch of iterated rippled noise. J Acoust Soc Am. 1996;100:511–518. doi: 10.1121/1.415873. [DOI] [PubMed] [Google Scholar]