Abstract
We recently identified macrophage inflammatory protein 1-α (MIP-1α) as a factor produced by multiple myeloma (MM) cells that may be responsible for the bone destruction in MM (1). To investigate the role of MIP-1α in MM bone disease in vivo, the human MM–derived cell line ARH was stably transfected with an antisense construct to MIP-1α (AS-ARH) and tested for its capacity to induce MM bone disease in SCID mice. Human MIP-1α levels in marrow plasma from AS-ARH mice were markedly decreased compared with controls treated with ARH cells transfected with empty vector (EV-ARH). Mice treated with AS-ARH cells lived longer than controls and, unlike the controls, they showed no radiologically identifiable lytic lesions. Histomorphometric analysis demonstrated that osteoclasts (OCLs) per square millimeter of bone and OCLs per millimeter of bone surface of AS-ARH mice were significantly less than in EV-ARH mice, and the percentage of tumors per total bone area was also significantly decreased. AS-ARH cells demonstrated decreased adherence to marrow stromal cells, due to reduced expression of the α5β1 integrin and diminished homing capacity and survival. These data support an important role for MIP-1α in cell homing, survival, and bone destruction in MM.
Introduction
Myeloma bone disease is characterized by lytic bone lesions with little or no reactive new bone formation. Up to 80% of multiple myeloma (MM) patients present with bone pain, and over 70% of the patients will develop pathologic fractures during the course of their disease (1). Bone destruction in myeloma is a local event in which lesions only occur adjacent to myeloma cells. These data suggest that MM cells produce factors or induce factors that stimulate osteoclast (OCL) formation. We have used an expression cloning approach with a cDNA library constructed from RNA obtained from freshly isolated bone marrow samples from MM patients and screened it for osteoclast-activating factors (OAFs) that induce OCL formation in human and murine marrow cultures. We identified macrophage inflammatory protein 1-α (MIP-1α) as an OAF produced by myeloma cells in vivo (2). MIP-1α induced formation of bone-resorbing OCLs in human marrow cultures, acted directly on OCL precursors, and did not upregulate RANK ligand (RANKL) expression (3). Furthermore, MIP-1α enhanced the effects of IL-6 and RANKL, cytokines present in myeloma marrow, on OCL formation (3). Previously, Kukita and coworkers (4) reported that MIP-1α induces OCL formation in rat bone marrow cultures, and Fuller and coworkers (5) have shown that MIP-1α is chemotactic for OCLs. More importantly, MIP-1α levels are increased in marrow plasma from myeloma patients with active disease, whereas MIP-1α levels are reduced to almost normal levels in patients who are in complete remission, or have inactive disease, or who have stage I myeloma (2). Furthermore, addition of a neutralizing Ab to MIP-1α blocked the OAF activity present in bone marrow plasma samples from patients with myeloma (2). The purpose of the current study was to determine the role of MIP-1α in an in vivo model of human myeloma bone disease. We reported previously that intravenous injection of the human myeloma-derived cell line, ARH, into sublethally irradiated SCID mice induces myeloma in these animals (1). These mice develop all the characteristics of myeloma bone disease, including lytic bone lesions, hypercalcemia, and increased OCL formation in areas adjacent to the myeloma cells. ARH cells produce high levels of MIP-1α. Therefore, ARH cells were stably transfected with either an antisense construct to MIP-1α or an empty vector and transplanted into SCID mice to determine the role of MIP-1α in this animal model of human myeloma bone disease.
Methods
Construction of ARH cell lines stably transfected with an antisense construct to human MIP-1α or empty vector.
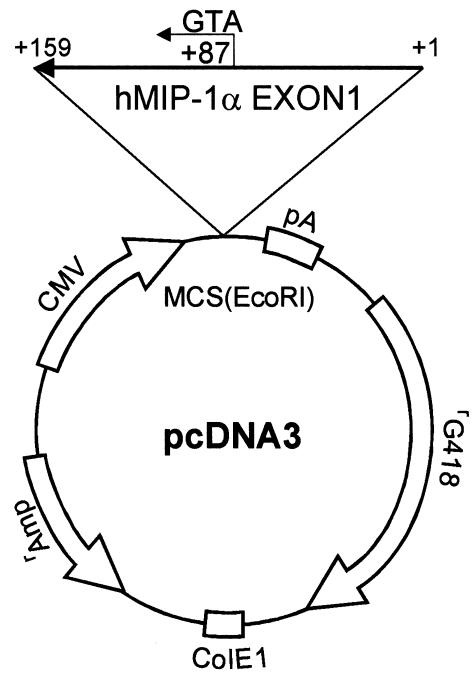
The MIP-1α antisense clone was constructed in the pcDNA3 vector. The first exon of the human MIP-1α cDNA (159 bp) (6) was generated by standard PCR techniques using MIP-1α–specific primers, 5′- CAG AAG GAC ACG GGC AGC AG-3′ (sense) and 5′-GTG ATG CAG AGA ACT GGT TG-3′ (antisense) (6). The PCR product was cloned into the TA cloning vector (Invitrogen Corp., Carlsbad, California, USA), followed by DNA sequence analysis. The first exon of the MIP-1α cDNA was then digested with the EcoRI restriction enzyme and inserted in the reverse orientation into the vector that was linearized with the EcoRI restriction enzyme (Figure 1). The orientation of the MIP-1α construct was determined using PCR techniques with the T7 and MIP-1α sense and antisense primers, followed by DNA sequencing. ARH cells (105) in exponential growth phase were plated in RPMI-1640 media containing 10% FBS (Life Technologies Inc., Rockville, Maryland, USA) into six-well plates for 24 hours and then were transfected with the MIP-1α antisense construct or the empty vector using Lipofectamine Plus (Life Technologies Inc.) in serum-free media, according to the manufacturer’s protocol. Twenty-four hours after transfection, the media was removed, and fresh media containing 10% FBS and 500 μg/ml of G418 was added. After 2 weeks of culture with G418, ARH cells were diluted into 96-well plates to isolate single clones, the clones expanded, and expression levels of MIP-1α were determined using a human MIP-1α (hMIP-1α) immunoassay kit (R&D Systems Inc., Minneapolis, Minnesota, USA). Transfection of ARH cells with pcDNA3–β–GAL reporter constructs and a β-galactosidase assay were used for determination of the transfection efficiency. The empty vector control ARH cell line was produced as described above, except that the cells were stably transfected with the empty pcDNA3 vector. We established two permanent cell lines from both antisense (AS) and empty vector (EV) transfected cells. Growth patterns for the parental ARH cells (WT-ARH) and the antisense MIP-1α (AS-ARH) or empty vector control cells (EV-ARH) were determined by culturing the cells (104 cells/well) for 7 days in RPMI-1640 media containing 10% FBS (Life Technologies Inc.) in the presence or absence of the ST2 murine marrow stromal cell line (104 cells/dish) on dentin slices in 48-well plates. The ST2 cells cultured on dentin were used as a model of the bone microenvironment. The number of cells at each time point was then counted. MIP-1α levels in the conditioned media at the end of 3 days of culture were determined in triplicate cultures using a commercial ELISA assay (R&D Systems Inc.). There was no significant difference in the growth characteristics of either the WT-ARH, AS-ARH, or EV-ARH cell lines. The AS-ARH cell line that produced the lowest levels of MIP-1α in the conditioned media was then used for in vivo studies.
Figure 1.
Construction of MIP-1α antisense. The first exon of MIP-1α cDNA was generated by standard PCR techniques as described in Methods. The identity of the MIP-1α cDNA was confirmed by sequence analysis, and it was subcloned into the pcDNA3 vector. Clones that had the reverse orientation for the MIP-1α cDNA were screened by PCR, and the orientation was confirmed by DNA sequence analysis.
Assay of adhesion properties and mRNA expression of human β1 integrins in WT-ARH, EV-ARH, or AS-ARH cells in vitro.
The adhesion assay was performed according to the methods of Kim et al. (7) with minor modifications. ST2 cells (106) were plated in six-well plates in αMEM (Life Technologies Inc.) containing 10% FBS. After 24 hours, WT-, EV-, and AS-ARH cells (106) were added to the ST2 cells and the cells cocultured in RPMI-1640 media containing 10% FBS for 3 days. The culture plates were then washed extensively with 3 ml of serum-free RPMI-1640 five times. The remaining cells were fixed with acetone, stained with hematoxylin, and counterstained with eosin. Plasma cells (EV-ARH, AS-ARH, or WT-ARH) that were stained blue and attached to the ST2 cells were scored in ten random microscopic fields (×400).
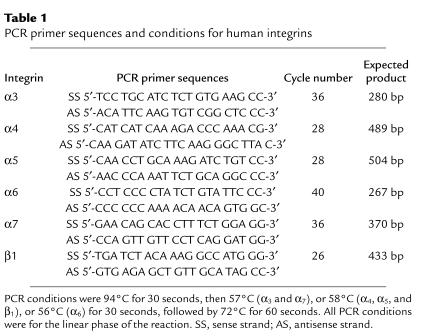
Human β1 integrin mRNA expression levels in WT-, EV-, or AS-ARH cells were determined by RT-PCR analysis. PCR primers and PCR conditions for the human α3, α4, α5, α6, α7, and β1 integrins are shown in Table 1. Human-specific GAPDH was used as an internal control using human-specific GAPDH primers (208 bp), 5′-CTC TGA CTT CAA CAG CGA CA-3′ (sense) and 5′-TCT CTC TCT TCC TCT TGT GC-3′ (antisense). All PCR conditions were in the linear phase of the reaction. In selected experiments blocking Ab (20 mg/ml) to the α5 of the α5β1 integrin (P1D6; Life Technologies Inc.) was added to the cocultures.
Table 1.
PCR primer sequences and conditions for human integrins
Western blot analysis of the α5 integrin in WT-, EV-, and AS-ARH cells.
The protein levels of human α5 integrin were tested by Western blot analysis. WT-, EV-, and AS-ARH cells (105) were suspended in 200 μl of SDS gel loading buffer and subjected to PAGE analysis. Gels were transferred to nitrocellulose membranes and the membranes blotted with an anti-CD49e (α5 integrin) mAb (1:200) (P1D6; Life Technologies Inc.), followed by anti-mouse IgG conjugated to peroxidase (Sigma Chemical Co., St. Louis, Missouri, USA) and visualized by chemiluminescence on x-ray films. Anti–β-actin mAb (Sigma Chemical Co.) was used as an internal control on the same membranes after stripping the anti-CD49e Ab with 1% SDS.
Development of myeloma bone disease and tumor burden in SCID mice transplanted with AS-ARH or EV-ARH cells in vivo.
Three million WT-ARH cells, AS-ARH cells, or EV-ARH cells were injected intravenously into SCID mice that had received 3.75 Gy of total body irradiation 24 hours before transplantation. We have shown previously that this protocol is sufficient to induce myeloma bone disease in these mice within 28–35 days after transplantation (1). The animals were then observed for development of myeloma bone disease, hypercalcemia, and survival as described previously (1). Once the animals developed paraplegia, they were euthanized, and the vertebrae and long bones were subjected to histomorphometric analysis for OCL and osteoblast surfaces, area eroded, OCLs per unit area, and tumor volume, as described previously (8). At the end of the experiment, MIP-1α levels were measured in marrow plasma, and human IgG (hIgG) levels were measured in serum of animals by commercially available ELISA assays (MIP-1α; R&D Systems Inc.) (hIgG; AlerCHEK Inc., Portland, Maine, USA). In addition, marrow plasma samples from the animals were tested for their capacity to simulate OCL formation in human marrow cultures, as described below. In selected experiments, mice were transplanted with AS-ARH or EV-ARH cells as described above and sacrificed at 3, 6, 9, or 15 days after transplantation and evaluated for the presence of tumor cells by PCR using human-specific GAPDH primers (see above) and by histomorphometry. GAPDH primers that detected a consensus sequence in both murine and human GAPDH were used as an internal control for total GAPDH expression (sense 5′-ACC ACA GTC CAT GCC ATC AC-3′; antisense 5′-TCC ACC ACC CTG TTG CTG TA-3′).
OCL formation assays.
Nonadherent human bone marrow mononuclear cells were obtained from normal donors as described previously (9) and tested for their capacity to form OCL-like multinucleated cells (MNCs) in long-term marrow cultures. These studies were approved by the Institutional Review Board of the University of Texas Health Science Center at San Antonio. The cultures were treated with either 200 pg/ml of recombinant hMIP-1α (R&D Systems Inc.) or 10% vol/vol marrow plasma from animals transplanted with WT-ARH cells, EV-ARH cells, or AS-ARH cells. Marrow plasma was obtained by flushing the femurs with 0.5 ml αMEM-10% FBS containing 100 U/ml preservative-free heparin, pelleting the cells by centrifugation for 10 minutes at 1,500 g, and collecting the supernatants. In selected experiments, the cultures were also treated with a neutralizing Ab to human MIP-1α (5 ng/ml) (R&D Systems Inc.), which is sufficient to neutralize up to 500 pg/ml of MIP-1α. At the end of the 3 weeks of culture, the number of MNCs that cross-reacted with the 23c6 mAb was determined. The 23c6 mAb identifies OCL-like cells that express calcitonin receptors and resorb bone (3).
Fluorescence-activated cell sorter analysis of ARH cells for expression of CD29 (β1 integrin), CD49e (α5 integrin), and CD18 (β2 integrin).
Analyses were performed as outlined previously (10). Briefly, tubes containing 106 AS-ARH or EV-ARH cells were prepared and 20 μl of Ab were added to 100 μl of cell suspension (107 cells/ml). The cells were incubated for 30 minutes at 4°C. After washing to remove unbound Ab, the percentage of cells expressing the different integrins was determined by flow cytometry (FACScalibur; Becton Dickinson Immunocytometry Systems, Mountain View, California, USA). Twenty thousand events were collected. Analysis of results was done using the Cell-Quest Program (Becton Dickinson Immunocytometry Systems), and the percentage of positive cells obtained was corrected for background staining by subtracting the value obtained from the isotype Ab control. Anti-β1 integrin (4B4, CD29-FITC), anti-α5 (CD49e-FITC), and anti-β2 integrin (CD18-FITC) were from Immunotech (Immunotech, Marseilles, France). Ab’s and isotype-matched controls were from the same company.
Statistical analysis.
In vitro and in vivo results are reported as the mean plus or minus SEM for five replicate samples and were compared by the Student t test. Results were considered significantly different for P values less than 0.05.
Results
As shown in Figure 2a, there was no significant difference in the growth characteristics of WT-ARH, EV-ARH, or AS-ARH cells. Furthermore, coculture of the WT-ARH, AS-ARH, or EV-ARH cells with the ST2 cells, a murine marrow stromal cell line, on dentin slices demonstrated similar growth characteristics (Figure 2b). However, MIP-1α levels in media conditioned for 3 days by the cells were significantly different (Figure 2c). AS-ARH cells produced approximately 30–50 pg/ml of MIP-1α in the 3-day conditioned media, in contrast to 1,000–1,200 pg/ml of MIP-1α for the WT-ARH cell line or EV-ARH cells.
Figure 2.
Growth characteristics of WT-, EV-, and AS-ARH cells in vitro. (a) WT-, EV-, and AS-ARH cells (105) were cultured in six-well plates containing RPMI-1640 media containing 10% FBS. At days 3 and 5 of the culture, the cells were sampled, stained with trypan blue, and counted. (b) ST2 cells (104) in αMEM containing 10% FBS were plated onto dentin slices in 48-well plates. After 24 hours, WT-, EV-, and AS-ARH cells (104) in RPMI-1640 media containing 10% FBS were added to the culture. At days 4 and 7 of the culture, viable cells were scored as described above. Growth rates of WT-, EV-, and AS-ARH cells were not significantly different in the presence or absence of ST2 cells cocultured on dentin slices. (c) Conditioned media from WT-, EV-, or AS-ARH cells (105/ml) cultured in RPMI-1640 media containing 10% FBS were harvested at day 3, and the expression levels of MIP-1α were measured with a MIP-1α ELISA kit according to the manufacturer’s protocol. Similar results were seen in three independent experiments (*P < 0.0001).
We then transplanted SCID mice, which had been previously sublethally irradiated, with 3 × 10⁶ AS-ARH, EV-ARH, or WT-ARH cells to determine their effects on development of myeloma bone disease and tumor burden in these animals. SCID mice transplanted with AS-ARH cells had a median survival that was longer compared with the mice injected with WT-ARH or EV-ARH cells (AS-ARH, 28 ± 4 days vs. WT-ARH, 20 ± 2 days, or EV-ARH, 23 ± 3 days). These results did not reach statistical significance (P = 0.06) because of the large variability in survival of these animals in three independent experiments. However, in all experiments, AS-ARH mice lived longer than EV-ARH or WT-ARH mice. Animals receiving WT- or EV-ARH cells all developed paraplegia before death due to vertebral involvement by myeloma. In contrast, animals receiving AS-ARH cells never developed paraplegia, but died of a wasting disease most likely reflecting extramedullary involvement by their myeloma. As shown in Figure 3a, MIP-1α levels were reduced to almost undetectable levels (< 10 pg/ml) in marrow plasma from the vertebrae or femurs of animals transplanted with AS-ARH cells. In contrast, the levels of human MIP-1α, although variable, were markedly elevated in marrow plasma from animals transplanted with either the WT-ARH or the EV-ARH cells. Furthermore, as shown in Figure 3b, the levels of human IgG, which are an indicator of tumor burden, were significantly decreased in the marrow plasma of animals implanted with AS-ARH cells (0.1–1.0 μg/ml) compared with EV-ARH cells or WT-ARH cells (80–120 μg/ml).
Figure 3.
Survival of SCID mice implanted with WT-, ET-, or AS-ARH cells and expression of MIP-1α in vivo. WT-, EV-, and AS-ARH cells were infused intravenously into SCID mice (n = 10 per group) as described in Methods and were sacrificed when they became paraplegic. Femurs and vertebrae were then removed and bone marrow plasma obtained by flushing the bones with 1 ml of serum-free αMEM. Expression levels of hMIP-1α (a) and human IgG (b) were measured with ELISA kits. hMIP-1α expression in mice implanted with AS-ARH cells was reduced to almost undetectable levels. Human IgG levels, which are indicators of tumor burden, were significantly reduced in AS-ARH mice compared with WT- or EV-ARH mice, but were still detectable (0.1–1 μg/ml). Similar results were seen in three independent experiments (*P < 0.0001).
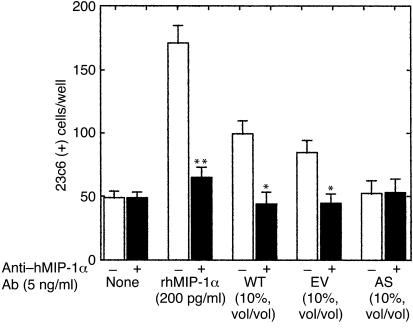
We then determined if the marrow plasma from SCID mice implanted with the various ARH cell lines could stimulate OCL formation in human marrow cultures. As shown in Figure 4, marrow plasma from animals bearing the WT-ARH cells or animals implanted with EV-ARH cells stimulated OCL formation in human marrow cultures. The OCL stimulatory activity present in marrow plasma from these animals was totally inhibited by a neutralizing Ab to MIP-1α (Figure 4). In contrast, marrow plasma from SCID mice implanted with AS-ARH cells did not stimulate OCL-like cell formation in human marrow cultures.
Figure 4.
Effect of bone marrow plasma from SCID mice implanted with WT-, ET-, or AS-ARH cells on human OCL-like formation. Bone marrow plasma (10% vol/vol) from SCID mice infused with WT-, ET-, or AS-ARH cells that were obtained at the time they developed paraplegia, was added to human bone marrow cultures in the absence of exogenously added osteoclastogenic factors. rhMIP-1α (200 pg/ml) stimulated OCL-like MNC formation, which was blocked by the MIP-1α–neutralizing Ab (5 ng/ml). Bone marrow plasma from WT- or EV-ARH mice stimulated OCL-like MNC formation that was blocked by the MIP-1α neutralizing Ab. In contrast, bone marrow plasma from AS-ARH mice did not stimulate OCL-like MNC formation. Similar results were seen in two independent experiments (*P < 0.05; **P < 0.01).
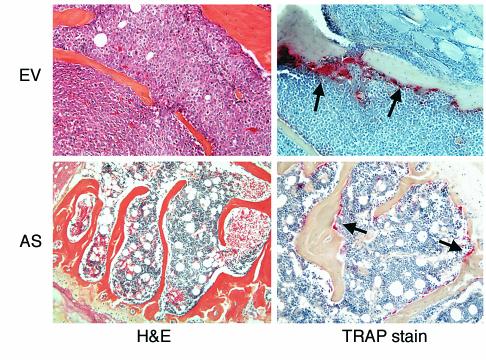
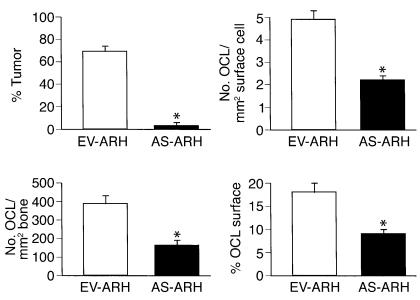
As shown in Figure 5, animals infused with EV-ARH cells developed lytic bone lesions and increased OCL formation (upper right panel; shown by the red tartrate-resistant acid phosphatase [TRAP] stain). In contrast, animals infused with AS-ARH cells did not demonstrate increased OCL formation or bone resorption (lower right panel). In addition, tumor burden in the bones of animals treated with AS-ARH cells (upper left panel) was markedly decreased compared with animals infused with empty vector-transduced cells (lower left panel). AS-ARH cells could be detected histologically in the bone marrow sections from animals transfected with the antisense construct to MIP-1α, but they were rare. Histomorphometric analysis of the vertebral bodies from these animals demonstrated that OCL numbers per square millimeter of bone and per millimeter of bone surface area were significantly reduced in animals receiving AS-ARH cells compared with EV-ARH cells (Figure 6). The percentage of tumor per total bone area was also significantly decreased in animals treated with AS-ARH cells compared with animals treated with EV-ARH cells. There was no increase in extramedullary tumor as determined by metastases to liver and spleen (data not shown).
Figure 5.
Histology of bone sections from SCID mice implanted with EV- or AS-ARH cells. As shown in the panels stained with hematoxylin and eosin (H&E), mice implanted with AS-ARH cells had significantly reduced tumor burden compared with mice implanted with EV-ARH cells. OCL number was markedly reduced in SCID mice implanted with AS-ARH cells compared with the mice implanted with EV-ARH cells.
Figure 6.
Histomorphometric analysis of bone sections from SCID mice. Mice treated with AS-ARH cells had markedly reduced tumor burden compared with mice receiving EV-ARH cells. Furthermore, the number of OCLs per square millimeter of surface, the number of OCLs per square millimeter of bone area, and the percentage of active OCL surface were significantly reduced in AS-ARH mice compared with the EV-ARH mice (*P < 0.05).
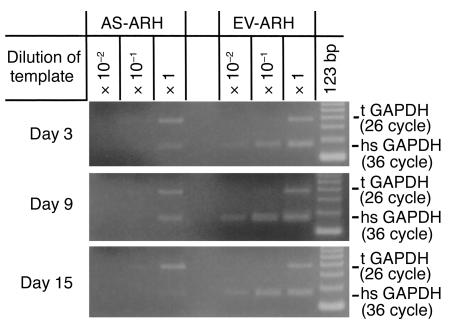
To determine if the decreased tumor burden and bone destruction in SCID mice implanted with AS-ARH cells compared with EV-ARH cells was due to decreased homing and engraftment of the AS-ARH cells, mice were transplanted with the cells and sacrificed at 3-day intervals after transplantation. As shown in Figure 7, mRNA expression levels of human-specific GAPDH in mice transplanted with AS-ARH cells were decreased by day 3 compared with animals infused with EV-ARH cells, but were detectable. The level of human GAPDH decreased further by days 9 and 15.
Figure 7.
Expression levels of human-specific GAPDH mRNA from SCID mice implanted with EV- or AS-ARH cells at 3 to 15 days after cell infusion. Mice were infused with EV- or AS-ARH as described in Methods and sacrificed at 3-day intervals. Marrow samples were harvested and tested for human-specific GAPDH (hsGAPDH) mRNA expression by serial dilution RT-PCR analysis. The amount of hsGAPDH present in the bone marrow of SCID mice at days 3, 9, and 15 was significantly decreased compared with that of EV-ARH. The hsGAPDH was detectable up to 15 days in bone marrow of SCID mice infused with AS-ARH cells. In contrast, hsGAPDH levels in mice transplanted with EV-ARH cells were at least two logs higher compared with that in mice infused with AS-ARH cells. GAPDH primers that could detect both murine and human GAPDH mRNA were used as an internal control (tGAPDH).
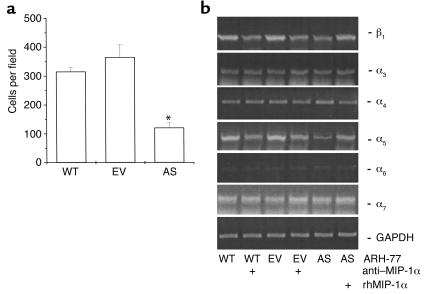
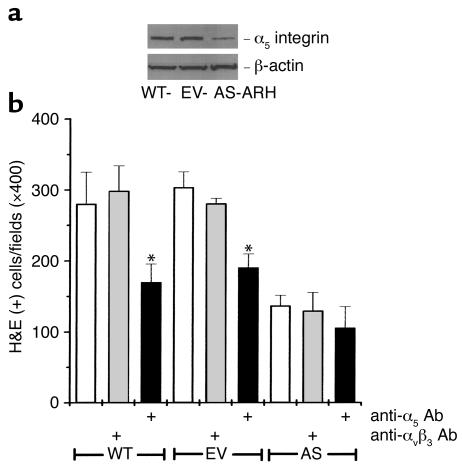
Since MIP-1α enhances expression of adhesion molecules on cells (11, 12), we then assessed if the decreased tumor burden in AS-ARH cell–transplanted animals resulted from decreased adherence of AS-ARH cells to marrow stromal cells. As shown in Figure 8a, adherence of AS-ARH cells to ST2 marrow cells was decreased compared with that of EV-ARH cells. We then measured β1 integrin mRNA levels in EV-ARH and AS-ARH cells. The VLA-4 (α4β1) and VLA-5 (α5β1) integrins have been shown to mediate adherence of myeloma cells to marrow stromal cells (13, 14). As shown in Figure 8b, α4 mRNA expression levels were similar in AS-ARH cells and EV-ARH cells regardless of treatment with a neutralizing Ab to MIP-1α or rhMIP-1α. In contrast, the expression of α5 and β1 mRNA was decreased and was increased by addition of MIP-1α in AS-ARH cells. Furthermore, treatment of WT-ARH and EV-ARH cells with the anti–MIP-1α Ab decreased α5β1 expression. To confirm that α5 expression was decreased at the protein level, Western blot analysis was performed. As shown in Figure 9a, α5 expression levels were markedly decreased in AS-ARH cells compared with WT- or EV-ARH cells.
Figure 8.
Adhesion of WT-, EV-, or AS-ARH cells to ST2 mouse marrow stromal cells and expression levels of human β1 integrin mRNAs. (a) WT-, EV-, or AS-ARH cells (106) in RPMI-1640 media containing 10% FBS were cocultured with ST2 mouse stromal cells (106) in six-well plates. After 4 days, the plates were extensively washed with 3 ml of serum-free RPMI-1640 media five times to remove nonadherent ARH cells. The cells were fixed with acetone followed by H&E staining. Blue-stained plasma cells attached onto ST2 cells were scored using an inverted microscope by counting ten random fields (×400). The number of AS-ARH cells attached onto ST2 mouse stromal cells was significantly reduced compared with the EV- or WT-ARH cells. (b) Expression levels of the mRNAs for the β1 integrin were measured as described in Methods. Expression levels for the human α3, α4, α6, α7 integrins mRNAs were not affected by MIP-1α. In contrast, mRNA expression levels for the human α5 and β1 integrins were significantly decreased in AS-ARH cells and increased two- to fourfold in AS-ARH cells treated with MIP-1α. Treatment of WT- or EV-ARH cells with an anti–MIP-1α Ab decreased mRNA expression of the human α5 and β1 integrins by approximately 50% (*P < 0.05). Similar results were seen in two independent experiments.
Figure 9.
Expression of human integrin α5 in WT-, EV-, or AS-ARH cells and the effects of an anti-CD49e Ab (human integrin α5) on the adherence of ARH cells to ST2 mouse marrow stromal cells. (a) Western blot analysis for expression of the α5 integrin of VLA5 in WT-, EV-, and AS-ARH cells. Western blot analysis was performed as described in Methods. A greater than 70% reduction in α5 was seen in AS-ARH cells compared with WT- or EV-ARH cells. A similar pattern of results was seen in two independent experiments. (b) Effects of an Ab to the α5 integrin of VLA5 on adherence of ARH cells to ST2 marrow stromal cells. Adhesion assays were performed as described in Methods. Ab to α5 but not to αvβ3 blocked the adherence of WT- or EV-ARH cells to ST2 cells. A similar pattern of results was seen in two independent experiments. *P < 0.05.
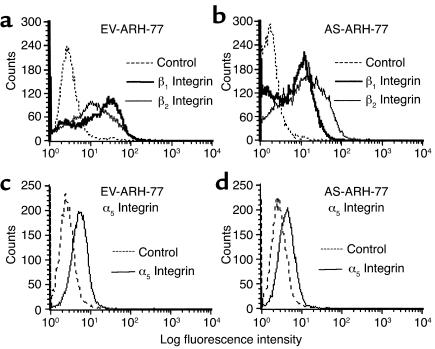
Results from PCR studies suggested that transfection of ARH cells with antisense to MIP-1α resulted in downregulation of (α5β1) mRNA. We then analyzed surface expression of β2 integrin (CD18), β1 integrin (CD29), and α5 integrin (CD49e) by immunofluorescence staining and flow cytometry. The results are depicted in Figure 10. As can be seen in Figure 10, a marked decrease in the fluorescence intensity (peak mean channel, or PMC) of β1 integrin was observed in AS-ARH compared with EV-ARH (from 28–31, to 14 units of fluorescence, respectively) with a concomitant decrease in the percentage of positive cells from 58% to 34%. In contrast to β1 integrins, no decrease in PMC was observed in surface staining for β2 integrins between EV-ARH and AS-ARH. Similarly, a decrease in α5 was also observed in AS-ARH cells compared with EV-ARH cells from 58% positive cells to 22% positive cells, although the overall staining for α5 was much lower compared with β1. A concomitant decrease in PMC from 9.3 to 7.1 for α5 expression by AS-ARH cells was observed, consistent with the observed decrease in the percentage of positive cells.
Figure 10.
Immunofluorescence staining for CD18, CD29, and CD49e. Cells were stained and analyzed as described in Methods. Staining for EV-ARH cells was compared with AS-ARH cells for a given Ab. For each Ab, cells were also stained with isotype-matched control Ab to correct for background staining. Twenty thousand cells were analyzed for each sample. (a and c) EV-ARH cells. (b and d) AS-ARH cells.
These data suggested that decreased expression of the α5β1 integrin in AS-ARH cells was responsible for their decreased adherence to marrow stromal cells. To test this possibility, WT-, EV-, or AS-ARH cells were cocultured with ST-2 cells in the presence or absence of a blocking Ab to the α5 integrin, an isotype control Ab, or anti-αvβ3. As shown in Figure 9b, treatment of the cocultures with the anti-α5 Ab significantly decreased the binding of WT- or EV-ARH cells to marrow stromal cells. Anti-αvβ3 or the isotype control Ab did not affect the adherence of WT or EV-ARH cells to ST2 cells.
Discussion
The current study demonstrates that blocking MIP-1α activity in an in vivo model of human myeloma bone disease decreases both bone destruction and tumor burden in these animals. Combined with our previous data that MIP-1α levels are increased in patients with active myeloma, these data suggest that MIP-1α may be an important factor in mediating the growth of myeloma and bone disease. MIP-1α can also enhance the effects of IL-6 and RANKL, osteoclastogenic factors that stimulate OCL formation and that are increased in the marrow of MM patients (3) to further amplify the bone destructive process in patients with myeloma (3). Consistent with our observation that MIP-1α stimulates OCL formation in vivo are the results of Oyajobi et al. (15) who reported that Chinese hamster ovary (CHO) cells constitutively expressing MIP-1α increased OCL formation and bone destruction in vivo. Furthermore, Uneda et al. (16) have shown that high MIP-1α levels in patients with myeloma are associated with a poor prognosis in myeloma patients. Taken together, these data demonstrated that MIP-1α is an osteoclastogenic factor that is active in vivo and whose levels are elevated in patients with myeloma.
Blocking MIP-1α activity in ARH cells decreased the tumor burden in SCID mice. Several possibilities may explain these results. The first is that MIP-1α may be required for the growth of myeloma cells acting as an autocrine/paracrine growth factor for myeloma cells in vivo. However, treating ARH cells with a neutralizing Ab to MIP-1α did not inhibit the growth of these cells (unpublished results), and adding rhMIP-1α to cultures of AS-ARH cells did not enhance their growth.
MIP-1α may also increase adhesive interactions between myeloma cells and marrow stromal cells and affect myeloma cell homing and growth, analogous to its effects on T cells and monocytes (11, 12). Dalton and coworkers (17, 18) have shown that adhesive interactions between integrins on myeloma cells and VCAM-1 are important in chemosensitivity of myeloma cells and the capacity of myeloma cells to upregulate IL-6 production by marrow stromal cells. Because IL-6 is a myeloma growth factor and blocks apoptosis of myeloma cells, these adhesive interactions likely play an important role in myeloma cell growth in the bone marrow. Robledo et al. (14) have also reported that expression of VLA4 and VLA5 integrins are important in the attachment of myeloma cells to marrow stromal cells. Our results demonstrate that decreased MIP-1α activity in ARH cells results in decreased expression of the α5β1 integrin, which appears to be important in these interactions. Further support for the role of α5β1 integrin comes from our surface staining for CD29 and CD49e in which a marked decrease in fluorescence intensity and percentage of positive cells was observed in AS-ARH compared with EV-ARH. Consistent with this hypothesis is our finding that α5β1 integrin expression in AS-ARH cells but not α4β1 was decreased compared with EV-ARH cells and that a blocking Ab to α5 significantly decreased the adherence of ARH cells to ST2 cells. These results suggest adhesive interactions involving the α5β1 integrin appear to be responsible in part for the adherence of ARH cells to marrow stromal cells.
Furthermore, although the growth of AS-ARH cells and EV-ARH cells on ST2 cells in vitro was similar, AS-ARH cell levels, as measured by the expression of human-specific GAPDH mRNA in the marrow of mice transplanted with these cells, decreased over time in vivo. These data suggest that MIP-1α may induce factors produced by marrow stromal cells that enhance the growth and survival of myeloma cells in the marrow. The factor is not IL-6, since ARH cells do not require IL-6 for their growth. Other factors that are induced by MIP-1α and are yet to be identified may be playing a role in the survival of these cells.
Alternatively, increased OCL activity may be required for maintaining myeloma cells in the bone marrow. OCLs produce a variety of factors that can stimulate the growth of myeloma cells, including IL-6 (19). In support of this possibility are the results of Yaccoby et al. (20), who showed that treating SCID/Hu mice with either RANK-Fc or bisphosphonates, factors that inhibit OCL activity, markedly decreased myeloma tumor burden in these animals. However, bisphosphonates can also induce apoptosis of myeloma cells (21, 22).
Finally, the decreased tumor burden seen in mice transplanted with AS-ARH cells may result from decreased homing of AS-ARH cells. Consistent with this possibility is our finding that AS-ARH cell–derived GAPDH mRNA levels in SCID mice were lower at day 3 than those from mice transplanted with EV-ARH cells. However, decreased homing of AS-ARH cells to the marrow does not completely explain our results since human-specific GAPDH mRNA could be detected in marrow samples of SCID mice infused with AS-ARH cells for at least 15 days (Figure 7), although it declined over time.
In summary, blocking MIP-1α activity has profound effects on myeloma cell growth, homing, and bone destruction in this in vivo model of myeloma. These data suggest that antagonists that block MIP-1α activity in vivo may be useful agents for treating patients with myeloma to decrease both their tumor burden and bone destruction.
Acknowledgments
The authors thank Bibi Cates and Donna Gaspich for preparation of the manuscript. This work was supported by research funds from the Veterans Administration, NIH grants AG-13625, AR-41336, AR-44603, and grant CA40035 from the National Cancer Institute.
References
- 1.Alsina M, et al. Development of an in vivo model of human multiple myeloma bone disease. Blood. 1996;87:1495–1501. [PubMed] [Google Scholar]
- 2.Choi SJ, et al. Macrophage inflammatory protein 1-alpha (MIP-1α) is a potential osteoclast stimulatory factor in multiple myeloma. Blood. 2000;96:671–675. [PubMed] [Google Scholar]
- 3.Han JH, Choi SJ, Kurihara N, Oba Y, Roodman GD. Macrophage inflammatory protein 1-alpha is an osteoclastogenic factor in myeloma that is independent of RANK ligand. Blood. 2001;97:3349–3353. doi: 10.1182/blood.v97.11.3349. [DOI] [PubMed] [Google Scholar]
- 4.Kukita T, et al. Macrophage inflammatory protein-1α (LD78) expressed in human bone marrow: its role in regulation of hematopoiesis and osteoclast recruitment. Lab Invest. 1997;76:399–406. [PubMed] [Google Scholar]
- 5.Fuller K, Owens JM, Chambers TJ. Macrophage inflammatory protein-1-alpha and IL-18 stimulate the motility but suppress the resorption of isolated rat osteoclasts. J Immunol. 1995;154:6065–6072. [PubMed] [Google Scholar]
- 6.Nakao M, Nomiyama H, Shimada K. Structures of human genes coding for cytokine LD78 and their expression. Mol Cell Biol. 1990;10:3646–3658. doi: 10.1128/mcb.10.7.3646. [DOI] [PMC free article] [PubMed] [Google Scholar]
- 7.Kim I, Uchiyama H, Chauhan D, Anderson KC. Cell surface expression and functional significance of adhesion molecules on human myeloma-derived cell lines. Br J Haematol. 1994;87:483–493. doi: 10.1111/j.1365-2141.1994.tb08302.x. [DOI] [PubMed] [Google Scholar]
- 8.Choi SJ, Devlin RD, Chung H, Roodman GD, Reddy SV. Cloning and identification of human Sca as a novel inhibitor of osteoclast formation and bone resorption. J Clin Invest. 1998;102:1360–1368. doi: 10.1172/JCI2667. [DOI] [PMC free article] [PubMed] [Google Scholar]
- 9.Kurihara N, Chenu C, Miller M, Civin CI, Roodman GD. Identification of committed mononuclear precursors for osteoclast-like cells formed in long-term human marrow cultures. Endocrinology. 1990;126:2733–2741. doi: 10.1210/endo-126-5-2733. [DOI] [PubMed] [Google Scholar]
- 10.Gazitt Y, Shaughnessy P, Liu Q. Expression of adhesion molecules on CD34+ cells in peripheral blood of non-Hodgkin’s lymphoma patients mobilized with different growth factors. Stem Cells. 2001;19:134–143. doi: 10.1634/stemcells.19-2-134. [DOI] [PubMed] [Google Scholar]
- 11.del Pozo MA, Sanchez-Mateos P, Nieto M, Sanchez-Madrid F. Chemokines regulate cellular polarization and adhesion receptor redistribution during lymphocyte interaction with endothelium and extracellular matrix. Involvement of cAMP signaling pathway. J Cell Biol. 1995;131:495–508. doi: 10.1083/jcb.131.2.495. [DOI] [PMC free article] [PubMed] [Google Scholar]
- 12.Vaddi K, Newton RC. Regulation of monocyte integrin expression by beta-family chemokines. J Immunol. 1994;153:4721–4732. [PubMed] [Google Scholar]
- 13.Michigami T, et al. Cell-cell contact between marrow stromal cells and myeloma cells via VCAM-1 and α4β1 integrin enhances production of osteoclast-stimulating activity. Blood. 2000;96:1953–1960. [PubMed] [Google Scholar]
- 14.Robledo MM, Sanz-Rodriguez F, Hidalgo A, Teixido J. Differential use of very late antigen-4 and -5 integrins by hematopoietic precursors and myeloma cells to adhere to transforming growth factor-β1-treated bone marrow stroma. J Biol Chem. 1998;273:12056–12060. doi: 10.1074/jbc.273.20.12056. [DOI] [PubMed] [Google Scholar]
- 15.Oyajobi BO, et al. Macrophage inflammatory protein (MIP)-1α stimulates osteoclast formation and bone resorption in vivo. Blood. 2000;96:362a. [Google Scholar]
- 16.Uneda S, et al. Production of MIP-1α by human myeloma cells and its clinical significance. Blood. 2000;96:363a. (Abstr.) [Google Scholar]
- 17.Damiano JS, Cress AE, Hazlehurst LA, Shtil AA, Dalton WS. Cell adhesion mediated drug resistance (CAM-DR): role of integrins and resistance to apoptosis in human myeloma cell lines. Blood. 1999;93:1658–1667. [PMC free article] [PubMed] [Google Scholar]
- 18.Hazlehurst LA, Damiano JS, Buyuksal I, Pledger WJ, Dalton WS. Adhesion to fibronectin via beta1 integrins regulates p27kip1 levels and contributes to cell adhesion mediated drug resistance (CAM-DR) Oncogene. 2000;19:4319–4327. doi: 10.1038/sj.onc.1203782. [DOI] [PubMed] [Google Scholar]
- 19.Roodman GD, et al. Interleukin-6: A potential autocrine/paracrine factor in Paget’s disease of bone. J Clin Invest. 1992;89:46–52. doi: 10.1172/JCI115584. [DOI] [PMC free article] [PubMed] [Google Scholar]
- 20.Yaccoby S, Epstein J. The proliferative potential of myeloma plasma cells manifest in the SCID-Hu host. Blood. 1999;94:3576–3582. [PubMed] [Google Scholar]
- 21.Barlogie B. Advances in therapy of multiple myeloma: lessons from acute leukemia. Clin Cancer Res. 1997;3:2605–2613. [PubMed] [Google Scholar]
- 22.Shipman CM, Rogers MJ, Apperley JF, Russell RG, Croucher PI. Bisphosphonates induce apoptosis in human myeloma cell lines: a novel anti-tumour activity. Br J Haematol. 1997;98:665–672. doi: 10.1046/j.1365-2141.1997.2713086.x. [DOI] [PubMed] [Google Scholar]


