

Abstract
Purpose
People with macular degeneration (MD) often read slowly even with adequate magnification to compensate for acuity loss. Oculomotor deficits may affect reading in MD, but cannot fully explain the substantial reduction in reading speed. Central-field loss (CFL) is often a consequence of macular degeneration, necessitating the use of peripheral vision for reading. We hypothesized that slower temporal processing of visual patterns in peripheral vision is a factor contributing to slow reading performance in MD patients.
Methods
Fifteen subjects with MD, including 12 with CFL, and five age-matched control subjects were recruited. Maximum reading speed and critical print size were measured with RSVP (Rapid Serial Visual Presentation). Temporal processing speed was studied by measuring letter-recognition accuracy for strings of three randomly selected letters centered at fixation for a range of exposure times. Temporal threshold was defined as the exposure time yielding 80% recognition accuracy for the central letter.
Results
Temporal thresholds for the MD subjects ranged from 159 to 5881 ms, much longer than values for age-matched controls in central vision (13 ms, p<0.01). The mean temporal threshold for the 11 MD subjects who used eccentric fixation (1555.8 ± 1708.4 ms) was much longer than the mean temporal threshold (97.0 ms ± 34.2 ms, p<0.01) for the age-matched controls at 10° in the lower visual field. Individual temporal thresholds accounted for 30% of the variance in reading speed (p<0.05).
Conclusion
The significant association between increased temporal threshold for letter recognition and reduced reading speed is consistent with the hypothesis that slower visual processing of letter recognition is one of the factors limiting reading speed in MD subjects.
Keywords: macular degeneration, central-field loss, peripheral vision, reading speed, letter recognition, temporal processing
Introduction
Reading is one of the activities most adversely affected by central field loss (CFL). The leading cause of low vision in developed countries is age-related macular degeneration (AMD) which often results in loss of central vision. Currently, 1.75 million Americans have AMD and this number will reach nearly 3 million by the year 2020 (Friedman, O’Colmain, Munoz, Tomany, McCarty, de Jong, Nemesure, Mitchell & Kempen, 2004). Because of the significant increase in the prevalence of AMD and the importance of reading in daily life (Lindblad & Clemons, 2005), it is important to investigate the factors limiting reading performance in people with CFL. It is hoped that a better understanding of these factors will lead to improved methods for reading rehabilitation.
People with CFL use para-central retina rather than the non-functioning central retina for reading. In this paper, “peripheral retina” and “peripheral vision” refer to this paracentral region, consistent with the usage in related reading literature (e.g. Higgins et al. (1996), Latham & Whittaker (1996), Chung et al. 1998, Legge (2007)). Even when adequate magnification compensates for acuity loss in peripheral vision, people with CFL usually read more slowly than people with normal vision (NV) (Legge, Ross, Isenberg & LaMay, 1992; Legge, Rubin, Pelli & Schleske, 1985; Whittaker & Lovie-Kitchin, 1993). In this study, we focus on slow pattern processing as a possible factor limiting reading speed in people with CFL. We operationalize processing speed in terms of the time required for accurate letter recognition. Before discussing temporal processing, we briefly comment on impaired oculomotor control and shrinkage of the visual span as other factors potentially contributing to slow reading in the presence of CFL.
The use of peripheral vision as a consequence of a central scotoma increases the latency of saccades (White & Bedell, 1990; Whittaker, Cummings & Swieson, 1991), the frequency of undershoots of saccades (McMahon, Hansen & Viana, 1991), and the frequency of saccades (Rubin & Turano, 1994). Rapid serial visual presentation (RSVP) of text minimizes the need for eye movements by presenting words sequentially at the same location in the display, one word at a time for a fixed duration. RSVP would be expected to facilitate reading in CFL patients if oculomotor demands limit their reading performance. However, reading speeds of CFL patients increase only slightly (Rubin & Turano, 1994) or not at all (Bowers, Woods & Peli, 2004) with RSVP compared to conventional page reading. Although good oculomotor control is important in reading, these findings suggest that oculomotor deficits cannot fully account for the reading difficulties of CFL patients. As a consequence of poor oculomotor control in peripheral vision, fixation stability is significantly impaired (McMahon, Hansen & Viana, 1991). Decline in fixation stability has been shown to have a deleterious effect on reading speed in CFL patients (Crossland, Culham & Rubin, 2004; Whittaker, Budd & Cummings, 1988).
The visual span is the number of characters on a line of text that can be recognized reliably without moving the eyes (Legge, Ahn, Klitz & Luebker, 1997). Reduction of the size of the visual span is another possible explanation for slow reading performance in CFL patients. One method for measuring the visual span involves having subjects recognize strings of three horizontally arranged letters (trigrams) briefly presented at designated letter positions left and right of the midline. Visual span profiles are plots of letter-recognition accuracy as a function of letter position (Legge, Mansfield & Chung, 2001). Legge et al. 2001 found that visual-span profiles became smaller in normal peripheral vision, contracting from a width of about 10 letters in central vision to 1.71 letters at 15° in the lower visual field. Their findings are consistent with the idea that shrinkage in visual span size is a factor contributing to slower reading speed in normal peripheral vision. They suggested that reduction in visual span could be a major factor explaining the reading deficits of people with CFL.
We now turn to temporal processing. Factors limiting the time course of pattern processing in normal peripheral vision could be associated with different anatomical sites in the visual pathway. For example, processing speed could be limited by either early retino-cortical properties such as neural latency or by high-level aspects of visual pattern recognition (possibly in the extrastriate visual pathway), or even by non-visual linguistic processes. We believe the temporal differences studied in this paper are visual in nature, since there is evidence that non-visual linguistic processing is the same for stimuli presented to central and peripheral vision (Lee, Legge & Ortiz, 2003). Some measures of visual performance, presumed to depend on low-level visual mechanisms, imply faster processing in peripheral vision (Carrasco, McElree, Denisova & Giordano, 2003; Rovamo, Leinonen, Laurinen & Virsu, 1984; Tyler, 1985; Tyler, 1987). For example, Carrasco et al. 2003 reported faster temporal processing of Gabor patches at 9° than at 4° while Tyler et al. 1985; 1987 reported faster temporal processing of flickering targets in peripheral retina compared with fovea. Conversely, measures of letter, digit and word recognition performance, potentially limited by higher-level visual processes, imply slower processing in the peripheral visual field (Babkoff, Genser & Hegge, 1985; Seiple, Holopigian, Shnayder & Szlyk, 2001; Strasburger, Harvey & Rentschler, 1991; Williams & Lefton, 1982). Legge et al. 2001 compared visual-span profiles for different exposure durations at several eccentricities of NV subjects and found that profiles in peripheral vision required longer exposure times to reach their full size than in central visiona. This difference implies slower temporal processing of letter information in normal peripheral vision. In addition to slower letter recognition, Lee and colleagues (2003) reported that word recognition (lexical access) was also slower in peripheral vision than central vision, because of slower visual front-end temporal processing.
The foregoing evidence for slower word and letter recognition in normal peripheral vision provides a basis for hypothesizing that these factors could be a contributor to slow reading in patients with CFLb (Legge, Ahn, Klitz & Luebker, 1997); (Chung, Mansfield & Legge, 1998). It is also possible that retinal pathology associated with macular degeneration (MD) contributes to an additional degradation of the processing speed beyond the slow down observed in normal peripheral retina.
We measured letter recognition accuracy as a function of temporal duration for trigrams centered on the fixation point. For people with CFL, this fixation point is typically outside the central scotoma at a retinal location commonly termed the “preferred retinal locus” (PRL) (Timberlake, Mainster, Peli, Augliere, Essock & Arend, 1986). We measured the stimulus duration required to achieve 80% letter recognition and defined this as the temporal threshold. We used the temporal threshold as a measure of visual processing speed, in people with MD at their PRL and compared these thresholds to the corresponding thresholds of age-matched controls in central and peripheral vision. We considered two possibilities: 1) MD subjects might exhibit a slow-down in temporal processing roughly comparable to normal peripheral vision, or 2) they might show a more severe deficit in temporal processing associated with concomitant effects of their ocular pathology. We further asked whether changes in temporal thresholds were associated with reduced reading speeds.
Methods
Subjects
Fifteen subjects with mild to moderate forms of MD (mean age 75.8 ± 9.0 years) were recruited from the Visual Rehabilitation Center of the University of Minnesota and Vision Loss Resources (Minneapolis, MN). All MD subjects had functionally useful reading vision and acuity of 20/400 or better, but reported difficulties in reading. We excluded MD patients with more severe reading or acuity deficits in order 1) to study subjects who continue to read visually; 2) so that RSVP reading words, magnified to exceed the critical print size, would fit on the display screen; and 3) so that central scotomas would not extend far beyond 10° from the fovea. Thirteen subjects had a primary ocular diagnosis of AMD, and two had early-onset forms of macular degeneration (one had retinal cone dystrophy, and one had Doyne’s honeycomb retinal dystrophy). The latter two subjects exhibited no major differences from the AMD subjects and were retained in the MD group. An age-matched NV group of 5 subjects (mean age 74.8 ± 7.4 years), each with visual acuity of 20/25 or better and no reported eye disease was recruited. Vision measures for each subject are summarized in Table 1.
Table 1.
Subject characteristics
| Subjecta | Diagnosis | CFL* | Age | Distance VA (logMAR) | Log contrast sensitivity (log %) | Binocular scotoma (horizontal × vertical in degrees) | Binocular scotoma (quadrant) † | Estimated PRL (relative to scotoma) | Eccentricity of PRL |
|---|---|---|---|---|---|---|---|---|---|
| 1 | AMD | 1 | 74 | 0.44 | 1.25 | 6° × 4° | L,S,I (ring) | Central | 0° |
| 2 | AMD | 1 | 77 | 0.26 | 1.45 | 7° × 10° | L,I | Upper | 3° |
| 3 | AMD | 1 | 78 | 0.32 | 1.10 | 2.5° × 0.8 | L,I | Left | 5° |
| 4 | AMD | 1 | 79 | 0.88 | 1.40 | 15° × 25° | R,S,I | Left | ‡ |
| 5 | AMD | 1 | 79 | 0.70 | 0.85 | 18° × 16° | R,L,S,I | Right & Lower | 10° |
| 6 | AMD | 1 | 79 | 1.24 | 1.05 | 17° × 14° | R,L, I | Upper | 12° |
| 7 | AMD | 1 | 81 | 1.12 | 0.95 | 18° × 21° | R,L,S,I | Left | 10° |
| 8 | AMD | 1 | 81 | 0.24 | 1.10 | 15° × 9° | R,L,S,I | Lower | 10° |
| 9 | AMD | 1 | 85 | 1.00 | 1.40 | 18° × 15º | R,L,S | Left & Lower | 12° |
| 10 | AMD | 1 | 87 | 0.76 | 1.35 | 8.6° × 8° | R,S,I | Left | 5° |
| 11 | AMD | 0 | 65 | 0.12 | 1.90 | - | - | Central | 0° |
| 12 | AMD | 0 | 76 | 0.58 | 1.65 | - | - | Central | 0° |
| 13 | AMD | 0 | 81 | 0.20 | 1.30 | - | - | Central | 0° |
| 14 | JMD | 1 | 52 | 0.62 | 1.70 | 9° × 10° | R,L,S | Left & Lower | 5° |
| 16 | JMD | 1 | 65 | 0.60 | 1.55 | 11° × 9.6° | R,L,S,I | Lower | 10° |
| 17 | NV | - | 66 | −0.04 | 1.85 | - | - | - | - |
| 18 | NV | - | 68 | −0.10 | 2.00 | - | - | - | - |
| 19 | NV | - | 78 | −0.12 | 1.85 | - | - | - | - |
| 20 | NV | - | 81 | 0.02 | 1.95 | - | - | - | - |
| 21 | NV | - | 82 | 0.04 | 1.85 | - | - | - | - |
| Summary | MD | 15 | 75.8 ± 9.0 | 0.61 ± 0.35 | 1.33 ± 0.29 | 0.031 ± 0.03 | |||
| NV | 5 | 74.8 ± 7.4 | −0.04 ± 0.07 | 1.90 ± 0.07 | -- | ||||
AMD = Age-related macular degeneration JMD=Juvenile Macular degeneration NV = normal vision
1 = CFL (Central field loss), 0 = non-CFL (no central field loss)
Sub 15 participated in the first visit of the study but withdrew due to physical mobility problems. Since only basic clinical vision was measured for this subject, results were not reported in this manuscript.
Qualitative categorization of visual field loss: Right (R) bounded by 315° and 45°; Left (L) bounded by 135° and 225°; Superior (S) bounded by 45° and 135°; Inferior (I) bounded by 225° and 315°.
The extent of the PRL could not be estimated for Sub 4 because no physiological blind was mapped due to large right scotoma.
Subjects with self-reported physical limitations (e.g. orthopedic), poor general health, cognitive, or neurological problems were excluded. Each subject was screened with the Mini-Mental State Exam (MMSE) (Folstein, Folstein & McHugh, 1975). Only subjects with no cognitive impairment, those having a MMSE score of 25 or above were included (Launer, Dinkgreve, Jonker, Hooijer & Lindeboom, 1993). All subjects were native English speakers and gave signed informed consent to their participation. The study followed the tenets of the Declaration of Helsinki and was approved by the University of Minnesota Institutional Review Board.
Procedure
Vision assessments
Except as indicated below for the tangent field measurements, all vision testing was conducted binocularly. Distance visual acuity with habitual spectacle prescription was measured with a Lighthouse Distance Acuity Chart (Kitchin & Bailey, 1981) with background luminance of 120 cd/m2. Maximum reading speed and critical print size (CPS), the smallest print size yielding maximum reading speed, were measured with the MNREAD Acuity Chart (Mansfield, Ahn, Legge & Leubker, 1993) with background luminance of 95 cd/m2 and with appropriate refractive correction. The CPS estimated from the MNREAD Acuity Chart was used as a guide for the print sizes to be used in RSVP testing (see below). Letter contrast sensitivity was measured using the Pelli Robson Chart at 1 m, scored on a per letter basis (Elliott, Bullimore & Bailey, 1991; Pelli, Robson & Wilkins, 1988). Monocular (for left and right eyes) and binocular central visual fields were measured using a 5 mm white target on a Tangent screen at 1 m for the MD subjects fixating on a large letter E (20/150 or 20/300) with their PRL (Henson, 1993). This method for field measurement is recommended by Lovie-Kitchin and Whittaker (1998) for obtaining a rough estimate of the size and location of the scotoma relative to the PRL. Subjects were instructed and constantly reminded to use their habitual fixation (central or eccentric) steadily during the field measurement (Lovie-Kitchin & Whittaker, 1998). Binocular central visual field loss was quantified in degrees (in horizontal and vertical meridians) and steradians as the solid angle subtended by the scotoma (Lovie-Kitchin, Mainstone, Robinson & Brown, 1990; Weleber & Tobler, 1986), and categorized into four quadrants: superior, inferior, left and right, according to location relative to fixation. Although no physiological blind spot could be mapped during binocular viewing, we used the shift of the physiological blind spot identified in the better eye to estimate the PRL location. Kabanarou and Rubin (2006) reported that reading performance with binocular viewing is highly correlated with measures taken with the better eye.
Temporal thresholds
Visual processing speed was studied by measuring letter-recognition accuracy for trigrams (strings of three randomly selected letters) at fixation for a range of exposure times. Trigrams rather than words were used as stimuli, permitting the assessment of letter recognition in the presence of flanking stimuli, similar to reading, with minimal influence of lexical knowledge and oculomotor factors.
Letters were rendered in lower case Courier font and presented as black letters on a white background with contrast of 90% and background luminance of 90 cd/m2. Letter size was determined individually for the MD subjects as twice the CPSc from the RSVP reading assessment (see below). A letter size of 0.5° (0.78 logMAR) was used for NV subjects in central vision and 3.5° (1.62 logMAR) for NV subjects at 10° in the lower visual field. These print sizes were adopted because they were approximately twice the CPS in central and peripheral vision in NV subjects in previous studies (Cheung, 2005; Chung, Legge & Cheung, 2004). Standard letter spacing for the Courier font, in which center-to-center separation of adjacent letters was 1.16 times the width of the lowercase x, was used. At least 5 different exposure times were tested. Subjects with central scotomas were instructed to use their PRL and those without scotomas (including those with NV) used their central vision to fixate the mid point between two vertically displayed fixation dots (Figure 1).
Figure 1. Stimulus for measuring temporal thresholds for letter recognition.
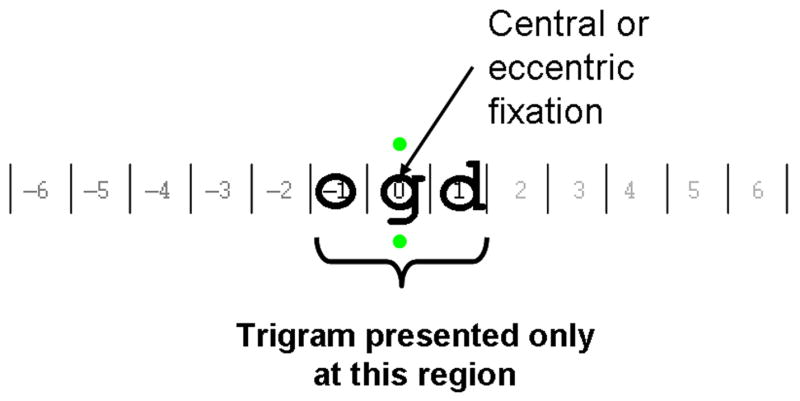
In a trial, a string of three randomly selected letters (trigrams) was displayed in a horizontal configuration for a designated exposure time. Subjects used either their preferred retinal locus (for those with scotomas) or central vision (for those without scotomas including normal vision subjects) to fixate at the mid point between the two vertically displayed green dots (shown as grey in this figure) and reported the 3 letters from left to right. A letter was counted as correct only if it was identified correctly in the correct order. Except where specified otherwise, data in this paper refer to recognition accuracy for the middle letter.
Fixation stability was monitored with a method similar to Seiple et al. 2001. We used a Logitech QuickCam® Pro 5000 (with high quality sensor to capture and record images of 640×480 pixels at a frame rate of 30 Hz). Measurement among NV subjects showed that saccades of 1°, 2° and 3° resulted in 0.30, 0.50 and 0.70 cm physical movement on the monitor respectively. A second experimenter could reliably detect 2° saccades, and less reliably 1° saccades. Trials were rejected when movement of the pupil’s image during a trial was observed (estimated accuracy of 2° or better). This sensitivity is sufficient to reject trials with eye movements made between letters (average character size of stimuli was 1.83 ± 1.4°) within a trial. In this study, the trial exclusion rate was 7.3% (range from 0 to 17.5% across MD subjects).
Subjects reported aloud all 3 letters of the trigram from left to right and the experimenter typed the letters into the computer. A letter was counted as correct only if it was identified correctly in the correct order. The accuracies for the three letter positions were separately scored. Psychometric functions with cumulative Gaussian fits (Wichmann & Hill, 2001a; Wichmann & Hill, 2001b) were constructed from plots of central letter-recognition accuracy as a function of exposure duration (refer to Figure 2). Temporal threshold was defined as the presentation duration yielding 80% correct for the central letter of the trigram derived from the cumulative Gaussian fit. Due to the refresh rate of the video display, the minimum exposure duration was 13 ms. Individual temporal thresholds were determined based on a total of 40 trials per duration.
Figure 2. Letter recognition accuracy as a function of exposure duration fitted by psychometric functions for MD subjects.

Letter recognition accuracy for the middle letter in trigrams as a function of exposure duration (log ms) is plotted for individual MD subjects. With the exception of Sub 11, psychometric functions were used to estimate the temporal threshold (represented by the vertical dash line) defined as the duration to achieve 0.8 proportion correct (represented by the horizontal dash line).
Reading assessment
RSVP reading speed was measured at 40 cm (or a fixed shorter distance when needed) with appropriate refractive correction. Individual words of a sentence were presented sequentially, left-justified at the same location on a monitor for fixed exposure durations. The RSVP sentences were prepared by Chung et al. 1998 and contained no punctuation other than a period. Each sentence was randomly selected from a pool of 2658 sentences with 8 to 14 words (mean of 11 ± 1.7 words) and a mean word length of 3.94 letters. Words were rendered in lower case Courier font and presented as black letters on a white background with contrast of 90% and background luminance of 100 cd/m2. Prior to each reading trial, a row of letters x’s was displayed at the testing location as a pre-mask and location cue. When the subjects pressed the button to initiate the test, individual words of the sentence were presented. After presenting the last word of the sentence, a row of x’s was displayed again as a post-mask. Subjects read the sentence aloud and the experimenter recorded the number of words read correctly. A word was scored as being read accurately when the subject said the correct word, irrespective of the order in the sentence. Psychometric functions of accuracy (percent of words read correctly) as a function of five RSVP exposure durations were plotted and fitted with the cumulative Gaussian function (Wichmann & Hill, 2001a; Wichmann & Hill, 2001b). The criterion exposure duration was defined as the RSVP exposure time yielding 80% of words identified correctly. Each psychometric function was based on data from 25 sentences and the criterion exposure duration was converted into reading speed in words per minute.
RSVP reading speed was measured for at least five print sizes, with the range determined by the MNREAD CPS. We used a multilevel non-linear mixed effects model (Cheung, Kallie, Legge & Cheong, 2007; Kallie, Cheung, Legge, Owsley & McGwin, 2005; Pinheiro & Bates, 2000) (NLME) to find exponential fits for reading speed vs. print size, and to estimate the reading parameters - CPS and maximum reading speed (Appendix). Examples of these fits are shown in Figure 3 (to be discussed in the Results section). Both maximum reading speed and CPS were estimated from the NLME model. CPS was defined as the smallest print size yielding 80% of the maximum reading speed.
Figure 3. Individual plots of RSVP reading Speed as a function of print size fitted by a non-linear mixed effects model (NLME) for MD subjects.

Plots of RSVP reading speed (open circles) versus print size are shown for MD subjects. The data are fitted by exponential functions (solid curves) using the non-linear mixed effects method. Critical print size (CPS), represented by a star is the print size yielding 80% of the maximum reading speed.
Data Analysis
SPSS (version 13), Matlab (version 7) including the psignifit toolbox (version 2.5.6) (Pelli, 1997) and R (version 2.1.0) were used in the data analyses. Temporal thresholds and maximum RSVP reading speeds were log-transformed so that their frequency distributions were not significantly different from normal distributions, confirmed by Kolmogorov-Smirnov Goodness of Fit test (p>0.05). Unpaired t-tests were performed to compare the temporal thresholds and reading speeds between the NV and MD groups. Parametric correlations for the MD subjects were performed to investigate the relationship between temporal threshold and reading and a probability of less than 0.05 was used to indicate statistical significance.
Results
Temporal thresholds in normal and low vision
NV subjects exceeded 80% correct letter recognition for targets in central vision at the shortest exposure time of 13 ms (one video frame at the 75 Hz frame rate). Accordingly, 13 ms represents an upper-bound on the temporal thresholds for the NV subjects. For testing at 10° in the lower visual field, the temporal thresholds of the NV subjects increased to 97.0 ± 34.2 ms (range from 60.4 to 129.9 ms).
Psychometric functions of letter accuracy as a function of exposure duration for the central letter position of trigrams are plotted for all MD subjects in Figure 2. With the exception of Sub 11, letter-recognition accuracy increased monotonically as duration increased, showing strong temporal dependence. As indicated in Figure 2, we defined temporal threshold as the duration at which the psychometric functions crossed 80% correct (shown by the vertical lines). Because Sub 11’s data points were all above 80%, a reliable threshold estimate was not available. Therefore this subject was excluded from subsequent analyses. The remaining 14 MD subjects had temporal thresholds of 159 to 5881 ms (mean of 1337.4 ± 1560.0 ms; median of 714.7 ms), which substantially exceeded the mean NV temporal thresholds of no more than 13 ms (central vision).
It would be informative to know how temporal thresholds for the left and right letters of trigrams compare with the temporal thresholds for the central letter. Two factors compromised our ability to estimate these thresholds. First, we selected the range of exposure durations to bracket 80% correct for the central letter, and this range of exposures was sometimes too long or too short for adequate psychometric functions for the left and right letters. Second, for some of our MD subjectsd, their PRL was adjacent to a scotoma so performance for either the left or right letter was too poor to estimate a temporal threshold. We were able to estimate temporal thresholds for both left and right letter positions for a subset of five of our MD subjects. For this subset, the temporal thresholds for the left, central and right letters were 410 ± 91 ms, 444 ± 22 ms, and 456 ± 106 ms respectively. The variation in temporal threshold across letter positions was not statistically significant (F2,12=0.53, p=0.60). In an additional analysis, we compared the overall mean percent correct for the left, center and right letters, across all exposure durations and all 14 MD subjects. Although a higher proportion correct was found for the left letter (0.74 ± 0.18) than the central (0.64 ± 0.10) and right letter (0.56 ± 0.27), the difference was not statistically significant (F2,39=2.97, p=0.07). These analyses did not reveal clear evidence for differences in temporal thresholds across letter position within the trigrams.
Eleven of our fourteen MD subjects used an eccentric PRL, which ranged from 3° to 12° away from the fovea (Table 1). Three others used central fixation; Sub 12 and Sub 13 did not have dense scotomas as measured with the tangent screen, and Sub 1 had a ring scotoma with intact central vision. Their temporal thresholds were 557, 505 and 548 ms respectively, much longer than the temporal thresholds in normal central vision (< 13 ms). The mean temporal threshold of the 11 MD subjects with eccentric PRLs (1555.8 ± 1708.4 ms) was much longer than the mean temporal threshold at 10° in the lower visual field of our five normal subjects (97.0 ms ± 34.2 ms, t=2.83, df=10, p=0.001, Table 2).
Table 2.
Summary data of reading parameters and temporal thresholds
| Subject | Diagnosis | Reading acuity (logMAR) | RSVP Critical print size (logMAR) | RSVP Maximum reading speed (log wpm) | RSVP exposure duration (ms) | Temporal threshold (ms)* |
|---|---|---|---|---|---|---|
| 1 | AMD | 0.28 | 0.73 | 1.71 | 1170.0 | 548.0 |
| 2 | AMD | 0.42 | 0.73 | 2.30 | 303.2 | 231.8 |
| 3 | AMD | 0.38 | 0.70 | 2.09 | 484.2 | 815.1 |
| 4 | AMD | 1.12 | 1.60 | 1.86 | 834.0 | 2418.3 |
| 5 | AMD | 1.06 | 2.21 | 1.75 | 1056.2 | 1814.5 |
| 6 | AMD | 1.22 | 1.73 | 1.74 | 1092.4 | 5881.3 |
| 7 | AMD | 1.41 | 1.77 | 1.92 | 725.8 | 3056.3 |
| 8 | AMD | 0.38 | 0.82 | 2.26 | 331.9 | 689.2 |
| 9 | AMD | 1.04 | 1.50 | 2.34 | 276.9 | 409.5 |
| 10 | AMD | 0.92 | 1.16 | 1.75 | 1073.7 | 898.5 |
| 11 | AMD | 0.10 | 0.22 | 2.46 | 205.8 | - |
| 12 | AMD | 0.63 | 0.87 | 1.90 | 754.1 | 556.9 |
| 13 | AMD | 0.30 | 0.50 | 2.44 | 218.2 | 504.8 |
| 14 | JMD | 0.62 | 1.07 | 2.09 | 493.3 | 159.0 |
| 16 | JMD | 0.83 | 1.11 | 2.41 | 232.1 | 740.2 |
| 17 | NV | 0.01 | 0.26 | 2.65 | 134.7 | 13.0 †
60.4‡ |
| 18 | NV | −0.08 | 0.08 | 2.52 | 180.5 | 13.0 †
129.9‡ |
| 19 | NV | −0.13 | 0.11 | 2.45 | 212.5 | 13.0 †
122.2‡ |
| 20 | NV | 0.06 | 0.26 | 2.52 | 180.9 | 13.0 †
75.5‡ |
| 21 | NV | −0.05 | 0.21 | 2.57 | 159.7 | 13.0 † |
| Summary | MD | 0.71 ± 0.11 | 1.14 ± 0.55 | 2.04 ± 0.27 | 637.1 ± 360.1 | 1337.4 ±1560.0 |
| NV | −0.04 ± 0.07 | 0.18 ± 0.08 | 2.54 ± 0.07 | 173.7 ± 28.8 | 13.0 †
97.0 ± 34.2‡ |
AMD = Age-related macular degeneration, JMD = Juvenile Macular degeneration, NV = normal vision, MD = Macular degeneration
Central-letter recognition accuracy as a function of exposure duration was fitted by cumulative Gaussian psychometric function. Temporal threshold was determined as the threshold duration where 80% accuracy of central-letter recognition was achieved.
The temporal threshold could not be determined for normal vision subjects in central vision because of the limitation of the refresh rate of CRT monitor (76 Hz). The minimum duration for each presentation was 13 ms (= 1 frame) in which the normal vision subjects could already achieve at least 80% accuracy.
The peripheral temporal threshold at 10° inferior field was measured for four of the five normal vision subjects because Sub 21 was not willing to attend an extra visit.
The longer temporal thresholds among the MD subjects was strongly correlated with vision loss reflected by distance visual acuity (r=0.65, p=0.01), contrast sensitivity (r=−0.67, p=0.009) and reading acuity (r=0.70, p=0.005). Consistent with the distribution of PRL locations previously reported (Fletcher & Schuchard, 1997; Schuchard, Naseer & de Castro, 1999), nine of the 11 MD subjects with eccentric fixation adopted PRLs below and/or to the left of their scotomas in the visual field (Table 1). The temporal threshold in MD was strongly correlated with scotoma size (in steradians) (r=0.80, p=0.001), and marginally correlated with the coarsely estimated eccentricity of the PRL (r=0.55, p=0.05).
Relationship between temporal threshold and reading speed in MD
Figure 3 shows plots of RSVP reading speed as a function of print size for the MD subjects with solid curves showing the NLME fits to the data. The corresponding reading parameters derived from the curves are summarized in Table 2. As expected, the age-matched control group with mean maximum reading speed of 353.6 ± 61.1 wpm (2.54 ± 0.07 log wpm) read significantly faster than the MD group with 130.5 ± 80.0 wpm (2.04 ± 0.27 log wpm, t=3.68, df=18, p=0.002).
We used nonparametric statistical methods – bootstrap (Efron, 1979; Efron, 1981) with 10,000 resamplings and the randomized permutation test (Fisher, 1935) with 10,000 permutations -- to examine the relationship between reading speed and temporal thresholds without the need to make normality assumptions. Log reading speed was significantly and negatively correlated with log temporal thresholds (r=−0.55, pbootstrap<0.05 [or 95% BCa confidence interval = (−0.78, −0.18)], Figure 4A), indicating that the MD subjects with faster processing speed (shorter temporal thresholds) read faster. Individual temporal thresholds explained 30% of the variance of the maximum reading speed in MD subjects. As an additional check, we divided the subjects into fast (N = 7) and slow (N = 7) readers using 2.0 log wpm as the dividing point. Although the correlations between log reading speed and log temporal threshold were not statistically significant within these subgroups, we found that fast MD readers had significantly shorter temporal thresholds than slow readers (observed difference=0.55 log ms, pperm=0.008). There was an outlier (Sub 1) in Figure 4A, who required much shorter exposure time for letter recognition (548 ms) than for RSVP reading (1170 ms per word). This subject was unusual in having a large ring scotoma with a central island of only 3–4 letter widths at her CPS. When we excluded this outlier from the regression model, 40% of the variance in RSVP reading speed was explained by the temporal threshold (r=−0.63, pbootstrap<0.05 [or 95% BCa confidence interval = (−0.84, −0.26)]).
Figure 4. A. RSVP reading speed versus Letter-recognition temporal threshold for 14 MD subjects.
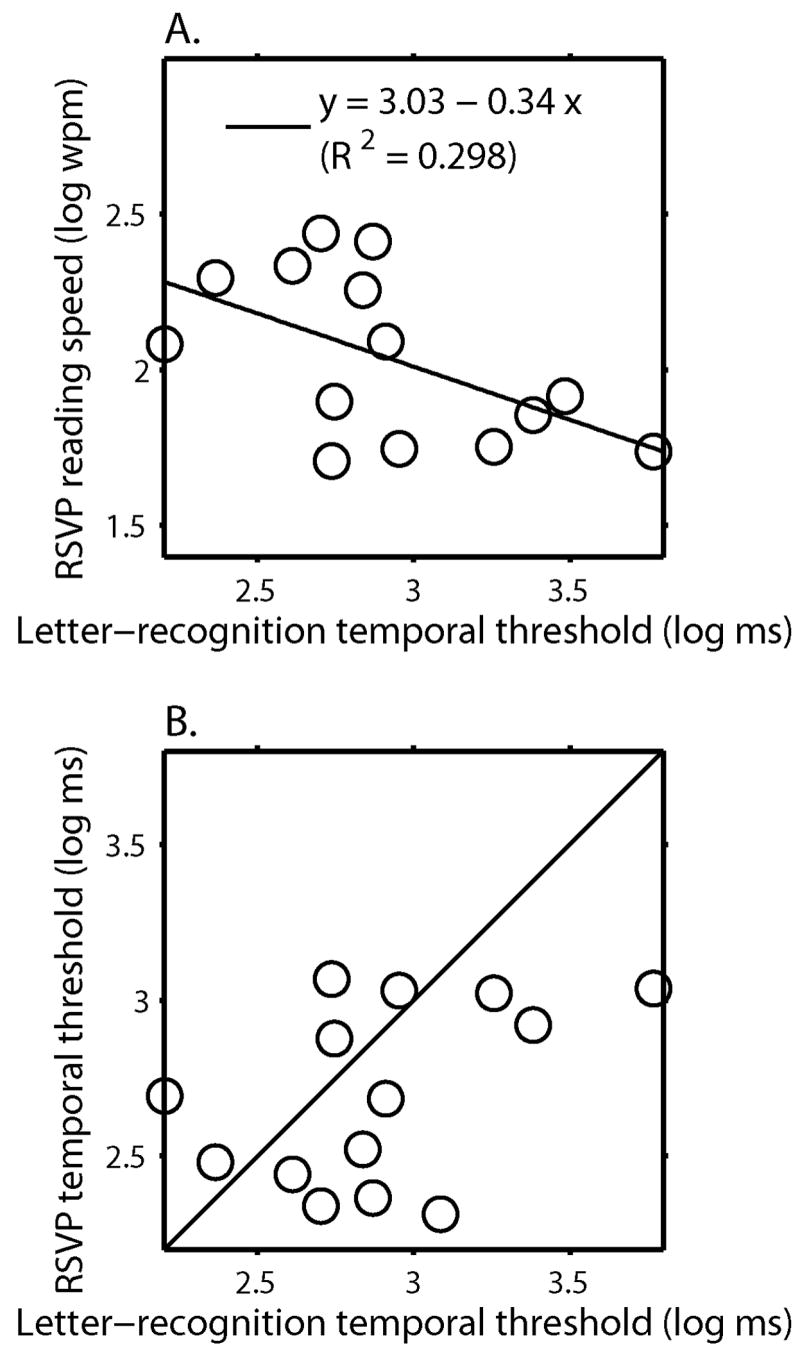
Log RSVP maximum reading speed was plotted as a function of log threshold duration for letter recognition. The dark line represents the least-squares regression line.
B. RSVP word-exposure time versus Letter-recognition temporal threshold for 14 MD subjects Log word exposure time associated with RSVP maximum reading speed was plotted as a function of log threshold duration for letter recognition. The solid line is the equality line showing what would be expected if temporal thresholds for letter recognition are equal to RSVP word-recognition times. The temporal thresholds for letter recognition average 17% longer than the word-recognition times.
Criterion effect
Since temporal thresholds and reading speeds were defined as the points corresponding to 80%-correct on the psychometric functions, our results might depend on the choice of criterion. Previously, Chung et al. (1998), using a very similar method to measure RSVP reading speeds, showed that the major characteristics of reading speed-vs-print size curves in central and peripheral vision were not affected by the choice of criterion level. We reanalyzed our data using criteria of 50%, 60%, 70%, and 90%-correct for both the temporal thresholds for letter recognition and proportion correct defining RSVP reading speed. Regardless of the criterion used, the major qualitative findings remained the same, i.e. temporal thresholds required by the MD subjects were much longer than those required by the NV subjects in central and peripheral vision, and the MD reading speeds were substantially slower than the reading speeds in normal vision. The correlation between temporal threshold and reading speed decreased for lower criterion levels, possibly because the data values were noisier on the lower limbs of the psychometric functions. We adopted 80% as the criterion level for our analyses because 1) this value represents a compromise between the use of an unduly low performance level and a higher performance level limited by ceiling effects; and 2) this criterion is the level used in several previous studies of RSVP reading speed (e.g., Chung et al. (1998); Chung (2002); Legge et al. 2001), facilitating comparisons across studies.
Discussion
Why Is Pattern Processing Slower in MD Vision?
It is well known that processing speed of letter recognition measured by either letter identification accuracy with varied exposure durations (Fine, 2004), or reaction time (Babkoff, Genser & Hegge, 1985; Williams & Lefton, 1982) in normal peripheral vision is significantly slower than central vision. Our findings confirm these prior observations by showing that letter recognition in the trigram task is substantially slower in normal peripheral vision (10° inferior field) than in central vision.
We make three comparisons between the MD temporal thresholds and the temporal thresholds of our NV subjects. First, our small group of three MD subjects with central fixation had much longer temporal thresholds (mean = 537 ms) than the normal temporal thresholds in central vision (< 13 ms). Second, the group of 11 MD subjects with eccentric fixation had much longer temporal thresholds (mean = 1556 ms) than the temporal thresholds in normal central vision. This is not surprising because these 11 subjects used their peripheral vision (ranging from approximately 3° to 12° from the fovea) for letter recognition, and normal peripheral vision at 10° eccentricity has longer temporal thresholds than normal central vision. Third, the temporal thresholds for the 11 MD subjects with eccentric fixation were much longer than the normal temporal thresholds at 10°. In short, the normal decline in temporal processing speed from foveal vision to 10° peripheral vision vastly underestimates the long temporal thresholds for letter recognition exhibited by our MD subjects.
It is possible that the MD subjects used different PRLs in the tangent-screen test of visual fields, and in the temporal threshold and reading tests. If the PRL used in the letter recognition and reading tests were far into peripheral vision, longer temporal thresholds might be due to the greater eccentricity. We think this is highly unlikely because previous research has shown that PRLs are almost invariably found near the boundaries of scotomas (for a review, see Cheung and Legge (2005)), and the scotomas of our MD subjects rarely exceeded 10° eccentricity. Moreover, the proportion of MD subjects who make use of multiple scotomas is thought to be low ( ~ 15%) (Deruaz, Whatham, Mermoud & Safran, 2002; Guez, Le Gargasson, Rigaudiere & O’Regan, 1993; Lei & Schuchard, 1997; Sunness, Applegate, Haselwood & Rubin, 1996).
Our finding that the MD temporal thresholds were much longer than the NV thresholds at both central and peripheral locations implies that some additional mechanisms such as concomitant retinal pathology, fixation instability or crowding, must be invoked to explain slower temporal processing in the MD subjects. We will now briefly review each of these possibilities.
Retinal pathology associated with MD in the PRL may contribute to an additional loss of processing speed. Curcio and colleagues (2000) reported that the deterioration of rod function in peripheral retina among people with age-related MD was significantly greater than for age-matched normally sighted people. Despite remaining central visual function in early stages of MD, cone-adaptational kinetics is impaired (Phipps, Guymer & Vingrys, 2003) with significant reductions in photopic and scotopic light sensitivity (Owsley, Jackson, Cideciyan, Huang, Fine, Ho & et al, 2000; Scholl, Bellmann, Dandekar, Bird & Fitzke, 2004). Such concomitant deterioration of the retina might result in sparser or distorted sampling of letters in the retinal image. Recent work on simulated retinal implants (Sommerhalder, Oueghlani, Bagnoud, Leonards, Safran & Pelizzone, 2003) and the earlier work of Legge et al. 1985 on matrix sampling of text both reveal that sparse sampling of text below a critical sampling density can result in a slow-down in reading.
It has been observed that fixation stability for MD patients is significantly impaired (Crossland, Culham & Rubin, 2004; Culham, Fitzke, Timberlake & Marshall, 1993; Schuchard & Fletcher, 1994). The impaired fixation stability, measured in terms of the size of bivariate contour ellipses representing the spatial distribution of fixations, was significantly correlated with reading speed (Crossland, Culham & Rubin, 2004), i.e., the poorer the fixation stability, the slower the reading. The relationship between fixation stability and reading was supported by a recent study (Falkenberg, Rubin & Bex, 2007) examining reading speed in the presence of spatially jittered text in normal peripheral retina to simulate the fixation instability in MD patients. The correlation between either stimulus jitter or fixation instability and reading speed raises the possibility that the long temporal thresholds for letter recognition required by our MD subjects might be related to their poor fixation stability. However, Falkenberg et al. 2007 showed that measures of peripheral letter acuity and crowding, unlike reading speed, were not affected by stimulus jitter. It remains possible that temporal thresholds for letter recognition in peripheral vision might be prolonged by stimulus jitter, even if acuity thresholds are not affected.
We also note that, Whittaker et al. 1988 have challenged the idea that fixational jitter in MD subjects has functional consequences for reading. They argued that the characteristics of fixation instability measured in their MD subjects were unlikely to have major functional impact. Déruaz et al. 2004 argued that fixation instability at the PRL actually provides functional benefit in overcoming the perceptual fading of peripheral targets during stable fixation. However, their result was based on normally sighted subjects rather than MD patients. These conflicting findings indicate that the impact of fixation instability on MD reading and letter recognition remains an open question.
Crowding is well known to influence letter recognition in peripheral vision (Bouma, 1970; Jacobs, 1979; Latham & Whitaker, 1996; Strasburger, Harvey & Rentschler, 1991). To the extent that crowding was a factor in our trigram letter-recognition task, which we doubt (see the next paragraph), prolonged stimulus exposures might have played a role in reducing the effect of crowding. Fine (2004) examined the relation between inter-letter spacing and stimulus exposure duration on letter recognition in normal peripheral vision (10° right or left of the fovea). Her results showed that the impact of crowding on letter recognition in peripheral vision decreased with longer stimulus exposure. It is therefore plausible that slower processing in peripheral vision could be associated with a release from crowding, but it is not clear how this could account for the difference in temporal thresholds between normal peripheral vision and the much longer thresholds in our MD subjects.
We doubt that crowding had much effect on our MD temporal thresholds. As reported in the Results, we did not find evidence that temporal processing of the central letter of trigrams was substantially slower or less reliable than the left and right flanking letters. The absence of crowding is probably explained by the choice of character size. We scaled character size to be twice the critical print size. Pelli et al. 2007 have recently argued persuasively, on both theoretical and empirical grounds, that critical print size for reading is determined by the center-to-center letter spacing for crowding; for letters larger than the critical print size, the spacing between adjacent letters exceeds the spacing for which crowding occurs. According to Pelli et al.’s analysis, it is the spacing between letters that is critical to determining whether crowding occurs, and not the size of the letters. For our trigram stimuli, the scaling of character size ensured that letter spacing exceeded the stimulus spacing for crowding. The Pelli et al.’s analysis was for normal peripheral vision, rather than for macular degeneration. But, as indicated above, our empirical results imply that crowding was not a major factor influencing letter recognition in the trigram task for our MD subjects.
We conclude that the abnormally long temporal thresholds for letter recognition in MD are probably not due to crowding. It remains unclear whether these deficits are due to distortions of image sampling related to concomitant pathology in peripheral retina, to fixation instability, or a combination of the two.
How are Temporal Thresholds for Letter Recognition Related to Reading Speed?
A possible explanation for the correlation between temporal thresholds and reading speed is that the threshold exposure time for letter recognition is a limiting factor that directly determines the threshold exposure time for RSVP reading speed. In the simplest case, we would expect to find quantitative agreement between the temporal thresholds for letter recognition and the word-exposure times determining RSVP reading speeds. Supporting this view, the two temporal measures did not show a statistically significant difference across our 14 MD subjects (pperm=0.09). However, the lack of statistical significance is only weak evidence for equivalence because of the small sample size and variability in the data. To further explore this issue, Figure 4B replots the data of Figure 4A as a scatter plot of word exposure times in RSVP reading and temporal thresholds. If there is equality between these 2 temporal measures, we would expect to find the data points to lie along the equality line. Figure 4B shows that most of the data points lie near or below the equality line, indicating that the temporal thresholds for letter recognition are longer than the word-exposure times for the majority of the MD subjects. The difference averaged 17%, and indicates that factors in addition to the temporal threshold for letter recognition influence RSVP reading speed in many of our MD readers. We briefly consider two factors that could account for the slightly faster RSVP reading speed than would be predicted from our temporal thresholds for letter recognition.
First, the visibility of a target letter within a string of characters depends on both the letter position within the string and the location of fixation within the string. Stevens and Grainger (2003) have reviewed prior findings and presented parametric data on the visibility of letters in 5- and 7-character strings. They found that, combining across fixation positions, initial and final letters are recognized more accurately than interior letters for a given exposure time. But the details of the profile of letter-recognition accuracy depend on the point of fixation. For instance, for fixation on the central letter in a 7-character string, recognition accuracy is higher for the fixated letter and the initial and final letters and lower for letter positions 2, 3, 5 and 6 (a W-shaped profile of accuracy vs. letter position). Given this pattern, the first, fourth and seventh letters would be expected to reach temporal threshold first producing a pattern such as m - - e - - l. A puzzle solver might recognize that the only possible English word is mineral, but in RSVP reading it is likely that recognition would be limited by the extra tens of milliseconds required for the letters in positions, 2, 3, 5 and 6 to reach their longer temporal thresholds. On the other hand, for fixation on the leading letter of a 7-character string, accuracy is highest for the leading letter, with a gradient of decreasing accuracy for later letters in the string, with an upturn in accuracy for the final letter. These findings make clear that not all letters in longer words are recognized with equal accuracy or equal speed. The point here is that a single temporal threshold measurement for the central letter of a trigram will not capture the detailed temporal dependencies of letter recognition across words of different lengths under different fixation conditions.
Second, it is known that the use of sentence context, and/or lexical inference enhances reading speed in both normal and low vision (Chung, Mansfield & Legge, 1998; Sass, Legge & Lee, 2006). Sass et al. 2006 measured context effects in subjects with low vision. They reported that reading speeds for continuous text were approximately 50% faster than for “sentences” with scrambled word order. In our present study, context probably facilitated reading speed for our MD subjects and contributed to the faster recognition times for words compared with letters in Fig. 4B.
While the foregoing paragraphs make clear that factors other than the temporal threshold for a fixated letter in a trigram influence reading speed, we believe that such temporal thresholds provide a marker for pattern processing speed that is closely linked to reading speed. The significant correlation between temporal thresholds and reading speeds in our MD subjects, and the near match between their threshold times for letter recognition and word-exposure times for RSVP reading, support this view.
Clinical Implications of Slow Temporal Processing in Low Vision
Our results show that the MD subjects required much longer exposure duration for accurate letter recognition. This being the case, we might expect to observe extra-long fixations in MD reading. However, eye movement studies reveal that people with MD do not increase fixation duration in reading (Bullimore & Bailey, 1995; Crossland & Rubin, 2006). Instead they reduce the size of forward saccades (Bullimore & Bailey, 1995; Rumney & Leat, 1994), make more fixations (Rubin & Turano, 1994) and more regressive saccades (Bullimore & Bailey, 1995; Rumney & Leat, 1994) during reading. Paradoxically, our evidence for elevated temporal thresholds in MD implies that lengthening fixations might actually result in more accurate word recognition and ultimately faster reading. It raises an interesting possibility: would MD subjects improve their reading performance if they were trained to use longer fixations?
Conclusions
People with MD have substantially slower pattern processing speed and require longer exposure durations to recognize letters and words. The slower processing is more pronounced than would be expected from the slower processing of letters in normal peripheral vision. These findings are consistent with the hypothesis that slower visual processing of letter recognition is one of the factors limiting reading speed in MD subjects. Additional factors limiting MD reading speed may include deficits in peripheral retinal function outside the central scotoma, and fixation instability.
In a forthcoming manuscript, we will explore the influence of spatial factors on MD reading speed by analyzing the size and shape of visual-span profiles in subjects with MD (Cheong, Legge, Lawrence, Cheung & Ruff, 2007). We will consider the joint effects on MD reading speed of slower pattern processing and reduced visual span in peripheral vision.
Acknowledgments
This research was supported by NIH Grant EY 02934 to Gordon E. Legge. We thank Ms Julie Anderson and Ms Dodie Kostishack from Vision Loss Resources for assistance in subject recruitment. We thank Dr Michael Crossland for comments on a draft of this article.
Appendix
Non-linear mixed effects (NLME) model
The NLME model provides a flexible statistical tool for analyzing balanced and unbalanced data within the same group rather than fitting the data individually. Thus curve fitting of noisy individual data in which it is difficult to identify the CPS is still possible (e.g. Sub 9 and 14 in Figure 3). Detailed procedures for NLME modeling to analyze the reading speed vs print size have been described in Cheung et al. 2007. In brief, reading speed as a function of print size was modeled in a log-log scale in the NLME model. An exponential fit was used:
where × is print size in logMAR, β1 was the asymptotic reading speed in log wpm, β2 was the rate of change in reading speed over print size and β3 was the x-intercept when reading speed was 0 log wpm (i.e. 1 wpm).
Footnotes
Exposure durations of approximately 50 ms and 125 ms were required to achieve the full size of visual spans at central and 20° inferior visual field respectively.
Legge et al. 1997 used the term “prolonged viewing” to refer to the extra time possibly required by peripheral vision to achieve letter or word recognition.
Reading speed for Sub 1 was compromised at small and large character sizes due to a ring scotoma. The print size which yielded the fastest reading speed in RSVP was adopted as the letter size for the temporal threshold measurement.
Letter-recognition performance for some MD subjects in particular those with large scotomas was compromised at the left and/or right letters (e.g. Sub 5 had a left scotoma and Sub 6 had right and left scotomas in relation to the PRL). Therefore, data points were all below 80% accuracy for all exposure durations. Conversely, performance for some MD subjects was above 80% accuracy because the selected range of exposure durations was based on the letter-recognition accuracy for central letter (e.g. Sub 2 & 16). In either case, reasonable estimates of temporal thresholds from psychometric function were not possible.
Publisher's Disclaimer: This is a PDF file of an unedited manuscript that has been accepted for publication. As a service to our customers we are providing this early version of the manuscript. The manuscript will undergo copyediting, typesetting, and review of the resulting proof before it is published in its final citable form. Please note that during the production process errors may be discovered which could affect the content, and all legal disclaimers that apply to the journal pertain.
References
- Babkoff H, Genser S, Hegge FW. Lexical decision, parafoveal eccentricity and visual hemifield. Cortex. 1985;21(4):581–593. doi: 10.1016/s0010-9452(58)80006-4. [DOI] [PubMed] [Google Scholar]
- Bouma H. Interaction effects in parafoveal letter recognition. Nature. 1970;226(5241):177–178. doi: 10.1038/226177a0. [DOI] [PubMed] [Google Scholar]
- Bowers AR, Woods RL, Peli E. Preferred retinal locus and reading rate with four dynamic text presentation formats. Optometry and Vision Science. 2004;81(3):205–213. doi: 10.1097/00006324-200403000-00013. [DOI] [PubMed] [Google Scholar]
- Bullimore MA, Bailey IL. Reading and eye movements in age-related maculopathy. Optometry and Vision Science. 1995;72(2):125–138. doi: 10.1097/00006324-199502000-00011. [DOI] [PubMed] [Google Scholar]
- Carrasco M, McElree B, Denisova K, Giordano AM. Speed of visual processing increases with eccentricity. Nature Neuroscience. 2003;6(7):699–670. doi: 10.1038/nn1079. [DOI] [PMC free article] [PubMed] [Google Scholar]
- Cheong AMY, Legge GE, Lawrence MG, Cheung SH, Ruff M. Relationship between visual span and reading performance in Age-Related Macular Degeneration. Vision Research, In Revision. 2007 doi: 10.1016/j.visres.2007.11.022. [DOI] [PMC free article] [PubMed] [Google Scholar]
- Cheung SH. Plasticity of the visual system following visual impairment (Unpublished PhD Thesis) University of Minnesota; Minneapolis: 2005. [Google Scholar]
- Cheung SH, Kallie CS, Legge G, Cheong AMY. Nonlinear mixed-effects modeling of MNREAD data. Investigative Ophthalmology & Visual Science, In Revision. 2007 doi: 10.1167/iovs.07-0555. [DOI] [PubMed] [Google Scholar]
- Chung ST. The effect of letter spacing on reading speed in central and peripheral vision. Investigative Ophthalmology & Visual Science. 2002;43(4):1270–1276. [PubMed] [Google Scholar]
- Chung ST, Legge GE, Cheung SH. Letter-recognition and reading speed in peripheral vision benefit from perceptual learning. Vision Research. 2004;44(7):695–709. doi: 10.1016/j.visres.2003.09.028. [DOI] [PMC free article] [PubMed] [Google Scholar]
- Chung ST, Mansfield JS, Legge GE. Psychophysics of reading - XVIII. The effect of print size on reading speed in normal peripheral vision. Vision Research. 1998;38(19):2949–2962. doi: 10.1016/s0042-6989(98)00072-8. [DOI] [PubMed] [Google Scholar]
- Crossland MD, Culham LE, Rubin GS. Fixation stability and reading speed in patients with newly developed macular disease. Ophthalmic and Physiological Optics. 2004;24(4):327–333. doi: 10.1111/j.1475-1313.2004.00213.x. [DOI] [PubMed] [Google Scholar]
- Crossland MD, Rubin GS. Eye movements and reading in macular disease: Further support for the shrinking perceptual span hypothesis. Vision Research. 2006;46(4):590–597. doi: 10.1016/j.visres.2005.05.015. [DOI] [PubMed] [Google Scholar]
- Culham LE, Fitzke FW, Timberlake GT, Marshall J. Assessment of fixation stability in normal subjects and patients using a scanning laser ophthalmoscope. Clinical Vision Science. 1993;8:551–561. [Google Scholar]
- Curcio CA, Owsley C, Jackson GR. Spare the rods, save the cones in aging and age-related maculopathy. Investigative Ophthalmology and Visual Science. 2000;41(8):2015–2018. [PubMed] [Google Scholar]
- Deruaz A, Matter M, Whatham AR, Goldschmidt M, Duret F, Issenhuth M, Safran AB. Can fixation instability improve text perception during eccentric fixation in patients with central scotomas? British Journal of Ophthalmology. 2004;88(4):461–463. doi: 10.1136/bjo.2003.025601. [DOI] [PMC free article] [PubMed] [Google Scholar]
- Deruaz A, Whatham AR, Mermoud C, Safran AB. Reading with multiple preferred retinal loci: implications for training a more efficient reading strategy. Vision Research. 2002;42:2947–2957. doi: 10.1016/s0042-6989(02)00354-1. [DOI] [PubMed] [Google Scholar]
- Efron B. Bootstrap methods: Another look at the jackknife. Annals of Statistics. 1979;7:1–26. [Google Scholar]
- Efron B. Nonparametric estimates of standard error: The jackknife, the bootstrap and other methods. Biometrika. 1981;68:589–599. [Google Scholar]
- Elliott DB, Bullimore MA, Bailey IL. Improving the reliability of the Pelli-Robson contrast sensitivity test. Clinical Vision Science. 1991;6(6):471–475. [Google Scholar]
- Falkenberg HK, Rubin GS, Bex PJ. Acuity, crowding, reading and fixation stability. Vision Research. 2007;47(1):126–135. doi: 10.1016/j.visres.2006.09.014. [DOI] [PubMed] [Google Scholar]
- Fine EM. The relative benefit of word context is a constant proportion of letter identification time. Perception and Psychophysics. 2004;66(6):897–907. doi: 10.3758/bf03194983. [DOI] [PubMed] [Google Scholar]
- Fisher RA. The Design of Experiment. New York: Hafner; 1935. [Google Scholar]
- Fletcher DC, Schuchard RA. Preferred retinal loci relationship to macular scotomas in a low-vision population. Ophthalmology. 1997;104(4):632–638. doi: 10.1016/s0161-6420(97)30260-7. [DOI] [PubMed] [Google Scholar]
- Folstein M, Folstein S, McHugh P. Mini-Mental State: A practical method for grading the state of patients for the clinician. Journal of Psychiatric Research. 1975;12:189–198. doi: 10.1016/0022-3956(75)90026-6. [DOI] [PubMed] [Google Scholar]
- Friedman DS, O’Colmain BJ, Munoz B, Tomany SC, McCarty C, de Jong PT, Nemesure B, Mitchell P, Kempen J. Prevalence of age-related macular degeneration in the United States. Archives of Ophthalmology. 2004;122(4):564–572. doi: 10.1001/archopht.122.4.564. [DOI] [PubMed] [Google Scholar]
- Guez J, Le Gargasson J, Rigaudiere R, O’Regan JK. Is there any systematic location for the pseudo-fovea in patients with central scotoma? Vision Research. 1993;33(9):1271–1279. doi: 10.1016/0042-6989(93)90213-g. [DOI] [PubMed] [Google Scholar]
- Henson DB. Visual Fields. New York: Oxford University Press; 1993. [Google Scholar]
- Higgins KE, Arditi A, Knoblauch K. Detection and identification of mirror-image letter pairs in central and peripheral vision. Vision Research. 1996;36(2):331–337. doi: 10.1016/0042-6989(95)00117-i. [DOI] [PubMed] [Google Scholar]
- Jacobs RJ. Visual resolution and contour interaction in the fovea and periphery. Vision Research. 1979;19(11):1187–1195. doi: 10.1016/0042-6989(79)90183-4. [DOI] [PubMed] [Google Scholar]
- Kabanarou SA, Rubin GS. Reading with central scotomas: is there a binocular gain? Optometry & Vision Science. 2006;83(11):789–796. doi: 10.1097/01.opx.0000238642.65218.64. [DOI] [PubMed] [Google Scholar]
- Kallie CS, Cheung SH, Legge GE, Owsley C, McGwin G., Jr Nonlinear Mixed Effects Modeling as an Estimation Procedure for Sparse MNREAD Data. Investigative Ophthalmology & Visual Science, ARVO E-Abstract. 2005:4589. doi: 10.1167/iovs.07-0555. [DOI] [PubMed] [Google Scholar]
- Kitchin JE, Bailey I. Task complexity and visual acuity in senile macular degeneration. Australian Journal of Optometry. 1981;64(6):235–242. [Google Scholar]
- Latham K, Whitaker D. A comparison of word recognition and reading performance in foveal and peripheral vision. Vision Research. 1996;36:2665–2674. doi: 10.1016/0042-6989(96)00022-3. [DOI] [PubMed] [Google Scholar]
- Launer LJ, Dinkgreve MA, Jonker C, Hooijer C, Lindeboom J. Are age and education independent correlates of the Mini-Mental State Exam performance of community-dwelling elderly? Journal of Gerontology. 1993;48(6):P271–277. doi: 10.1093/geronj/48.6.p271. [DOI] [PubMed] [Google Scholar]
- Lee HW, Legge GE, Ortiz A. Is word recognition different in central and peripheral vision? Vision Research. 2003;43(26):2837–2846. doi: 10.1016/s0042-6989(03)00479-6. [DOI] [PubMed] [Google Scholar]
- Legge G, Cheung SH, Chung STL, Lee HW, Gefroh J, Kwon M. Training peripheral vision to reading. In: Rieser JJ, Ashmead DH, Ebner FF, Corn AL, editors. Blindness and brain plasticity in navigation and object perception. Mahwah, NJ: Lawrence Erlbaum Associates; 2007. In Press. [Google Scholar]
- Legge GE, Ahn SJ, Klitz TS, Luebker A. Psychophysics of reading - XVI. The visual span in normal and low vision. Vision Research. 1997;37(14):1999–2010. doi: 10.1016/s0042-6989(97)00017-5. [DOI] [PubMed] [Google Scholar]
- Legge GE, Mansfield JS, Chung STL. Psychophysics of reading - XX. Linking letter recognition to reading speed in central and peripheral vision. Vision Research. 2001;41(6):725–743. doi: 10.1016/s0042-6989(00)00295-9. [DOI] [PubMed] [Google Scholar]
- Legge GE, Pelli DG, Rubin GS, Schleske MM. Psychophysics of reading - I. Normal vision. Vision Research. 1985;25(2):239–252. doi: 10.1016/0042-6989(85)90117-8. [DOI] [PubMed] [Google Scholar]
- Legge GE, Ross JA, Isenberg LM, LaMay JM. Psychophysics of reading. XII. Clinical predictors of low-vision reading speed. Investigative Ophthalmology & Visual Science. 1992;33(3):677–687. [PubMed] [Google Scholar]
- Legge GE, Rubin GS, Pelli DG, Schleske MM. Psychophysics of reading - II. Low vision. Vision Research. 1985;25(2):253–265. doi: 10.1016/0042-6989(85)90118-x. [DOI] [PubMed] [Google Scholar]
- Lei H, Schuchard RA. Using two preferred retinal loci for different lighting conditions in patients with central scotomas. Investigative Ophthalmology & Visual Science. 1997;38(9):1812–1818. [PubMed] [Google Scholar]
- Lindblad AS, Clemons TE. Responsiveness of the National Eye Institute Visual Function Questionnaire to progression to advanced age-related macular degeneration, vision loss, and lens opacity: AREDS Report no. 14. Archives of Ophthalmology. 2005;123(9):1207–1214. doi: 10.1001/archopht.123.9.1207. [DOI] [PMC free article] [PubMed] [Google Scholar]
- Lovie-Kitchin J, Mainstone J, Robinson J, Brown B. What areas of the visual field are important for mobility in low vision patients? Clinical Vision Science. 1990;4:249–263. [Google Scholar]
- Lovie-Kitchin JE, Whittaker SG. Vision ‘96, Book 1, International Conference on Low Vision Proceedings. Madrid: Organización Nacional de Ciegos Españoles; 1998. Low vision assessment for reading rehabilitation: indications for visual field assessment; pp. 268–275. [Google Scholar]
- Mansfield JS, Ahn SJ, Legge GE, Leubker A. Noninvasive Assessment of the Visual System Technical Digest. Vol. 3. Washington D. C: Optical Society of America; 1993. A new reading - acuity chart for normal and low vision; pp. 232–235. [Google Scholar]
- McMahon TT, Hansen M, Viana M. Fixation characteristics in macular disease. Relationship between saccadic frequency, sequencing, and reading rate. Investigative Ophthalmology & Visual Science. 1991;32:567–574. [PubMed] [Google Scholar]
- Owsley C, Jackson GR, Cideciyan AV, Huang Y, Fine SL, Ho AC, et al. Psychophysical evidence for rod vulnerability in age-related macular degeneration. Investigative Ophthalmology & Visual Science. 2000;41:267–273. [PubMed] [Google Scholar]
- Pelli DG. The Video Toolbox software for visual psychophysics: transforming numbers into movies. Spatial Vision. 1997;10(4):437–442. [Google Scholar]
- Pelli DG, Robson JG, Wilkins AJ. The design of a new letter chart for measuring contrast sensitivity. Clinical Vision Science. 1988;2(3):187–199. [Google Scholar]
- Pelli DG, Tillman KA, Freeman J, Su M, Berger TD, Majaj NJ. Crowding and eccentricity determine reading rate. Journal of Vision. 2007 doi: 10.1167/7.2.20. In Press. [DOI] [PubMed] [Google Scholar]
- Phipps JA, Guymer RH, Vingrys AJ. Loss of cone function in age-related maculopathy. Investigative Ophthalmology and Visual Science. 2003;44(5):2277–2283. doi: 10.1167/iovs.02-0769. [DOI] [PubMed] [Google Scholar]
- Pinheiro J, Bates D. Mixed-effects models in S and S-plus. New York: Springer-Verlag; 2000. [Google Scholar]
- Rovamo J, Leinonen L, Laurinen P, Virsu V. Temporal integration and contrast sensitivity in foveal and peripheral vision. Perception. 1984;13(6):665–674. doi: 10.1068/p130665. [DOI] [PubMed] [Google Scholar]
- Rubin GS, Turano KA. Low vision reading with sequential word presentation. Vision Research. 1994;34(13):1723–1733. doi: 10.1016/0042-6989(94)90129-5. [DOI] [PubMed] [Google Scholar]
- Rumney NJ, Leat SJ. Why do low vision patients still read slowly with a low vision aid? In: Kooijman AC, Looijestijn PL, Welling JA, van der Wildt GJ, editors. Low Vision: Research and New Developments in Rehabilitation. Amsterdam: IOS Press; 1994. pp. 269–274. [Google Scholar]
- Sass SM, Legge GE, Lee HW. Low-vision reading speed: influences of linguistic inference and aging. Optometry and Vision Science. 2006;83(3):166–177. doi: 10.1097/01.opx.0000204752.43520.17. [DOI] [PubMed] [Google Scholar]
- Scholl HPN, Bellmann C, Dandekar SS, Bird AC, Fitzke FW. Photopic and Scotopic Fine Matrix Mapping of Retinal Areas of Increased Fundus Autofluorescence in Patients with Age-Related Maculopathy. Investigative Ophthalmology & Visual Science. 2004;45(2):574–583. doi: 10.1167/iovs.03-0495. [DOI] [PubMed] [Google Scholar]
- Schuchard RA, Fletcher DC. Preferred retinal locus: a review with applications in low vision rehabilitation. Ophthalmology Clinics of North America. 1994;7:243–256. [Google Scholar]
- Schuchard RA, Naseer S, de Castro K. Characteristics of AMD patients with low vision receiving visual rehabilitation. Journal of Rehabilitation Research and Development. 1999;36(4):294–302. [PubMed] [Google Scholar]
- Seiple W, Holopigian K, Shnayder Y, Szlyk JP. Duration thresholds for target detection and identification in the peripheral visual field. Optometry and Vision Science. 2001;78(3):169–176. [Google Scholar]
- Sommerhalder J, Oueghlani E, Bagnoud M, Leonards U, Safran AB, Pelizzone M. Simulation of artificial vision: I. Eccentric reading of isolated words, and perceptual learning. Vision Research. 2003;43(3):269–283. doi: 10.1016/s0042-6989(02)00481-9. [DOI] [PubMed] [Google Scholar]
- Stevens M, Grainger J. Letter visibility and the viewing position effect in visual word recognition. Perception & Psychophysics. 2003;65:133–151. doi: 10.3758/bf03194790. [DOI] [PubMed] [Google Scholar]
- Strasburger H, Harvey LO, Jr, Rentschler I. Contrast thresholds for identification of numeric characters in direct and eccentric view. Perception and Psychophysics. 1991;49(6):495–508. doi: 10.3758/bf03212183. [DOI] [PubMed] [Google Scholar]
- Sunness JS, Applegate CA, Haselwood D, Rubin GS. Fixation patterns and reading rates in eyes with central scotomas from advanced atrophic age-related macular degeneration and Stargardt disease. Ophthalmology. 1996;103(9):1458–1466. doi: 10.1016/s0161-6420(96)30483-1. [DOI] [PMC free article] [PubMed] [Google Scholar]
- Timberlake GT, Mainster MA, Peli E, Augliere RA, Essock EA, Arend LE. Reading with a macular scotoma. I. Retinal location of scotoma and fixation area. Investigative Ophthalmology & Visual Science. 1986;27(7):1137–1147. [PubMed] [Google Scholar]
- Tyler CW. Analysis of visual modulation sensitivity. II. Peripheral retina and the role of photoreceptor dimensions. Journal of the Optical Society of America A. 1985;2(3):393–398. doi: 10.1364/josaa.2.000393. [DOI] [PubMed] [Google Scholar]
- Tyler CW. Analysis of visual modulation sensitivity. III. Meridional variations in peripheral flicker sensitivity. Journal of the Optical Society of America A. 1987;4(8):1612–1619. doi: 10.1364/josaa.4.001612. [DOI] [PubMed] [Google Scholar]
- Weleber RG, Tobler WR. Computerized quantitative analysis of kinetic visual fields. American Journal of Optometry & Physiological Optics. 1986;101:461–468. doi: 10.1016/0002-9394(86)90648-3. [DOI] [PubMed] [Google Scholar]
- White JM, Bedell HE. The oculomotor reference in humans with bilateral macular disease. Investigative Ophthalmology & Visual Science. 1990;31:1149–1161. [PubMed] [Google Scholar]
- Whittaker SG, Budd J, Cummings RW. Eccentric fixation with macular scotoma. Investigative Ophthalmology & Visual Science. 1988;29(2):268–278. [PubMed] [Google Scholar]
- Whittaker SG, Cummings RW, Swieson L. Saccade control without a fovea. Vision Research. 1991;31:2209–2218. doi: 10.1016/0042-6989(91)90173-3. [DOI] [PubMed] [Google Scholar]
- Whittaker SG, Lovie-Kitchin JE. Visual requirements for reading. Optometry and Vision Science. 1993;70(1):54–65. doi: 10.1097/00006324-199301000-00010. [DOI] [PubMed] [Google Scholar]
- Wichmann FA, Hill NJ. The psychometric function: I. Fitting, sampling, and goodness of fit. Perception and Psychophysics. 2001a;63(8):1293–1313. doi: 10.3758/bf03194544. [DOI] [PubMed] [Google Scholar]
- Wichmann FA, Hill NJ. The psychometric function: II. Bootstrap-based confidence intervals and sampling. Perception and Psychophysics. 2001b;63(8):1314–1329. doi: 10.3758/bf03194545. [DOI] [PubMed] [Google Scholar]
- Williams LJ, Lefton LA. Processing of alphabetic information presented in the fovea or the periphery: functional visual field and cognitive load. Perception. 1982;10(6):645–650. doi: 10.1068/p100645. [DOI] [PubMed] [Google Scholar]