

Summary
Background:
The labile nature of microtubules is critical for establishing cellular morphology and motility, yet the molecular basis of assembly remains unclear. Here we use optical tweezers to track microtubule polymerization against microfabricated barriers, permitting unprecedented spatial resolution.
Results:
We find that microtubules exhibit extensive nanometer-scale variability in growth rate, and often undergo shortening excursions, in some cases exceeding 5 tubulin layers, during periods of overall net growth. This result indicates that the GTP cap does not exist as a single layer as previously proposed. We also find that length increments (over 100 ms time intervals, N=16,762) are small, 0.81 +/− 6.60 nm (mean +/− s.d.), and very rarely exceed 16 nm (∼two dimer lengths), indicating that assembly occurs almost exclusively via single subunit addition rather than via oligomers as was recently suggested. Finally, the assembly rate depends only weakly on load, with the average growth rate decreasing only 2-fold as the force increases 7-fold from 0.4 pN to 2.8 pN.
Conclusions:
The data are consistent with a mechanochemical model where a spatially extended GTP cap allows substantial shortening on the nanoscale, while still preventing complete catastrophe in most cases.
Introduction
Microtubules mediate a myriad of functions in the cell, including chromosome segregation and organelle transport, and serve broadly as scaffolding for transport and morphological changes. To respond and adapt to changing cellular demands, microtubules undergo an unusual self-assembly mechanism, called dynamic instability, where the end of the microtubule switches stochastically between alternate periods of slow growth and rapid shortening such that individual αβ-tubulin heterodimeric subunits undergo net addition and loss, respectively [1]. This allows the microtubule cytoskeleton to rapidly reconfigure to support morphologic changes, and microtubules can probe the intracellular environment to explore possible arrangements [2]. Microtubules presumably “sense” the local environment by interaction with microtubule-associated proteins, which can vary spatially through, for example, kinase-phosphatase and GEF-GAP-mediated spatial gradients [3,4]. Understanding how these microtubule-associated proteins control microtubule assembly depends on understanding dynamic instability in the pure microtubule polymer as this is the substrate over which all regulation is layered.
The current model for dynamic instability is based on the concept of a stabilizing GTP-tubulin “cap” at the growing plus end of the microtubule. As new GTP-tubulin subunits add to and become embedded in the growing microtubule tip, they subsequently hydrolyze to GDP-tubulin, thereby forming a labile inner core of GDP-tubulin that is stabilized by a “cap” of GTP-tubulin at the tip. If the GTP cap is lost through hydrolysis events and stochastic dissociation of GTP-tubulin, then the inner labile core of GDPtubulin is exposed, leading to outward protofilament curling that antagonizes lateral bonds between neighboring tubulin subunits. These events ultimately promote a switch into a phase of extensive tubulin subunit loss. Switching from a growing GTP-tubulin tip to a shortening GDP-tubulin tip is called “catastrophe”, and the switch from shortening to growth is called “rescue”. Together, the rates of catastrophe and rescue, as well as the rates of growth and shortening, determine the extent of microtubule polymerization through rounds of dynamic instability, and ultimately control the spatial organization of microtubules. Critical to understanding the intrinsic dynamics of microtubules is an understanding of the size and nature of the GTP cap.
A series of studies have argued that the GTP cap is small [5-8], even as small as a single layer of GTP-tubulin [9-13]. These conclusions, which involve a variety of experimental approaches, have been shaped substantially by light microscopy studies of microtubule assembly dynamics with spatial resolution of ∼200 nm and temporal resolution of ∼30 Hz. Recent studies established the use of optical tweezers in combination with a microfabricated chamber [14,15] as a method for tracking microtubule assembly dynamics, with spatial resolution at least an order of magnitude better than traditional video microscopy achieved through video analysis [14]. In this assay, individual microtubules are held with optical tweezers and allowed to polymerize under compressive load (without buckling) against the chamber wall, achieving resolution of ∼5-10 nm at 25 Hz by video-based tracking of a microtubule-attached bead [14]. These data exhibited unexpectedly large fluctuations in the assembly rate, with the interpretation being that there are often discrete “steps” of assembly corresponding to the addition of tubulin oligomers, about 20-30 nm in size.
Here we report results from experiments using a similar optical-trapping arrangement, but with the much higher temporal resolution of 5 kHz, which is achieved using back focal plane interferometry [16,17]. This higher temporal resolution allows for temporal filtering to average out thermal motion, providing unprecedented spatial resolution of <3.5 nm at 10 Hz temporal resolution, while still retaining the ability to examine records at higher bandwidth. We observed large fluctuations in the assembly rate under compressive loads (0-2.5 pN), with persistent periods of growth and shortening that resulted in addition and loss of many tubulin subunits. The net length change during these periods is broadly distributed according to a Gaussian, with r.m.s. length changes of +/− 10-15 nm per period and regular length change observations of +/− 40 nm. These length changes do not exhibit step-like character, and are qualitatively accounted for by a mechanochemical model that assumes addition and loss by single subunits, rather than oligomers. The experimentally observed tubulin loss of ∼40 nm or more during a shortening period indicates that a single-layer cap model is insufficient to explain microtubule dynamic instability. Computational modeling qualitatively accounts for these dynamics, including shortening periods, by assuming simple first-order GTP hydrolysis resulting in ∼40 tubulins in the GTP state on average comprising the GTP cap. In addition, the model suggests that GTP-tubulin has an approximately exponential decay in concentration with increasing depth, much like the “comets” characteristic of many plus end tip-tracking proteins.
Overall, we found that microtubule growth is highly variable, weakly dependent on force, and can persist even after the loss of more than 5 layers of tubulin from the “growing” plus end. Thus, to minimize confusion we use “growth-phase” to refer to periods of average growth, previously broadly classified as “growth” in lower resolution studies. Growth-phase shortening excursions are distinct from rapid-shortening [1,8], which is more than an order of magnitude faster and typically persists for micrometers rather than nanometers.
Results
Experimental measurement of microtubule dynamics at the nanoscale
To follow polymerization, dynamic microtubules are grown from bead-linked microtubule seeds, and abut against engineered barriers [15], as shown schematically in Fig. 1 A and C. The microtubule polarity is inferred from the growth rate, determined by light microscopy (Fig. 1B) prior to the microtubule tip contacting the barrier. In this study we focused only on plus ends, identified by their faster growth [8]. The bead is held by optical tweezers [17] modified with the addition of a piezo-actuated mirror for high-precision trap steering. If the bead is held in a stationary trap as it is displaced by microtubule polymerization, some of the microtubule length change accumulates in the compliant biotin-streptavidin link between the bead and the microtubule, thus changes in microtubule length are underestimated [18]. However, force at the microtubule tip is still equal and opposite to that of the trap on the bead, allowing accurate force measurements. Applying a force clamp, which adjusts the laser position at 10 Hz to maintain a constant force at the microtubule tip (Fig. 1C), fixes the strain in the compliant link and thereby increases the precision of growth measurements [19]. This experimental method enables detection of variations in polymerization behavior at the nanoscale over very short time scales.
Figure 1.
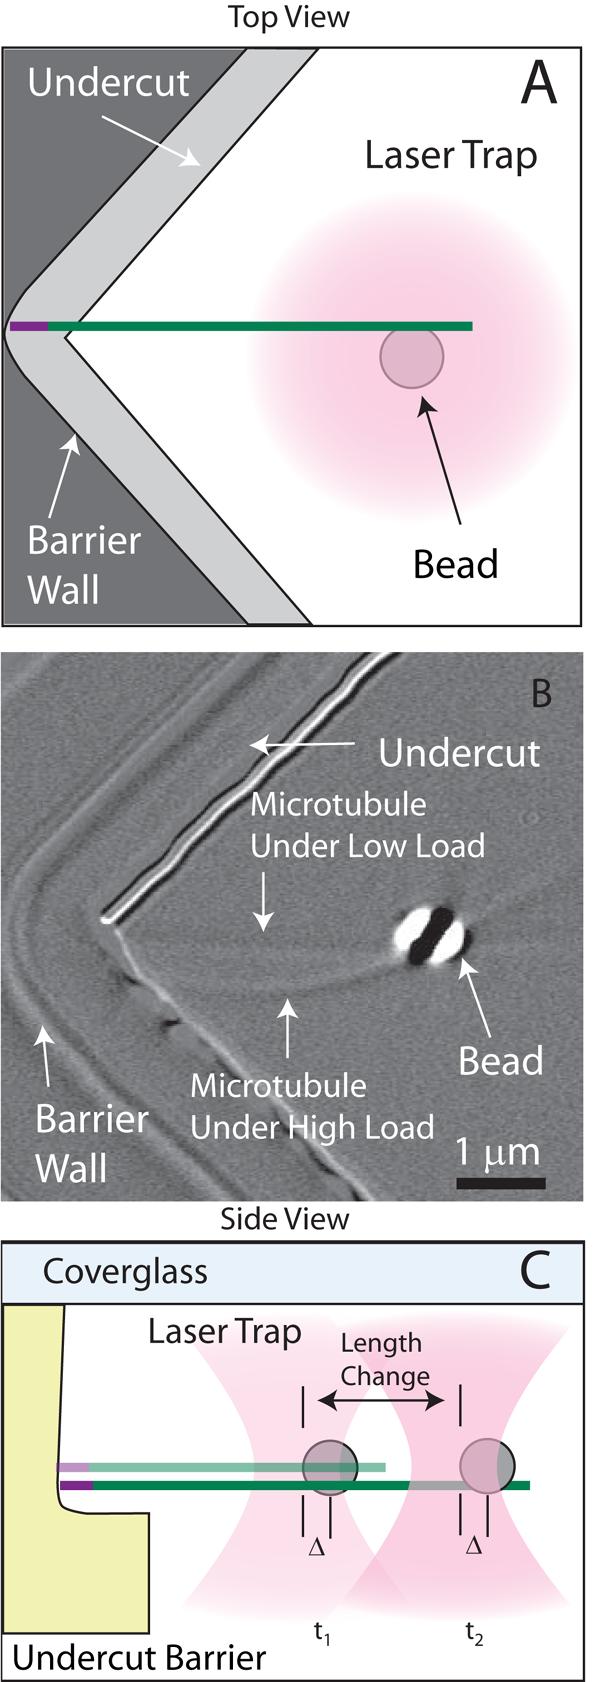
Observation of microtubule assembly at the nanoscale. (A) Schematic top view of the experimental geometry. A dynamic microtubule extension polymerizes from a bead-linked microtubule seed. The bead is held in the optical trap (magenta) such that when the growing microtubule contacts the barrier (gray), it polymerizes against the force of the trap. Lateral constraint of the microtubule is accomplished with the vertex seen in the top view while the undercut shown in the side view (Figure 1C) prevents the microtubule from slipping down off of the barrier. The barriers were carefully designed to avoid interference with the tightly focused laser and to allow high quality imaging. (B) Differential interference contrast micrograph of an experiment showing the bead, microtubule, and barrier. Two images are superimposed to show the microtubule straight before it is loaded, and later buckled to demonstrate that the tip is constrained and under load. Data is only analyzed for unbuckled microtubules. (C) Applying a force clamp allows an approximately constant load to be maintained at the microtubule tip. The laser position is updated to maintain the desired position of the bead relative to the center of the trap and therefore provides a constant average force. The positional changes of the laser trap are a direct measurement of microtubule length changes. The position of the laser is updated at 10 Hz, which is more than sufficient to follow polymerization. At this rate, the average position of the bead and hence the necessary change in laser position is determined with resolution smaller than the size of a single tubulin subunit (8 nm).
Simulations with a distributed GTP cap model predict growth-phase shortening events
In previous work, we described a three-dimensional mechanochemical model for microtubule self-assembly that recapitulated experimentally observed microtubule tip structures and assembly rates [20]. In this model, GTP-tubulin subunits stochastically hydrolyze to GDP-tubulin subunits via first order kinetics (hydrolysis rate constant of ∼1 s−1) subsequent to their incorporation into the tips of growing microtubules. This model predicts a variable GTP cap depth with an exponential decay in lattice-incorporated GTP-subunits from the tip of a given protofilament (Fig. 2A). In addition, the growing tips of simulated microtubules vary in structure from blunt tips with protofilaments of similar lengths (Fig. 2C) to sheet-like tips with a large variation in protofilament length (Fig. 2A-B).
Figure 2.
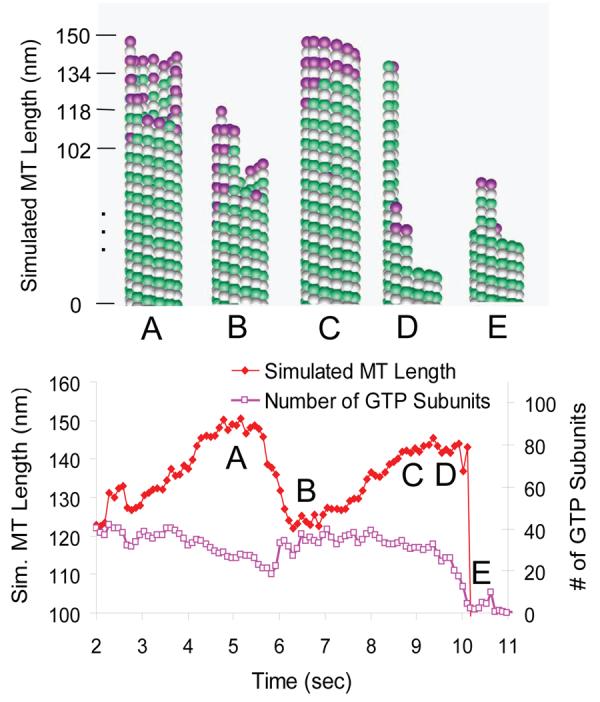
Simulation of microtubule assembly at the nanoscale. At time (A), the microtubule tip has a multiprotofilament extension with a relatively long and spatially-distributed GTP cap (magenta) of 35 subunits on average. The leading protofilaments then depolymerize and recap, resulting in a growth-phase shortening event, as shown in (B). Note that the GTP cap remains intact, never being less than 20 GTP-tubulin subunits during the shortening phase. Subsequently, the microtubule polymer continues growth, as shown in (C). Catastrophe occurs after 10 sec, as shown in (D-E), at which point the GTP cap has only 3 subunits on average.
By adapting the simulation to reproduce experimental conditions used in the bead-tracking assembly assay (see supplementary material), simulated microtubule assembly behavior could be directly compared to experimental results. In particular, we modeled not only the assembly dynamics of the microtubule, but also the thermal fluctuations and elastic forces in the system and the observation of the dynamics as detected by the experimental apparatus. Thus, we were able to predict the behavior of microtubule assembly as it would be observed with fast temporal resolution at nanometer precision. In simulations, highly variable microtubule tip structures with relatively long spatially distributed GTP caps allow for frequent shortening excursions during microtubule growth phases, as individual leading protofilaments are able to depolymerize and then subsequently recap without microtubule catastrophe. A typical simulated growth-phase shortening excursion, in which shortening and subsequent recapping of the leading protofilament occurs without microtubule catastrophe, is shown in Fig. 2. Note that the simulated GTP cap remains intact during the microtubule shortening event, never being less than 20 GTP-tubulin subunits. In the simulation, the GTP cap is typically exponentially distributed, reminiscent of the “comets” associated with many tip-tracking proteins, such as EB1, albeit with a shorter decay length. In contrast, shortening of a microtubule tip prior to catastrophe (Fig. 2D-E) results in a minimal GTP cap of ∼3 subunits, which we previously found was typical of simulated shortening microtubules [42].
Growth-Phase Microtubule Shortening Gives Rise to Polymerization Variability
Using the experimental assay described above, we examined microtubule growth behavior; in total we analyzed 35 growth-phase periods from 15 microtubules over a total of 1676.2 s, which at 5 kHz raw acquisition rate yielded 8,381,000 individual observations with sub-nanometer precision. Using temporal averaging of the raw data at 10 Hz to filter diffusive movements, we obtained 16,762 individual microtubule length measurements for subsequent analysis (complete data set given in supplementary material, Figs. S3-S5). This technique exposes highly-variable polymerization behavior over short time scales, even during periods where microtubule assembly appears stalled when observed with lower spatial or temporal resolution. Fig. 3A highlights nanoshortening events that occurred over 20 seconds of microtubule growth. In each case the microtubule does not proceed into a rapid shortening phase, but rather resumes growth. The magnitude and frequency of the growth-phase shortening events are roughly similar to those predicted by the mechanochemical model (Fig. 3A). Simulated and experimental force clamp data from a GMP-CPP stabilized control microtubule are also shown in Fig. 3A, demonstrating that the shortening events can be distinguished from thermal fluctuations of the growing microtubule's position. To quantify this behavior, we calculated the length of growth and shortening excursions over multiple experimental runs. Here, a microtubule length excursion is defined by summing successive positive or negative microtubule length displacements at sequential time points, as shown by the green and red arrows, respectively, in Fig. 3B. For example, three sequential 10 Hz time points with length changes of −1.0, −2.0, and −2.0 nm followed by a positive increment would result in a length excursion of −5.0 nm. This method provides a convenient and objective way to summarize nanoscale microtubule polymerization behavior over many different experimental runs without fitting the data to any particular model, although it will underestimate microtubule growth excursions since thermal fluctuations will obscure length excursions to some extent. Note, however, that this noise is explicitly included in the model, so that it is accounted for in the simulated dynamics. Likewise, the absolute extent of growth-phase shortening is also underestimated due to intervening periods of actual lengthening above the noise. For example, the absolute peak to trough shortening in Fig. 3B exceeds 50 nm, but the maximum detected shortening is 32 nm by this method. In summary, excursion size analysis provides a model-independent, conservative estimate of nanoscale fluctuations in microtubule assembly.
Figure 3.
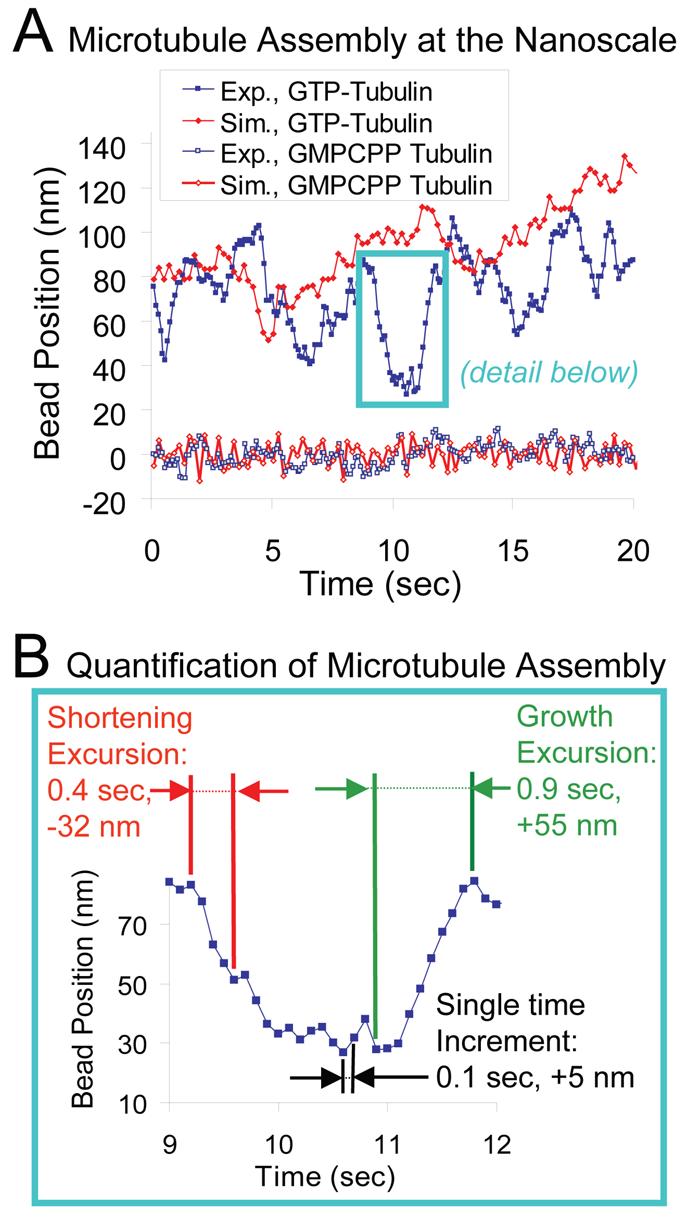
Microtubule assembly at the nanoscale. (A) Experimental and simulated individual traces of microtubule plus-end assembly behavior at 1.5 pN clamp force are shown as compared to GMP-CPP control traces. Slow net assembly at the microtubule tip is highly variable both experimentally and in simulation. There are clearly retreats during microtubule assembly that are larger than a single layer of tubulin subunits, or even a few layers. Traces from GMP-CPP stabilized microtubules are not highly variable, indicating that the variability is intrinsic to microtubule growth behavior, and not an artifact of the data collection method. (B) Quantification of microtubule assembly at the nanoscale. To quantify the variability in microtubule assembly, growth and shortening excursions are defined as the total number of consecutive displacements in either the positive or the negative direction (shown by green and red arrows, respectively). The length of these multiple time step excursions are then recorded as a measure of growth variability. In contrast, single time-step length increments are also recorded as a measure of microtubule growth activity within a short time interval (sampling interval = 0.1 s), as shown by the black arrows.
Microtubule Growth Under Low Force (0-1 pN)
As shown in Fig. 4A, shortening excursions are common during microtubule growth under low load (0-1 pN). The shortening excursions can be quite large, in some cases 40 nm or larger, corresponding to ∼5 layers of tubulin. Similarly, the growth excursions can also be quite large, again 40 nm or more. For both shortening and growth excursions, the model, which only permits tubulin addition and loss via single αβ-tubulin subunits, predicts that excursions of ∼40 nm for both growth and shortening will be observed in this assay. Typically the excursions in the experiment and the simulation are relatively small, corresponding to roughly one layer of tubulin. Experimentally we find a mean shortening excursion length under low load of −9.7 nm, and a mean growth excursion length of +13.3 nm (n=7,617, Table 1), resulting in net growth of +3.6 nm per growth excursion-shortening excursion cycle. Shortening and growth excursions for GTP microtubules (−9.7 nm and +13.3 nm, respectively) are larger than those observed for GMP-CPP controls (−4.4 nm and +4.7 nm, respectively), differences that were statistically significant (p<10−57 via one-tailed t-test). Thus, the growth and shortening excursions observed in the presence of GTP reflect the dynamics of microtubule assembly, rather than simply the thermal fluctuations in the experimental system. Low force summary statistics are given in Table 1.
Figure 4.
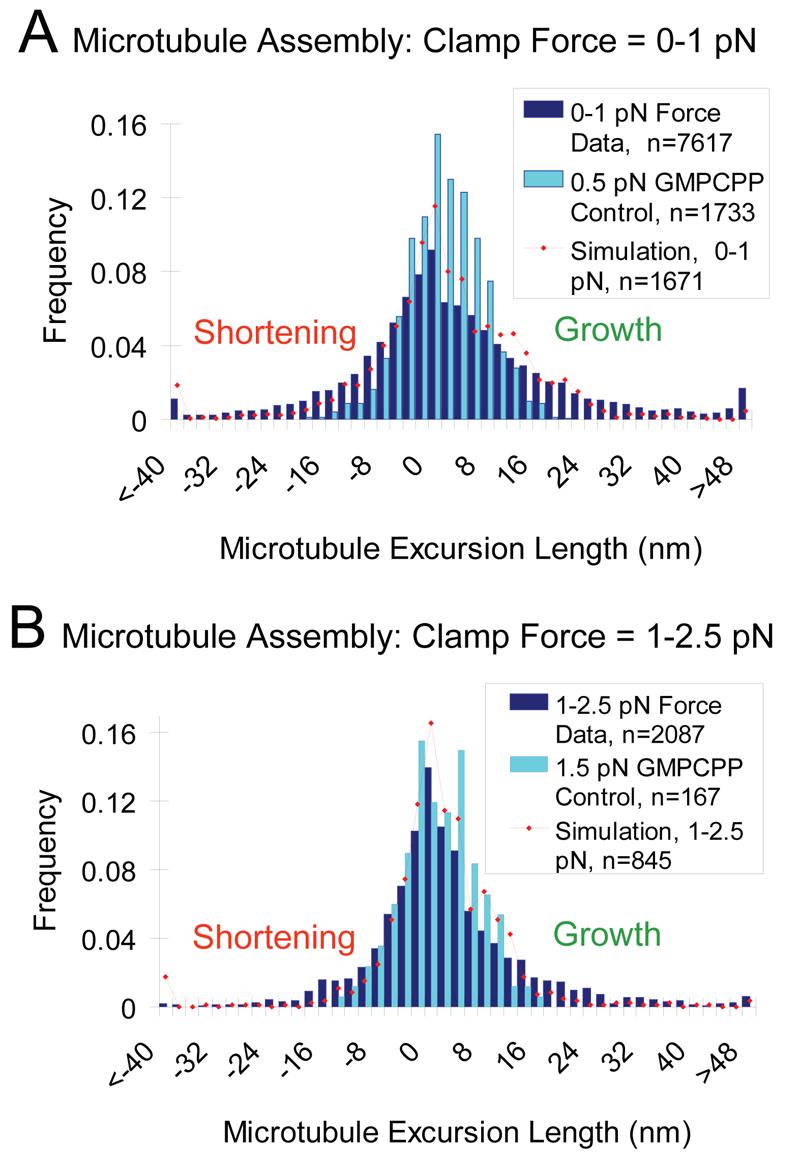
Microtubule assembly is highly variable, with frequent growth-phase shortening events. (A) A histogram of microtubule growth-phase excursion lengths for 0-1 pN force clamp as compared to GMP-CPP controls. Excursion lengths are defined in this analysis as sequential negative or positive microtubule length changes (no fitting), as shown in 3B. Growth-phase shortening events are large compared to GMP-CPP controls, indicating that experimental noise cannot account for the observed behavior. The model qualitatively accounts for the extent of positive and negative excursions (red) (B) A histogram of microtubule growth-phase length changes for 1-2.5 pN force clamp experiments, as compared to GMP-CPP controls. At higher clamp forces, both growing and shortening excursions are restricted as compared to low clamp force results (p=9.7×10⁻⁴ for growth, p=3×10⁻⁷ for shortening), reducing the overall variability in observed microtubule assembly behavior. This result suggests that the microtubule tip structure is influenced by the force on a microtubule, possibly by limiting the propensity of a few protofilaments to extend beyond their neighbors. The model (red) is qualitatively consistent with the extent of fluctuation and predicts the reduction in variability.
Table 1.
Nanoscale Assembly Excursion Lengths
| Experimental Force Clamp |
Microtubule Description |
Number of Excursions Measured |
Mean Growth Excursion Length |
Mean Shortening Excursion Length |
|---|---|---|---|---|
| 0-1 pN | GTP | 7,617 | 13.3±14.1a nm | −9.7±10.5a nm |
| GMP-CPP | 1,733 | 4.7±3.5 nm | −4.4±3.7 nm | |
| 1-2.5 pN | GTP | 2,087 | 9.5± 10.5 nm | −6.4±6.7 nm |
| GMP-CPP | 167 | 4.7±3.2 nm | −4.5±3.2 nm | |
mean +/− standard deviation
Microtubule Growth Under High Force (1-2.5 pN)
Increasing the force on a microtubule has surprisingly little effect on the overall behavior of assembling microtubules. As shown in Fig. 4B, microtubules grown under high force (1-2.5 pN) exhibit a distribution of growth and shortening excursions during growth phases that is qualitatively similar to that observed at low force (Fig. 4A). However, we find a number of statistically significant effects of increasing force. First, we find that the range of excursions is diminished. As expected, the mean growth excursion length decreases to +9.5 nm, which is significantly less than the low force value of +13.3 nm (p<10−3). Surprisingly, the mean shortening excursion length decreases (in magnitude) at high force to −6.4 nm, which is significantly less (in magnitude) than the low force value of −9.7 nm (p<10−6). Taken together, this means that the range of observed growing and shortening excursions during microtubule assembly is narrower at high force, and that fluctuations are generally suppressed (Fig. 4B, Table 1). Despite the suppression of fluctuations, the GTP dynamics are still statistically different than the GMP-CPP dynamics (see Table 1, p<10−19 for growth excursions, and p<10−5 for shortening excursions). These results, which are qualitatively reproduced by the model, suggest that at low forces the microtubule tip tends toward structures that promote larger shortening events. In the simulation, we found that microtubules under low force (0.5 pN) had an average difference between the leading and lagging protofilaments of ∼5-6 tubulin subunits (40-48 nm), whereas under high force (2.5 pN), this difference was only ∼2-3 tubulin subunits (16-24 nm). The reason for this is simple: at high force the addition rate to the leading protofilaments is more strongly suppressed, relative to the lagging protofilaments, than at low force. This creates a narrowing of the distribution of excursions, consistent with the experimental data. In low force simulations (0.5 pN) there are typically ∼3 protofilaments whose tubulin addition rate is significantly suppressed by the wall at any point in time (defined as >2-fold reduction in on-rate constant), while in high force simulations (1.5 pN) there are ∼6 protofilaments whose growth is influenced by the wall. In the model, the failure to grow significantly faster at low force is the result of sheet-like projections that often fail to be stabilized and are therefore lost, as in Fig. 2 time points A and B. At high force, model microtubules are relatively blunt and thus resistant to both growth and shortening excursions, consistent with the experimental data.
In summary, we find that microtubules exhibit large fluctuations in assembly during growth phases, including shortening excursions that correspond to loss of up to ∼5 tubulin layers. These fluctuations are somewhat larger at low force than at high force, indicating that they are a natural feature of microtubule assembly in the absence of force.
Single time increment microtubule length changes do not reflect oligomer addition or loss
Since we found that large growth and shortening excursions occur during growth phases, we were interested in assessing whether these events were the result of tubulin oligomer addition, as recently suggested by Kerssemakers et al. [14]. Kerssemakers et al. reported step-like behavior that they attributed to oligomers, and these steps could be 30 nm or more. If oligomers were significant, then we ought to be able to detect them over single 0.1 s time intervals as large jumps corresponding to 16, 24, or 32 nm if the oligomer were a dimer, trimer, or tetramer of subunits, respectively (a single subunit being one αβ-tubulin heterodimer having length 8 nm). To test whether oligomers were accounting for the large growth and shortening excursions, we calculated the length increment over a single time interval (see Fig. 3B, “single time increment”). As shown in Fig. 5, there was a broad distribution of single time increments. Only very rarely were these single increments large enough to suggest addition or loss of an oligomer. In fact, increments exceeding 16 nm in magnitude were observed less than 1% of the time, and increments larger than 22 nm in magnitude were never observed in any of the 16,762 increments. Furthermore, when the unfiltered 5 kHz data was examined for increments exceeding 16 nm, these larger increments appeared to be periods of rapid growth rather than abrupt steps (data not shown). The mean length change for a single 0.1 s time increment was 0.81 nm, with a standard deviation of 6.60 nm (Table 2, N=16,762 individual increments). Over the same time interval, stable GMP-CPP controls had a mean length change of 0.00 ± 3.50 nm (Table 2, N=2,442 individual increments), demonstrating the ability to detect net growth from the single increment data (p<10−20, one-tailed t-test comparing single time step length increments for GTP vs GMP-CPP microtubules). The standard deviation of the GMP-CPP control increments, 3.50 nm, largely reflects the variability due to thermal fluctuations in each increment, and so is appropriately regarded as a measure of the spatial resolution for detecting length changes at 0.1 s sampling intervals. We find that the standard deviation of the GTP single time increments, 6.60 nm, is significantly larger than GMP-CPP control (p<10−20), demonstrating the ability to detect tubulin addition-loss in single time increments. As shown in Fig. 5, simulations produced a distribution of single time point microtubule length increments similar to experimentally observed results (red line, Fig. 5). Notably, it was found that large increments of 16-24 nm were occasionally produced in the simulation, even though subunit addition in the model was strictly via single subunits. In the simulation there are on average ∼26 tubulin arrival events and ∼25 departure events, for a net gain of ∼1 tubulin per 0.1 s, which matches well the experimentally observed mean increment of 0.81 nm (1 tubulin added corresponds to 8 nm/13 protofilaments = 0.6 nm average length added). The actual number of arrivals and departures in any 0.1 s interval is approximately binomially distributed, meaning that the distribution of increments will in turn be approximately Gaussian and sufficiently broad in their distribution so as to occasionally allow 16 nm increments via single subunit addition only. The simulation never produced increments larger than 22 nm, consistent with the experiment. Thus, we conclude that the variability in growth phase events is not likely due to tubulin oligomer addition or loss.
Figure 5.

Single 0.1 second time increment sampling demonstrates that tubulin dimers add as single subunits, not oligomers. Single time microtubule length increments are summarized for individual time steps during assembly. Both GTP microtubules and GMP-CPP control microtubules show small, Gaussian-distributed length fluctuations at single time steps, indicating that tubulin oligomer addition and loss is highly unlikely. The increments in the presence of GTP are larger than in GMP-CPP controls, and the model accounts for the extent of fluctuations observed experimentally while assuming that tubulin addition occurs via single subunits only.
Table 2.
Nanoscale Assembly Single Time Length Increments
| Experimental Force Clamp |
Microtubule Description |
Number of Single Time Increments Measured |
Mean Single Time Increment Length |
Standard Deviation Single Time Increment Length |
|---|---|---|---|---|
| 0-2.5 pN | GTP | 16,762 | 0.81 nm | 6.60 nm |
| 0-2.5 pN | GMP-CPP | 2,442 | 0.00 nm | 3.50 nm |
Microtubule Polymerization Rate is Weakly Dependent on Force
The analysis of growth and shortening excursions (Fig. 4 and Table 1) revealed that the assembly is only weakly dependent on force. From the individual traces obtained under force-clamp conditions (Fig. 2, Supplementary Figs. S3-S5) it appears that the variability within a given trace is as large as the variability across the population. The weak force dependence observed above predicts that even within a single microtubule there should be weak dependence of assembly rate on force. As shown in Fig. 6A, this is indeed the case when the force is progressively decreased from 1.6 pN to 0.7 pN, and it was found that there is no obvious relation between force and growth rate; short term variability apparently overwhelms any effect of force.
Figure 6.
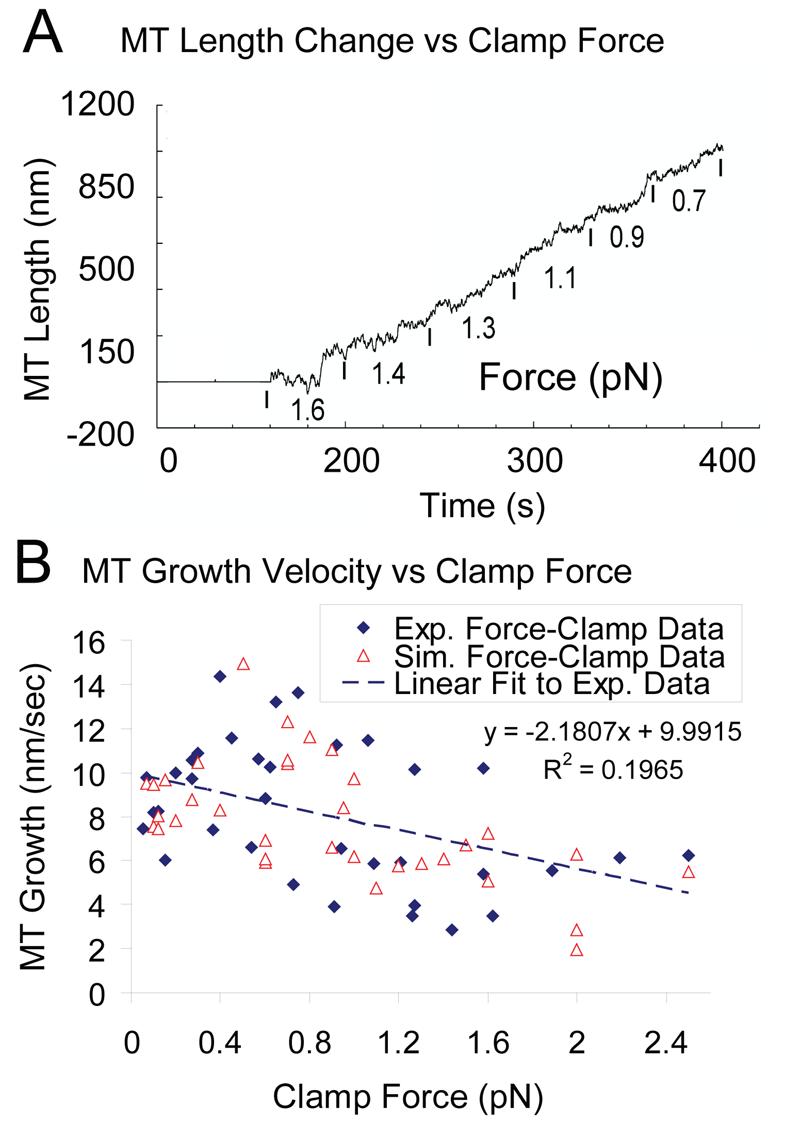
Growth velocity depends weakly on force. (A) A microtubule length history tracked under a range of loads held constant using the force clamping routine. The growth rate is variable at all loads, with no dramatic increases in rate as the load is reduced. (B) Microtubule growth velocity is weakly dependent on force (applied in force-clamp mode) both in simulation and experiment. The high variability is the result of variability in assembly at the nanoscale.
Examination of all the traces reveals a weak decrease of average growth rate with increasing force, as shown in Fig. 6B. The decrease was statistically significant (p<0.008), but was only about 2-fold, even though the force increased 7-fold. The simulation results are consistent with the experiment in both variability and weak force dependence (Fig. 6B). Thus, we conclude that assembly is only weakly dependent on force, and the relationship between them can be obscured by the high variability in growth rate and is only discerned through averaging over many microtubule growth phases.
Discussion
By combining optical tweezers with custom-engineered microscale barriers to microtubule polymerization, we are able to track tubulin addition and loss events at the growing tip of a compressively loaded dynamic microtubule. Using back focal plane interferometry for high temporal and spatial resolution, and applying force-clamping to increase the accuracy and resolution of displacement measurements, we attain unprecedented nanometer scale precision. We find that microtubule growth rates are highly variable with polymerizing microtubules frequently experiencing shortening excursions that can remove up to ∼5 layers of tubulin from the microtubule tip. That microtubules can sustain such extensive tubulin loss and remain in the growing state argues against a single-layer GTP cap and is consistent with simulations that assume an exponentially-distributed multilayer GTP cap. Growth rate variability persists over a wide range of forces, and even over longer time scales the average growth rate is only weakly dependent on force. We find that these newly observed features of assembly under load arise naturally from a simple mechanochemical model.
Implications for Models of Microtubule Dynamic Instability
Understanding the molecular mechanisms of microtubule dynamic instability is critical for understanding how microtubule-associated proteins (e.g. EB1, APC, tau, Op18/stathmin, and XMAP215/TOG) control microtubule behavior in normal, diseased, and injured cells. The GTP cap hypothesis is central to our understanding of microtubule assembly [1], and is widely accepted even though the cap itself has not been directly visualized. The central premise is that αβ-tubulin heterodimers are stable in the microtubule lattice when their beta subunit is bound to GTP, and relatively unstable when their beta subunit binds GDP. The relative instability of the GDP subunits is believed to derive from the intrinsic tendency of GDP subunits to form bent protofilaments that prefer to kink radially outward. This kinking then mechanically antagonizes lateral bonds within the microtubule lattice and thus promotes disassembly. Conversely, GTP-tubulin subunits are believed to form relatively straight protofilaments, thus reducing the mechanical stress on lateral bonds and thereby stabilizing the microtubule [21-24]. Tubulin adds to the microtubule lattice as GTP-tubulin, and is subsequently hydrolyzed to GDP-tubulin. This maintains a cap of straight, relatively unstrained GTP-tubulin that holds the microtubule tip together, thus preventing the GDP subunits from destabilizing the lattice by assuming their preferred bent conformation; if the cap is lost, rapid shortening ensues. Depending on the relative rates of tubulin addition, tubulin loss, and GTP hydrolysis, the cap could be small and confined to the very tip of the microtubule.
A substantial body of work has argued that the GTP cap is very small, possibly as small as a single layer of tubulin [9-13], or only slightly larger [5-8] (see review in [37]). Our observation of highly variable microtubule growth, with shortening excursions of up to ∼5 layers or more of tubulin during a growth phase, is difficult to reconcile with a single layer GTP cap model, since the entire GTP cap would be frequently lost during these growth-phase shortening excursions. However, measuring the size of the GTP cap is very challenging, and after careful consideration of the arguments, experimental methodology, and data, we argue that the resolution in these earlier studies is probably insufficient to rigorously differentiate between a single discrete cap at the tip, versus a cap that is distributed over several layers of GTP at the end of a microtubule. In addition, in many cases these earlier studies estimated the minimum cap required for maintenance of the growth phase, rather than the actual size of the cap during growth. Importantly, upper bounds have also been placed on cap size via analysis of microtubule catastrophe subsequent to dilution, which resulted in the cap being rapidly lost within 1-2 sec, and led to estimates of the cap being at most 60-100 subunits deep if both hydrolysis and subunit loss are accounted for [7,8]. Also, many of these studies implicitly assumed that GTP subunits form a discrete cap, with hydrolysis proceeding as an induced wave that follows polymerization. This model implicitly assumes coupling or cooperative behavior between tubulin subunits. This is a substantially more complicated picture than the physically direct and simple assumption that GTP hydrolysis events are independent and stochastic first-order events as originally proposed by Mitchison and Kirschner [1]. By assuming uncoupled hydrolysis, the cap becomes effectively deeper for given number of GTP-tubulin units, as the GTP-tubulins are distributed throughout the tip region, rather than confined only to the last layer or two. The consequence is that the tip is expected to fluctuate on the nanoscale while remaining in the growth state.
Our theoretical treatment of microtubule dynamic instability assumes uncoupled hydrolysis [20,42], and is approximately consistent with the newly observed nanoscale dynamics reported here. This mechanochemical model reasonably approximates: 1) the variability in the assembly during growth on the nanoscale, 2) the range of excursion sizes including occasional shortening excursions of 5 layers, 3) the reduction in excursion size (both growing and shortening) at high load, 4) the variability in the single time increments, and 5) the relative insensitivity of assembly on load. The model assumes that hydrolysis obeys a first-order reaction once a GTP-tubulin is buried in the lattice with a rate constant of ∼1 s−1 [20,42]. That the terminal GTP-tubulin would be spared hydrolysis is consistent with the βtubulin subunit being exposed at the plus end with the GTP exposed to the solvent rather than to neighboring tubulin dimers [25]. Once another tubulin adds onto the protofilament, the formerly terminal GTP-tubulin is now the penultimate subunit and its GTP experiences a completely different biochemical environment. In the model, these buried subunits then undergo random hydrolysis leading to a spatially decaying distribution of GTP-tubulin near the tip, with progressively fewer GTP-tubulins as a function of distance away from the microtubule tip. In fact, the predicted approximately exponential decay of GTP-tubulin with increasing depth is reminiscent of, and mathematically similar to, the ‘comets’ observed with fluorescently tagged “tip tracking” proteins such as EB1. The first-order GTP hydrolysis for buried subunits and the resulting approximately exponential decay of GTP-tubulin spatially is also very similar to how Mitchison and Kirschner first hypothesized the cap structure might behave in their original report on dynamic instability [1]. The number of GTPtubulins in the microtubule lattice is predicted by the model to typically be ∼40-60 (Fig. 2) [20,42], consistent with the previous estimates of maximum cap size from dilution studies (60-100, discussed above). In addition, caps as small as 10-20 GTP-tubulins are sufficient to prevent complete catastrophe in most cases (Fig. 2), which is consistent with previous estimates of minimum cap size. When the cap falls below ∼10, it is very likely that a catastrophe and subsequent rapid disassembly will occur (Fig. 2). In summary, the mechanochemical model of VanBuren et al. [42] is a physically straightforward model that is in reasonable agreement with the new nanoscale assembly data. Future work is required to more thoroughly test the mechanochemical model to account for such phenomena as lattice defects and the microtubule seam, and their potential role in dynamic instability.
In principle, other models could explain these data as well. However, there have been relatively few attempts to construct models that explicitly account for dynamic instability at the nanoscale via explicitly accounting for individual tubulin dimer addition and loss. The first such models were constructed by Chen and Hill in the 1980s [26], and these were followed by the ‘Lateral Cap’ model of Bayley and co-workers [9]. The main problem with the models of Chen and Hill is that they predicted large cap sizes (∼200) that later turned out to be inconsistent with experimental measurements. Bayley and coworkers attempted to address this issue in the Lateral Cap model by assuming that addition of an incoming GTP-tubulin instantly forced hydrolysis of an underlying GTP. This ensured that the cap was at most one layer deep. However, the present nanoscale fluctuation results, where shortening excursions of multiple tubulin layers do not necessarily result in catastrophe (Fig. 3A and Fig. 4A), stand in contradiction to the assumptions of the Lateral Cap model (see supplemental material for Lateral Cap model simulations as compared to nanoscale experimental results). Other models have attempted to describe cap dynamics without describing the details of the individual tubulin dimers [27,28]. At the time, a coarse-grained modeling approach could be considered appropriate given the relatively low resolution with which microtubule assembly could be observed via light microscopy. However, such coarse-grained models are unable to aid in interpreting the present interferometry-based measurements with 3.5 nm resolution (Fig. 5, Table 2). As experimentation has now been pushed to the nanoscale, it is necessary for the modeling to push to the nanoscale as well.
Microtubule Growth is Highly Variable, but Does Not Involve Oligomeric Steps
Using an approach similar to ours, though with lower spatial and temporal resolution, a recent study reported stepwise growth of microtubules, and steps were attributed to addition of oligomers of tubulin subunits (i.e. a “dimer” has two subunits of length 16 nm, a “trimer” has three subunits of length 24 nm, etc.) [14]. Our data shows no evidence of this, though we find events with a similar step-like appearance when we process our data similarly to Kerssemakers et al. However, when viewed at higher bandwidth these events are clearly not steps (see supplemental information, Fig. S6). Similar events of relatively rapid length change, producing an appearance that could be considered step-like, are also present in simulations of lower bandwidth data (e.g. at ∼6 s in Fig. 2), despite the fact that only single subunit additions are modeled. These results illustrate the difficulty in discriminating steps in highly variable data. A step is by definition a period of rapid movement, and without a fundamental physical expectation for the structure of a step, it is only possible to say that events occurred more quickly than can be resolved on a given time scale. Because microtubule growth is highly variable, periods of rapid length change by successive net addition of subunits can be easily misinterpreted as steps, especially by algorithms that do not test the null hypothesis that steps do not exist. This naturally leads to the expectation that for a given criterion, steps will be identified more frequently if the average growth rate is rapid, as seen in Kerssemakers et al.'s interpretation of microtubule growth accelerated by the presence of XMAP215. Of course it is possible that oligomers do occasionally add to the tip of a microtubule. Strictly speaking, some oligomers will exist in equilibrium with the individual subunits in solution, although using the estimated value for ΔG0*Long=−7 kBT (Kdimer formation=2200 M−1) and a free tubulin-GTP subunit concentration of 5 μM, we estimate the concentration of dimers (i.e. two subunits associated head to tail) to be ∼50 nM (if ΔG0*Long=−9 kBT, then Kdimer formation=16,000 M−1, and dimer concentration is ∼300 nM at 5 μM total tubulin concentration). In our simulation, assuming dimers exhibit the same on-rate as monomers, this would result in an expected addition of a dimer once every 0.4 s, or ∼1 out of 100 addition events (if ΔG0*Long=−9 kBT, then a dimer would be added ∼1 out of 15 addition events, or ∼1-2 out of the ∼26 addition events per 0.1 s observation period). In addition, the bimolecular on-rate constant for addition of dimers to the microtubule tip will likely decrease somewhat for the larger complexes owing to their slower translational and rotational diffusion, which will diminish the role of oligomers. Further, it might be expected that longitudinal association of the two subunits in solution would promote the hydrolysis of the beta subunit on the minus end of the dimer [25], so that the dimer can no longer form the full complement of lateral bonds with the microtubule lattice because of the kink induced by hydrolysis. Thus, from thermodynamic and biochemical arguments we expect the contribution of even the most common oligomers (2 subunits) to be negligible in our assay, occurring in less than 1 out of 100 addition events. This is both consistent with our results, and also with the most straightforward interpretation of the extremely steep, exponent 12 ± 2, dependence of microtubule nucleation on the concentration of tubulin [29], which suggests that oligomers are highly unstable and very short lived below the critical concentration for nucleation (∼15 μM under our experimental conditions). However, we note that under some experimental conditions, for example high concentrations of magnesium or tubulin, oligomers become more prevalent [30-33]. We expect that the study of Kerssemakers et al. had a similar oligomer concentration to our study, because both studies had about the same microtubule growth rate (∼10 nm/s) despite using different tubulin concentrations, magnesium concentrations, and temperatures. Finally, the length fluctuations that we observed experimentally in single time increments were fully accounted for by a mechanochemical model that assumes assembly via single subunits (Fig. 5).
Previous observations of fluctuations during growth
These results show that the microtubule growth-phase is composed of a previously unobserved series of lengthening and shortening events. Indeed microtubules that would be described as growing in lower resolution studies, in fact are shortening much of the time. The variability of microtubule growth rates that was identified in lower-resolution microscopy studies [34-36] is now revealed to be largely due to frequent interspersion of shortening excursions during overall net growth. States that appear as “pauses” at low resolution are in fact composed of repeated switches between growth and shortening excursions. Conversely, filtering our high resolution data to data rates characteristic of microscopy based studies produces traces with similar variability.
Shortening excursions require the loss of many subunits during growth phases. Using light microscopy, Walker et al. [8] estimated the off-rate during growth to be 44 s−1. From our simulations, we estimate that the off-rate of subunits is ∼250 s−1. However, the vast majority of these departures were of subunits that had no lateral neighbors, which would be difficult to detect by light microscopy. By contrast, simulated subunits with 1 or more lateral neighbors dissociated at a rate of 18 s−1. Thus, we expect that light microscopy would yield an off-rate during growth of between 18 s−1 and 250 s−1, consistent with the value estimated by Walker et al. of 44 s−1.
We find that growth-phase shortening persists through the loss of many subunits, indicating that periods of polymerization and depolymerization during growth reflect different structural/chemical states at the tip of a microtubule, and not the tails of a Gaussian distribution arising from simple on and off kinetics, consistent with conclusions from previous analysis at lower resolution [34-36]. These observations indicate that the tip of a microtubule dynamically transitions through a range of quasi-stable states with different polymerization rates (Fig. 2). Over short time periods (<1 s) such changes are revealed by transitions between growth and shortening, while over longer periods microtubules can evolve quasi-stable conditions during which transitions to shortening are more frequent or relatively suppressed.
Implications for microtubule assembly in vivo
The occurrence of shortening excursions during growth suggests that the specific suppression of these excursions in vivo might account for the high growth rates that are observed in vivo (reviewed in [37,38]. The large intrinsic variability of microtubule growth rates clearly expands the range of mechanisms available for rapid restructuring of the microtubule cytoskeleton, and for controlling the force of microtubule polymerization during processes such as directing chromosome movements [39], organelle positioning such as nuclear positioning in yeast [40], or in the outgrowth of neuronal processes [41]. Another interesting implication of our studies is a relatively weak dependence of velocity on compressive load, suggesting that if microtubule assembly is regulated by compressive load in vivo, it is likely through the catastrophe frequency rather than the assembly rate. The likely reason for the weak dependence of the load is that there are many protofilaments available “in reserve”, that are close to the leading protofilament but not close enough to the wall to be significantly affected in their tubulin addition rate. In fact, our modeling indicates that only a relatively few protofilaments, typically ∼3 out of 13 protofilaments (at 0.5 pN), are affected by the wall on average . This stands in contrast to actin filaments, which have only two protofilaments, and so their growth rate would be expected to be affected more strongly by compressive load than microtubules.
The greatly improved resolution of these studies reveals growth-phase variability paramount to microtubule dynamics. Our data builds on earlier studies examining variability of growth [34-36] and provides a new experimental test that supports a simple mechanochemical description of microtubule growth [20,42]. By achieving nanometer scale precision, we are able to resolve complex underlying behaviors that were obscured by longer time or ensemble averaging, including nanoshortening events, and variability of the relation between force and growth-rate. This has important implications for considering how external factors (e.g. drugs, MAPs, forces) alter the behavior of individual microtubules, as many details of the events occurring at the tip of a growing microtubule can disappear in lower resolution averages. Our assay, combined with the computational modeling, provides an integrated platform for further investigation of microtubule-associated protein regulation of microtubule assembly at the nanoscale. Going forward, the application of high-resolution techniques in the presence of MAPs or microtubule drugs promises to reveal details of physiologic microtubule and MAP behavior, including tip tracking, and actions of drugs that modulate microtubule behavior, such as the chemotherapy agents taxol and vinblastine.
Experimental Procedures
Microtubule seeds
Unless otherwise specified, all samples are in BRB-80 (80 mM pipes, 1 mM MgCl2, 1 mM EGTA, pH=6.8). All reagents are from Sigma unless otherwise specified. Microtubules are polymerized from thrice-cycled bovine brain tubulin [43,44], taxol stabilized and pelleted in an airfuge (Beckman) for 5 minutes at 28 psi, resuspended, and biotinylated by 15 minutes incubation in 1.7 mM biotin succinimidyl ester. The biotinylation reaction is quenched with 3 volumes of 400 mM glycine for 10 minutes. Microtubules are pelleted, resuspended and passed through a 30 gauge needle 5-7 times to break the microtubules into ∼ 3 μm lengths. Finally the microtubules are pelleted and resuspended three times in buffer not containing taxol. A conservative estimate of remaining taxol in an experimental solution is below 10 pM, far below the concentration required to detectably change microtubule behavior [45] (∼100 nM) or for significant microtubule binding [46] (Kd = 10 nM).
Silica microspheres
Silica beads (0.6 micron diameter; Bangs Labs), suspended at 10 mg/ml, are incubated with 20 μg/ml bovine albumin biotin at room temperature for five minutes. Beads are pelleted, resuspended at 1 mg/ml, and incubated in 20 μg/ml streptavidin (Molecular Probes) at room temperature for five minutes. Finally beads are pelleted and resuspended four times before being aliquoted, flash frozen and stored at 10 mg/ml.
Optical tweezers
The optical tweezers are identical to those described previously [17] with two exceptions. First, the acousto-optic deflectors used to steer the beam in the original instrument were replaced by a tip-tilt mirror (Physik Instrumente). Second, the entire room that housed the instrument was temperature controlled to 36° C by use of a small radiant heater controlled via a feed back circuit reading a thermocouple positioned near the microscope stage. To prevent drift due to temperature differentials across the large thermal mass of the optical table and additional equipment, the entire room was held within a range of one degree Celsius. Device calibration was carried out by fitting the power spectral density with a Lorentzian [47]. Agreement with more direct calibration by laminar flow around the trapped particle was also checked, and agreed within 10% [17]. Calibrations of stiffness and detector sensitivity across the range that a bead could be expected to traverse during an experiment varied less than 2 %. Finally, the stiffness and sensitivity were verified in the presence of barrier patterned coverglasses.
Polymerization assays
Microtubule seeds are diluted in BRB-80 buffer containing labeled glass microspheres (0.5 mg/ml), GTP (1 mM), Mg2+ (2 mM), catalase (0.12 mg/ml), glucose oxidase (0.6 mg/ml), glucose (30 mM), dithiothreitol (2 mM) and αβ-tubulin (5 μM ). This polymerization mixture is introduced into a chamber created using a standard slide, aluminum foil spacers, and a coverslip with microfabricated barriers [15]. A suitable bead is located, trapped, and inspected by differential interference contrast microscopy for a microtubule. The bead and microtubule are brought to one of the barrier structures using the laser tweezers, and the microtubule is oriented toward the barrier by maneuvering the optical trap.
Stationary trap experiments simply allow the microtubule to polymerize into the barrier. Once the microtubule encounters the barrier, polymerization is tracked by recording bead position at 5 kHz. As the microtubule polymerizes against the barrier, its additional length pushes the bead from the center of the trap resulting in a force at the tip.
Feedback controlled experiments (force-clamp) are performed by updating the trap to maintain a constant force at the microtubule tip. Typically bead position and force data are collected at 5 kHz. The average position of the bead is calculated and the laser position is updated at 10 Hz. The force clamp is only initiated after the microtubule has grown to the barrier and displaced the bead.
Microtubule Dynamics Simulations
Simulations were run using MATLAB (The Mathworks, Natick, MA) as previously described [20,42], except for the following. (1) Modifications were made to the simulation program to account for the experimental force clamp routine, and (2) the simulation output was modified to match the experimental bead tracking method as described above. Details are provided in supplemental materials.
Supplementary Material
Acknowledgments
The authors would like to thank Dr. Edgar Meyhofer for valuable discussion and comments on this work, and Drs. Yan Chen, Joachim Mueller, and Erkan Tuzel for helpful discussions. The chemical engineering clean room at the University of Michigan supplied lithography equipment and expertise. This work was supported by the grants to AJH from the Burroughs Wellcome Fund and the National Science Foundation MCB-0334835. HTS was supported by the Whitaker Foundation, MKG is supported by National Institutes of Health NRSA grant EB005568. DJO is supported by National Institutes of Health grant GM071522 and by National Science Foundation grant MCB-0615568. The authors are grateful to the Minnesota Supercomputing Institute for providing computing resources.
Footnotes
Publisher's Disclaimer: This is a PDF file of an unedited manuscript that has been accepted for publication. As a service to our customers we are providing this early version of the manuscript. The manuscript will undergo copyediting, typesetting, and review of the resulting proof before it is published in its final citable form. Please note that during the production process errors may be discovered which could affect the content, and all legal disclaimers that apply to the journal pertain.
References
- 1.Mitchison T, Kirschner M. Dynamic Instability of Microtubule Growth 123. Nature. 1984;312:237–242. doi: 10.1038/312237a0. [DOI] [PubMed] [Google Scholar]
- 2.Kirschner M, Mitchison T. Beyond self-assembly: from microtubules to morphogenesis. Cell. 1986;45:329–342. doi: 10.1016/0092-8674(86)90318-1. [DOI] [PubMed] [Google Scholar]
- 3.Kalab P, Pralle A, Isacoff EY, Heald R, Weis K. Analysis of a RanGTP-regulated gradient in mitotic somatic cells. Nature. 2006;440:697–701. doi: 10.1038/nature04589. [DOI] [PubMed] [Google Scholar]
- 4.Niethammer P, Bastiaens P, Karsenti E. Stathmin-tubulin interaction gradients in motile and mitotic cells. Science. 2004;303:1862–1866. doi: 10.1126/science.1094108. [DOI] [PubMed] [Google Scholar]
- 5.Drechsel DN, Kirschner MW. The minimum GTP cap required to stabilize microtubules. Curr Biol. 1994;4:1053–1061. doi: 10.1016/s0960-9822(00)00243-8. [DOI] [PubMed] [Google Scholar]
- 6.Vandecandelaere A, Brune M, Webb MR, Martin SR, Bayley PM. Phosphate release during microtubule assembly: what stabilizes growing microtubules? Biochemistry. 1999;38:8179–88. doi: 10.1021/bi9830765. [DOI] [PubMed] [Google Scholar]
- 7.Voter WA, O'Brien ET, Erickson HP. Dilution-induced disassembly of microtubules: relation to dynamic instability and the GTP cap. Cell Motil Cytoskeleton. 1991;18:55–62. doi: 10.1002/cm.970180106. [DOI] [PubMed] [Google Scholar]
- 8.Walker RA, O'Brien ET, Pryer NK, Soboeiro MF, Voter WA, Erickson HP, et al. Dynamic instability of individual microtubules analyzed by video light microscopy: rate constants and transition frequencies. J Cell Biol. 1988;107:1437–48. doi: 10.1083/jcb.107.4.1437. [DOI] [PMC free article] [PubMed] [Google Scholar]
- 9.Bayley PM, Schilstra MJ, Martin SR. Microtubule Dynamic Instability - Numerical-Simulation of Microtubule Transition Properties Using A Lateral Cap Model. Journal of Cell Science. 1990;95:33–48. doi: 10.1242/jcs.95.1.33. [DOI] [PubMed] [Google Scholar]
- 10.O'Brien ET, Voter WA, Erickson HP. GTP hydrolysis during microtubule assembly. Biochemistry. 1987;26:4148–4156. doi: 10.1021/bi00387a061. [DOI] [PubMed] [Google Scholar]
- 11.O'Brien ET, Salmon ED, Walker RA, Erickson HP. Effects of magnesium on the dynamic instability of individual microtubules. Biochemistry. 1990;29:6648–6656. doi: 10.1021/bi00480a014. [DOI] [PubMed] [Google Scholar]
- 12.Panda D, Miller HP, Wilson L. Determination of the size and chemical nature of the stabilizing “cap” at microtubule ends using modulators of polymerization dynamics. Biochemistry. 2002;41:1609–1617. doi: 10.1021/bi011767m. [DOI] [PubMed] [Google Scholar]
- 13.Stewart RJ, Farrell KW, Wilson L. Role of GTP hydrolysis in microtubule polymerization: evidence for a coupled hydrolysis mechanism. Biochemistry. 1990;29:6489–6498. doi: 10.1021/bi00479a022. [DOI] [PubMed] [Google Scholar]
- 14.Kerssemakers JW, Munteanu EL, Laan L, Noetzel TL, Janson ME, Dogterom M. Assembly dynamics of microtubules at molecular resolution. Nature. 2006;442:709–712. doi: 10.1038/nature04928. [DOI] [PubMed] [Google Scholar]
- 15.Schek HT, Hunt A. Micorpatterned Structures for Studying the Mechanics of Biological Polymers. Biomedical Microdevices. 2005 doi: 10.1007/s10544-005-6170-z. [DOI] [PubMed] [Google Scholar]
- 16.Allersma MW, Gittes F, deCastro MJ, Stewart RJ, Schmidt CF. Two-dimensional tracking of ncd motility by back focal plane interferometry. Biophys J. 1998;74:1074–85. doi: 10.1016/S0006-3495(98)74031-7. [DOI] [PMC free article] [PubMed] [Google Scholar]
- 17.Brouhard GJ, Schek HT, Hunt AJ. Advanced optical tweezers for the study of cellular and molecular biomechanics. IEEE Transactions on Biomedical Engineering. 2003;50:121–125. doi: 10.1109/TBME.2002.805463. [DOI] [PubMed] [Google Scholar]
- 18.Svoboda K, Schmidt CF, Schnapp BJ, Block SM. Direct Observation of Kinesin Stepping by Optical Trapping Interferometry. Nature. 1993;365:721–727. doi: 10.1038/365721a0. [DOI] [PubMed] [Google Scholar]
- 19.Visscher K, Block SM. Versatile optical traps with feedback control. Methods Enzymol. 1998;298:460–89. doi: 10.1016/s0076-6879(98)98040-5. [DOI] [PubMed] [Google Scholar]
- 20.VanBuren V, Odde DJ, Cassimeris L. Estimates of lateral and longitudinal bond energies within the microtubule lattice. Proc Natl Acad Sci U S A. 2002;99:6035–6040. doi: 10.1073/pnas.092504999. (erratum in 101, p 14989 (2004)) [DOI] [PMC free article] [PubMed] [Google Scholar]
- 21.Hyman AA, Chretien D, Arnal I, Wade RH. Structural-Changes Accompanying Gtp Hydrolysis in Microtubules - Information from A Slowly Hydrolyzable Analog Guanylyl-(Alpha,Beta)-Methylene-Diphosphonate. Journal of Cell Biology. 1995;128:117–125. doi: 10.1083/jcb.128.1.117. [DOI] [PMC free article] [PubMed] [Google Scholar]
- 22.Mandelkow EM, Mandelkow E, Milligan RA. Microtubule dynamics and microtubule caps: a time-resolved cryo-electron microscopy study. J Cell Biol. 1991;114:977–991. doi: 10.1083/jcb.114.5.977. [DOI] [PMC free article] [PubMed] [Google Scholar]
- 23.Melki R, Carlier MF, Pantaloni D, Timasheff SN. Cold Depolymerization of Microtubules to Double Rings - Geometric Stabilization of Assemblies. Biochemistry. 1989;28:9143–9152. doi: 10.1021/bi00449a028. [DOI] [PubMed] [Google Scholar]
- 24.Simon JR, Salmon ED. The structure of microtubule ends during the elongation and shortening phases of dynamic instability examined by negative-stain electron microscopy. J Cell Sci. 1990;96(Pt 4):571–582. doi: 10.1242/jcs.96.4.571. [DOI] [PubMed] [Google Scholar]
- 25.Nogales E. Structural insights into microtubule function. Annu Rev Biochem. 2000;69:277–302. doi: 10.1146/annurev.biochem.69.1.277. [DOI] [PubMed] [Google Scholar]
- 26.Chen YD, Hill TL. Monte Carlo study of the GTP cap in a five-start helix model of a microtubule. Proc Natl Acad Sci U S A. 1985;82:1131–1135. doi: 10.1073/pnas.82.4.1131. [DOI] [PMC free article] [PubMed] [Google Scholar]
- 27.Flyvbjerg H, Holy TE, Leibler S. Stochastic dynamics of microtubules: A model for caps and catastrophes. PHYSICAL REVIEW LETTERS. 1994;73:2372–2375. doi: 10.1103/PhysRevLett.73.2372. [DOI] [PubMed] [Google Scholar]
- 28.Flyvbjerg H, Holy TE, Leibler S. Microtubule dynamics: Caps, catastrophes, and coupled hydrolysis. Physical Review e. 1996;54:5538–5560. doi: 10.1103/physreve.54.5538. [DOI] [PubMed] [Google Scholar]
- 29.Fygenson D, Flyvbjerg H, Sneppen K, Libchaber A, Leibler S. Spontaneous nucleation of microtubules. Physical Review E. 1995;51:5058–5063. doi: 10.1103/physreve.51.5058. [DOI] [PubMed] [Google Scholar]
- 30.Frigon RP, Timasheff SN. Magnesium-induced self-association of calf brain tubulin. II. Thermodynamics. Biochemistry. 1975;14:4567–4573. doi: 10.1021/bi00692a002. [DOI] [PubMed] [Google Scholar]
- 31.Frigon RP, Timasheff SN. Magnesium-induced self-association of calf brain tubulin. I. Stoichiometry. Biochemistry. 1975;14:4559–4566. doi: 10.1021/bi00692a001. [DOI] [PubMed] [Google Scholar]
- 32.Lange G, Mandelkow EM, Jagla A, Mandelkow E. Tubulin oligomers and microtubule oscillations. Antagonistic role of microtubule stabilizers and destabilizers. Eur J Biochem. 1988;178:61–69. doi: 10.1111/j.1432-1033.1988.tb14429.x. [DOI] [PubMed] [Google Scholar]
- 33.Sontag CA, Stafford WF, Correia JJ. A comparison of weight average and direct boundary fitting of sedimentation velocity data for indefinite polymerizing systems. Biophys Chem. 2004;108:215–230. doi: 10.1016/j.bpc.2003.10.029. [DOI] [PubMed] [Google Scholar]
- 34.Gildersleeve RF, Cross AR, Cullen KE, Fagen AP, Williams RC., Jr. Microtubules grow and shorten at intrinsically variable rates. J Biol Chem. 1992;267:7995–8006. [PubMed] [Google Scholar]
- 35.Odde D, Cassimeris L, Buettner HM. Spectral analysis of microtubule assembly dynamics. AIChE Journal. 1996;42:1434–1442. [Google Scholar]
- 36.Pedigo S, Williams RC., Jr. Concentration dependence of variability in growth rates of microtubules. Biophys J. 2002;83:1809–19. doi: 10.1016/S0006-3495(02)73946-5. [DOI] [PMC free article] [PubMed] [Google Scholar]
- 37.Desai A, Mitchison TJ. Microtubule polymerization dynamics. Annual Review of Cell and Developmental Biology. 1997;13:83–117. doi: 10.1146/annurev.cellbio.13.1.83. [DOI] [PubMed] [Google Scholar]
- 38.Cassimeris L. Regulation of Microtubule Dynamic Instability. Cell Motility and the Cytoskeleton. 1993;26:275–281. doi: 10.1002/cm.970260402. [DOI] [PubMed] [Google Scholar]
- 39.Rieder CL, Salmon ED. Motile Kinetochores and Polar Ejection Forces Dictate Chromosome Position on the Vertebrate Mitotic Spindle. Journal of Cell Biology. 1994;124:223–233. doi: 10.1083/jcb.124.3.223. [DOI] [PMC free article] [PubMed] [Google Scholar]
- 40.Tran PT, Marsh L, Doye V, Inoue S, Chang F. A mechanism for nuclear positioning in fission yeast based on microtubule pushing. Journal of Cell Biology. 2001;153:397–411. doi: 10.1083/jcb.153.2.397. [DOI] [PMC free article] [PubMed] [Google Scholar]
- 41.Gordon-Weeks PR. Microtubules and growth cone function. Journal of Neurobiology. 2004;58:70–83. doi: 10.1002/neu.10266. [DOI] [PubMed] [Google Scholar]
- 42.VanBuren V, Cassimeris L, Odde DJ. Mechanochemical model of microtubule structure and self-assembly kinetics. Biophysical Journal. 2005;89:2911–2926. doi: 10.1529/biophysj.105.060913. [DOI] [PMC free article] [PubMed] [Google Scholar]
- 43.Hunt AJ, McIntosh JR. The dynamic behavior of individual microtubules associated with chromosomes in vitro. Molecular Biology of the Cell. 1998;9:2857–2871. doi: 10.1091/mbc.9.10.2857. [DOI] [PMC free article] [PubMed] [Google Scholar]
- 44.Weingarten MD, Suter MM, Littman DR, Kirschner MW. Properties of Depolymerization Products of Microtubules from Mammalian Brain. Biochemistry. 1974;13:5529–5537. doi: 10.1021/bi00724a012. [DOI] [PubMed] [Google Scholar]
- 45.Derry WB, Wilson L, Jordan MA. Substoichiometric Binding of Taxol Suppresses Microtubule Dynamics. Biochemistry. 1995;34:2203–2211. doi: 10.1021/bi00007a014. [DOI] [PubMed] [Google Scholar]
- 46.Caplow M, Shanks J, Ruhlen RL. Temperature-Jump Studies of Microtubule Dynamic Instability. Journal of Biological Chemistry. 1988;263:10344–10352. [PubMed] [Google Scholar]
- 47.Gittes F, Schmidt CF. Signals and noise in micromechanical measurements. Methods in Cell Biology. 1998;55:129–56. doi: 10.1016/s0091-679x(08)60406-9. [DOI] [PubMed] [Google Scholar]
Associated Data
This section collects any data citations, data availability statements, or supplementary materials included in this article.