Abstract
Aims
To establish the sensitivity and reliability of objective image analysis in direct comparison with subjective grading of bulbar hyperaemia.
Methods
Images of the same eyes were captured with a range of bulbar hyperaemia caused by vasodilation. The progression was recorded and 45 images extracted. The images were objectively analysed on 14 occasions using previously validated edge‐detection and colour‐extraction techniques. They were also graded by 14 eye‐care practitioners (ECPs) and 14 non‐clinicians (NCLs) using the Efron scale. Six ECPs repeated the grading on three separate occasions
Results
Subjective grading was only able to differentiate images with differences in grade of 0.70–1.03 Efron units (sensitivity of 0.30–0.53), compared to 0.02–0.09 Efron units with objective techniques (sensitivity of 0.94–0.99). Significant differences were found between ECPs and individual repeats were also inconsistent (p<0.001). Objective analysis was 16× more reliable than subjective analysis. The NCLs used wider ranges of the scale but were more variable than ECPs, implying that training may have an effect on grading.
Conclusions
Objective analysis may offer a new gold standard in anterior ocular examination, and should be developed further as a clinical research tool to allow more highly powered analysis, and to enhance the clinical monitoring of anterior eye disease.
Assessment of conjunctival hyperaemia is a vital part of any ophthalmic evaluation. The onset of hyperaemia can indicate not only ocular but also certain systemic conditions1,2,3 and hence it is vital that the subtle variations in this surface are evaluated and monitored by clinicians as accurately as possible. The current best practice for such assessment is in the form of subjective grading scales that were introduced to reduce inconsistencies between examiners and to encourage uniform grading of the anterior eye.4,5,6 The level on the scale (commonly 4–5 predetermined images) that best matches the characteristic of the eye under observation is recorded, ideally to 1dp to improve discrimination.7 However, these scales remain (by their nature) subjective and lead to inherently variable assessments, with a wide range of the scale utilised by different practitioners to describe the same image.5,8 Practitioners also demonstrate a reluctance to interpolate between the grading images displayed, even if training has been undertaken.9 This is compounded by the design of the scales themselves which are not linear in nature, instead having increased sensitivity at the lower end, although this is not always consistent.8
To improve this situation various studies have investigated computer‐based objective grading of ocular surfaces. With respect to vascular changes, several parameters have been the focus of objective analysis software.10,11 Edge detection and colour extraction have been shown to be the most repeatable and discriminatory of those techniques, and have been found to be approximately 7× more reliable than that reported for subjective grading,11 however, no direct comparisons have been established.
A quantifiable method of determining the sensitivity and reliability of objective image analysis in direct comparison with subjective grading is needed, the results of which will indicate whether objective methods could be used to enhance the clinical quantification and monitoring of anterior eye disease.
Methods
To assess the relative difference between objective and subjective grading, a series of increasingly hyperaemic images of the same eye were required. Pharmaceutical vasodilation of conjunctival and scleral blood vessels had the potential to allow a relatively linear increase in bulbar hyperaemia over time.12 Informed consent was received after explanation of the study which had been approved by the institutional ethics committee and conformed to the tenets of the Declaration of Helsinki.
Image grading
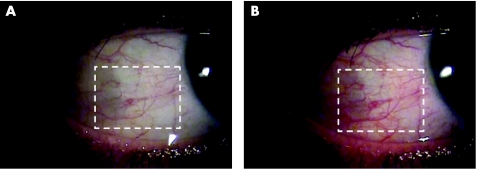
Vasodilation was initiated by instillation of two drops of 0.5% dapiprazole hydrochloride (a topical adrenergic antagonist with pupillary miosis and vasodilating action; Rev‐Eyes, Bausch & Lomb, Rochester, USA) in the right eyes of three subjects (mean age 28 years, SD 4.4 years, 2 female). The subjects' right temporal conjunctiva was viewed through Takagi SM‐70 slit‐lamp biomicroscope (Nagano‐Ken, Japan) at 10 times magnification with diffuse illumination at 35°. The instillation and subsequent vasodilation was captured by a JAI camera (CV‐53200, Yokohama, Japan) on DV media‐tape (resolution 800 000 pixels at 25 Hz). Blink‐rate was regulated every 10 seconds using a digital metronome. For each of the three videos 45 high‐quality JPEG images were extracted at 2‐second intervals after instillation of the vasodilator (avoiding frames with blinks) covering the main period of vasodilation (fig 1).
Figure 1 Images of one eye (A) prior to, and (B) 2 minutes after vasodilator instillation. The rectangular region marked indicates the area of conjunctiva measured by the objective program.
Objective analysis
The 45 images for each of the three eyes were analysed by purpose‐designed and previously validated software11 (LabView, National‐Instruments, Austin, Texas, USA) which used edge detection (ED) with a 3×3 kernal, and relative colour extraction of the red plane (RCE)11 in a rectangular area covering the visible conjunctiva (300×250 pixels, equivalent to an area of 6.82×5.68 mm. This area was chosen as the largest sample of the conjunctiva possible to measure within the limits of the palpebral apertures). Measurements were repeated 14 times (to correspond with the number of clinicians recruited for subjective assessment) by the same clinician on the same occasion for each of the 135 images.
Subjective analysis
A 15‐inch cathode ray tube monitor (CTX Ultra‐screen, California, USA) was used to display the images which had been inserted (in a random order) into a PowerPoint presentation. The presentation provided a vehicle for efficient access and demonstration of the images without loss of image quality. One image from each eye was duplicated within the presentation. Fourteen ECPs (fully‐qualified optometrists, with a minimum 4 years clinical experience and regular grading scale users); aged 31.0 (SD 6.7) years and 14 non‐clinicians (NCLs) aged 33.4 (SD 13.3) years were recruited. All subjects were instructed to grade each slide in comparison to the Efron scale (Millennium edition) to 1dp.13 They were not permitted to return to previous slides in order to make comparisons. The task of allocating a grade to an image using the scale was demonstrated to the NCLs who graded a single trial slide to confirm their full comprehension. Six ECPs repeated this grading on two further occasions, each separated by 2 days.9 Separately, 50 ECPs graded the first and last of the 45 images of the vasodilating eyes (using an Efron grading scale) to determine the overall difference in hyperaemia created.
Results
Sensitivity
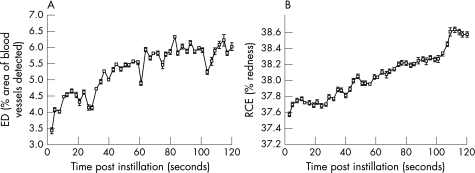
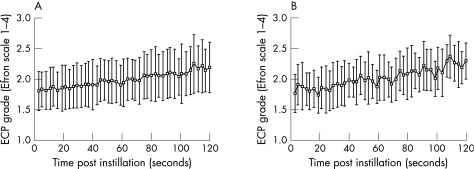
Sensitivity is defined by Altman and Bland14 as the proportion of true positives that are correctly identified by the test. A repeated measures AVOVA showed significant differences over the duration of vasodilation for each of the two objective image analysis techniques and subjective ECP and NCL grading (p<0.001; table 1, figs 2 and 3). Tukey's post‐hoc test was used to determine the number of images within the 45 graded for each eye that were differentiated as significantly different from the next. The average change in Efron grade between the first and last images was 0.69 (SD 0.32) Efron units. Therefore the sensitivity of the two objective techniques, ECPs and NCLs, was calculated by this grade difference, divided by the number of significant grading differences between the first and last image (table 1).
Table 1 Analysis of variance between the graded images, the determined sensitivity over one Efron grade (ie, RCE is able to detect a change of 0.09 Efron units in bulbar hyperaemia reliably), and sensitivity index (where 1.00 indicates maximum sensitivity and 0.00 the inability to differentiate changes in bulbar hyperaemia), for ED and RCE objective image analysis techniques and subjective ECP and NCL grading.
| Grading technique | F | p | Sensitivity (per Efron grade unit) | Sensitivity index |
|---|---|---|---|---|
| ED | 1306.91 | 0.00 | 0.02 | 0.99 |
| RCE | 1368.54 | 0.00 | 0.09 | 0.94 |
| ECP | 10.88 | 0.00 | 1.03 | 0.30 |
| NCL | 17.52 | 0.00 | 0.68 | 0.53 |
ECP, eye‐care practitioner; ED, edge detection; NCL, non‐clinician; RCE, relative colour extraction.
Figure 2 Mean grades for three eyes given from (A) edge detection (ED) and (B) relative colour extraction (RCE) image analysis for n = 45 successive images of increasing hyperaemia. Error bars = 1 SD of three inter‐subject analyses.
Figure 3 Mean grades for three eyes from (A) eye‐care practitioners (ECPs) and (B) non‐clinicians (NCLs) assessed against the Efron grading scale. n = 14 in each group, error bars = 1 SD.
Reliability
Inter‐subject reliability between the 14 objective and 14 subjective measures was found by the intra‐class correlation coefficient (rI).15 This showed ED and RCE image analysis to be almost optimally reliable (rI = 0.97 and 0.98, respectively), but indicated poor reliability for ECP and NCLs (rI = 0.06 and 0.22, respectively). Intra‐subject reliability was also determined for the six ECPs who graded the images on three separate occasions with the coefficient of reliability (COR) found to be 0.30. The 14 ECPs and 14 NCLs graded two identical images for each eye with CORs of 0.35 and 0.23, respectively.
Discussion
The purpose of this study was to determine if objective image analysis of bulbar hyperaemia was more sensitive and reliable than professional ECP or NCL subjective grading.
Subjective grading was only able to differentiate images with a difference in grade of 0.7–1.0 Efron units. However, image analysis techniques were much more sensitive and were able to differentiate images every 0.02–0.09 of an Efron scale grade, making it up to 50 times more sensitive than optometrists and also 16 times more reliable. The range of hyperaemia assessed covered approximately 53% of the scale and fell within the apparently more sensitive (lower) grading range of the Efron scale.8 However, further studies are required to confirm these findings in more severely hyperaemic eyes. Interestingly, NCLs used a wider range of the scale, but were more variable than ECPs, suggesting that experience and/or teaching does have some effect on grading, contrary to some previous studies.9
Some deviation from the presumed incrementally increasing nature of the pharmacologically induced conjunctival vessel dilation is implied from the objective results (shown by unpredicted troughs in fig 2). However, the overall pattern is linear (ED: r2 = 0.67; RCE: r2 = 0.94). It is possible that the pulse‐cycle may have caused small variations in the hyperaemia characteristics detected. In support of this theory, fast Fourier transform analysis of digital images from a non‐vasodilated eye were conducted over a 10‐minute period, recorded with the same instrumentation at 25 Hz, and revealed a peak at the temporal frequency of the pulse (62.3 beats per minute, SD 0.2) for both ED and RCE techniques. Another contributing factor that could offer an explanation for deviation in vessel dilation is the physical effect of the blink on conjunctival vasculature. As the eyelids twitch or close, their attachment to the conjunctiva compresses the conjunctival vessels in the area of interest, while the scleral vessels remain relatively constant.
This study has assessed bulbar hyperaemia only, however, subjective grading scales also display other features such as palpebral hyperaemia, or corneal and palpebral staining with fluorescein. Previous findings indicate that these scales are also non‐linear and would be likely to have similar levels of subjective insensitivity and unreliability.8,16,17 Although these surfaces have not been assessed by this form of objective analysis it is fair to suggest that similar improvements in sensitivity and reliability could be achieved.
In conclusion, objective image analysis of the anterior eye is confirmed as being substantially more sensitive and reliable than subjective grading. It may therefore offer a new gold standard in anterior ocular examination and could be developed further as a tool for use in research, to allow more highly powered analysis without bias, and in clinical practice to enhance the monitoring of anterior eye disease.
Abbreviations
COR - coefficient of reliability
ECPs - eye‐care practitioners
ED - edge detection
NCLs - non‐clinicians
RCE - relative colour extraction
Footnotes
Competing interests: None.
References
- 1.Klaassen‐Broekema N, van Bijsterveld O P. Diffuse and focal hyperaemia of the outer eye in patients with chronic renal failure. Int Ophthalmol 199317249–254. [DOI] [PubMed] [Google Scholar]
- 2.Owen C G, Fitzke F W, Woodward E G. A new computer assisted objective method for quantifying vascular changes of the bulbar conjunctivae. Ophthal Physiol Optics 199616430–437. [PubMed] [Google Scholar]
- 3.Cheung A T, Ramanujam S, Greer D A.et al Microvascular abnormalities in the bulbar conjunctiva of patients with type 2 diabetes mellitus. Endocr Pract 20017358–363. [DOI] [PubMed] [Google Scholar]
- 4.Efron N. Grading scales for contact lens complications. Ophthal Physiol Optics 199818182–186. [DOI] [PubMed] [Google Scholar]
- 5.Fieguth P, Simpson T. Automated measurement of bulbar redness. Invest Ophthalmol Vis Sci 200243340–347. [PubMed] [Google Scholar]
- 6.Efron N, Morgan P B, Katsara S S. Validation of grading scales for contact lens complications. Ophthal Physiol Optics 20012117–29. [PubMed] [Google Scholar]
- 7.Bailey I L, Bullimore M A, Raasch T W.et al Clinical grading and the effects of scaling. Invest Ophthalmol Vis Sci 199132422–432. [PubMed] [Google Scholar]
- 8.Wolffsohn J S. Incremental nature of anterior eye grading scales determined by objective image analysis. Br J Ophthalmol 2004881434–1438. [DOI] [PMC free article] [PubMed] [Google Scholar]
- 9.Efron N, Morgan P B, Jagpal R. The combined influence of knowledge, training and experience when grading contact lens complications. Ophthal Physiol Optics 20032379–85. [DOI] [PubMed] [Google Scholar]
- 10.Papas E B. Key factors in the subjective and objective assessment of conjunctival erythema. Invest Ophthalmol Vis Sci 200041687–691. [PubMed] [Google Scholar]
- 11.Wolffsohn J S, Purslow C. Clinical monitoring of ocular physiology using digital image analysis. Contact Lens Ant Eye 20032627–35. [DOI] [PubMed] [Google Scholar]
- 12.Willingham F F, Cohen K L, Coggins J M.et al Automatic quantitative measurement of ocular hyperaemia. Curr Eye Res 1995141101–1108. [DOI] [PubMed] [Google Scholar]
- 13.Efron N.Grading scales for contact lens complications. Millennium edition. Farnborough: Hydron, 2000
- 14.Altman D G, Bland J M. Diagnostic tests 1: sensitivity and specificity. Br Med J 19943081552. [DOI] [PMC free article] [PubMed] [Google Scholar]
- 15.Bland J M, Altman D G. Measurement error and correlation coefficients. Br Med J 199631341–42. [DOI] [PMC free article] [PubMed] [Google Scholar]
- 16.MacKinven J, McGuinness C L, Pascal E.et al Clinical grading of the upper palpebral conjunctiva of non‐contact lens wearers. Optom Vis Sci 20017813–18. [DOI] [PubMed] [Google Scholar]
- 17.Pritchard N, Young G, Coleman S.et al Subjective and objective measures of corneal staining related to multipurpose care systems. Contact Lens and Anterior Eye 2003263–9. [DOI] [PubMed] [Google Scholar]


