

Abstract
Aim
To determine the potential influence of genetic factors on the prevalence of myopia in Tehran.
Methods
Of 6497 citizens of Tehran sampled from 160 clusters using stratified random cluster sampling, 4565 (70.3%) participated in the study and were referred to a clinic for an extensive eye examination and interview. These were from 1259 nuclear families with the average size of 3.6. Refraction data obtained from 3321 participants aged 16 years and over are presented. Three definitions of myopia, as the spherical equivalent of −0.5, −1, and −2 diopters or less, were used. Familial aggregation of myopia was evaluated with odds ratios and recurrence risk ratios (λR) using a multiple logistic regression with generalised estimating equations (GEE), adjusted for age, sex, height, and education.
Results
Multivariate analyses showed a strong familial aggregation of myopia among siblings (λR ranging from 2.09 to 3.86) and parent–offspring pairs (λR from 1.82 to 3.81) adjusted for age, sex, height, and education. The aggregation increased with higher myopia thresholds and with the use of cycloplegic refraction. The odds ratios for spouse pairs were not significantly different from 1.0. The association of myopia with sex, height, and education (and not age) remained significant in the final GEE2 model.
Conclusions
The findings indicate a relatively high degree of familial aggregation of myopia in the Tehran population, independent of age, sex, height, and education. This residual aggregation may be a result of heredity or of an unmeasured common environmental effect.
Keywords: familial myopia, myopia, refractive error, recurrence risk
Several pieces of evidence have convincingly established the importance of genetic factors in the aetiology of myopia, and most studies agree that sibling correlations are stronger than those for parent–offspring comparisons.1,2,3,4 Twin studies have shown a very high heritability for myopia,5,6,7 but there is little consensus on the exact inheritance pattern.8,9,10,11,12,13,14,15 Despite these data, environmental influences cannot be overlooked.16,17,18,19,20,21,22,23,24,25
While several reports, including various linkage studies, have addressed the genetics of high myopia, there is relatively little information on the role of genetics in low and moderate myopia.26
Recurrence risk ratios are helpful, both for determining the degree of familial aggregation of diseases and for estimating the power of genetic molecular studies,27 provided that the potential effect of the familial aggregation of environmental risk factors is taken into account and ascertainment bias and overreporting are avoided.28 Most studies have focused on the sibling recurrence risk ratio (λs).29 However, measuring familial aggregation among other family members can be helpful in determining possible mechanisms of familial disease patterns.30
In Iran, the prevalence of myopia is about 22% in the general population.31 Little is known about the familial aggregation of myopia in the Iranian population. Our aim in this study was to determine the potential influence of genetic and environmental factors on the prevalence of myopia among the Tehran eye study population above the age of 15, using different thresholds for defining myopia. This age group was selected because it would yield a relatively homogeneous sample with stable refraction. Logistic regression models, using generalised estimating equations (GEE), were used to allow for familial correlation of myopia and its risk factors in calculating the recurrence risks.
Methods
The Tehran eye study is a population based cross sectional study. Detailed descriptions of the methodology have already been published32,33 and are summarised here. The sampling strategy followed a stratified cluster sampling procedure with proportional allocation within strata. The survey target population comprised non‐institutionalised urban citizens of all ages residing in Tehran city in 2002 (only those above 15 were used for analysis in this report). The sample stratification was done according to the 22 municipal districts of Tehran city, proportional to the number of households. In all, 160 clusters were randomly selected, based on block enumeration of the national census of 1996 by the Statistical Centre of Iran. A team consisting of two interviewers described the project to each household, and invited all household members for a complete eye examination at Noor Vision Correction Centre.
Refraction was measured for all participants using a Topcon automated refractometer (Topcon KR 8000, Topcon Corporation, Tokyo, Japan). Results from autorefraction were used as a starting point for full subjective and manifest refraction. When autorefraction was not possible (especially if there was media opacity), manual manifest and subjective refraction was attempted. If the ophthalmologist found no contraindication, cycloplegic refraction was done. In this case, one drop of cyclopentolate (1%) was instilled 30 and 25 minutes before refraction. The participants were informed about the symptoms resulting from cyclopentolate use.
All observers received regular quality control visits from the project manager. In addition, interobserver comparison of refraction measurements in 538 eyes during the study showed that the intraclass correlation coefficient of reliability was 0.98 (95% confidence interval (CI), 0.97 to 0.99) for manifest spherical equivalent refraction.
The study followed the tenets of the declaration of Helsinki. The research and ethics committee of the Noor Vision Correction Centre and the ethics committee of the National Research Centre for Medical Sciences approved the study. All participants were informed about the project and the procedures in their native language before being enrolled. The participant's agreement for examination was obtained verbally.
Statistical methods
Myopia was defined as the spherical equivalent of −0.5 diopters (D) or less. We further used two other myopia thresholds (−1 D and −2 D) to investigate the familial aggregation in higher levels of myopia. As the spherical equivalents in the right and left eyes were highly correlated (Pearson's correlation, r = 0.84, p<0.001) we present the data for right eyes only.
In calculating standard errors and 95% confidence intervals, the cluster sampling design was taken into account.34 The age and sex distributions of participants were different from the city's general population in that people over 40 years of age and women were overrepresented. For this reason, rates were directly age and sex standardised to the 1996 Tehran population using data from the Iranian Statistics Centre.35
For analysis of familial aggregation, the method described by Liang and Beaty36 was used. In this method, the odds ratios estimated between family members are independent of family size. The following notation applies:
Let J be the number of families included in the analysis. For a single family of size nj (j = 1, …, J) we denote with yij the binary outcome (0–1) of the ith individual in family j. The odds ratio between the ith and the kth family member in the jth family is:
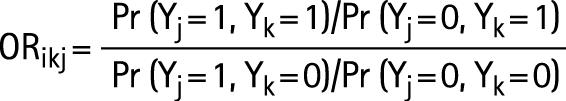 |
For statistical modelling we estimated the log odds ratio within an appropriate regression model. Three different myopia thresholds (−0.5, −1.0, and −2.0 D) were used in the model. A second order generalised estimating equation (GEE2) was used for adjustments to odds ratios for environmental risk factors, which simultaneously models the risk of a person having myopia and the familial associations. The estimation of the parameters has been discussed in detail by Liang and Zeger,37 and Liang et al.38 Only full siblings and their parents were included in the analysis. The risk factors used in the models were age, sex, height, and education.
Recurrence risk ratios, defined as the risk of being affected given an affected family member relative to the risk in the population, were calculated using odds ratios from the GEE2 model,26 as follows:
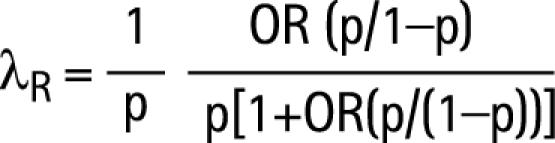 |
where p is the estimated population prevalence of myopia. For each threshold used in the GEE2 model, the corresponding prevalence in our data was used for estimation of λR.
Results
Between August and December 2002, 4565 of the 6497 eligible individuals in the sample completed the interview and the ophthalmic examination (a participation rate of 70.3%). These were from 1259 nuclear families with an average size of 3.6 individuals. Of the 4565 participants, 3321 were above 15 years of age. Data are presented only for these. The study sample consisted of 1298 men (39.1%) and 2023 women (60.9%) between 16 and 96 years of age, with a mean (SD) age of 37.8 (16.2) years.
Manifest refraction data were not obtained for 81, leaving 3240 right eyes available for analysis. Of the 81 people excluded, 44 (54.3%) had a previous history of cataract, refractive surgery, and media opacities in their right eyes. Refraction was not carried out in the others (37; 45.7%) because of poor cooperation or refusal. Forty six participants had contraindications to cycloplegic refraction and 540 others refused to have it. Cycloplegic refraction was done in the remaining 2735 participants.
Table 1 presents the age and sex specific prevalence of myopia, using the −0.5 cut off. Overall, the prevalence of myopia was 26.2% based on manifest refraction and 20.5% based on cycloplegic refraction. Myopia was significantly related to age (p<0.001): its prevalence decreased significantly with increasing age (both sexes combined) from the 16–25 to the 36–45 year age groups, and then remained almost steady.
Table 1 Prevalence of myopia defined as −0.5 D or less, by sex and age, based on manifest and cycloplegic refraction*.
| Subjects and age groups (years) | Manifest refraction | Cycloplegic refraction | ||
|---|---|---|---|---|
| No | Per cent (95% CI) | No | Per cent (95% CI) | |
| Men | ||||
| 16–25 | 354 | 28.2 (23.1 to 33.3) | 284 | 21.6 (16.8 to 26.5) |
| 26–35 | 236 | 29.7 (22.7 to 36.8) | 184 | 19.0 (12.3 to 25.6) |
| 36–45 | 237 | 21.5 (16.5 to 26.6) | 172 | 18.0 (12.5 to 23.5) |
| 46–55 | 190 | 19.1 (13.6 to 24.6) | 166 | 15.5 (10.2 to 20.8) |
| 56+ | 242 | 20.7 (15.8 to 25.6) | 215 | 20.2 (15.1 to 25.2) |
| Women | ||||
| 16–25 | 620 | 30.4 (26.5 to 34.3) | 536 | 23.3 (19.7 to 27.1) |
| 26–35 | 402 | 27.5 (23.2 to 32.0) | 333 | 19.5 (14.9 to 24.1) |
| 36–45 | 406 | 24.0 (19.6 to 28.4) | 354 | 20.0 (15.5 to 24.5) |
| 46–55 | 336 | 27.1 (22.8 to 31.3) | 298 | 24.5 (20.0 to 28.9) |
| 56+ | 216 | 25.7 (19.8 to 31.7) | 193 | 23.2 (16.7 to 29.6) |
| Men and women | ||||
| 16–25 | 974 | 29.3 (26.0 to 32.7) | 820 | 22.5 (19.2 to 25.9) |
| 26–35 | 639 | 28.7 (24.4 to 33.1) | 517 | 19.2 (14.9 to 23.5) |
| 36–45 | 643 | 22.7 (19.5 to 26.0) | 526 | 19.1 (15.7 to 22.4) |
| 46–55 | 526 | 23.2 (19.7 to 26.6) | 464 | 20.1 (16.8 to 23.5) |
| 56+ | 458 | 23.0 (19.3 to 26.7) | 408 | 22.5 (17.6 to 25.5) |
| All ages | ||||
| Men | 1260 | 25.1 (22.2 to 28.0) | 1021 | 19.3 (16.5 to 22.1) |
| Women | 1980 | 27.4 (25.2 to 29.6) | 1714 | 21.8 (19.4 to 24.2) |
| All | 3240 | 26.2 (24.4 to 28.0) | 2735 | 20.5 (18.6 to 22.4) |
*Age and sex standardised to the 1996 Tehran population.
CI, confidence interval.
A significant association between myopia and educational level was found (table 2): myopia was found to be more prevalent among individuals with higher educational levels. Comparing the different ethnic groups in this study, we found that the prevalence of myopia was not significantly affected by ethnicity (data not shown).
Table 2 Prevalence of myopia defined as −0.5 D or less based on manifest refraction, by education level*.
| No | Per cent (95% CI) | |
|---|---|---|
| Illiterate | 264 | 18.5 (15.0 to 22.0) |
| Primary school | 345 | 20.1 (14.8 to 25.4) |
| High school not completed | 846 | 21.3 (18.7 to 23.9) |
| High school diploma | 1078 | 23.5 (20.7 to 26.3) |
| College or graduate school | 685 | 34.0 (29.5 to 38.5) |
*Age and sex standardised to the 1996 Tehran population.
CI, confidence interval.
The associations of myopia between family members using GEE2 and adjusted for age, sex, education, and height are presented in table 3. The details of these associations are presented by odds ratios and recurrence risk ratios (λR) among different family pairs. The analyses yielded odds ratios of 3.42 (manifest) and 4.35 (cycloplegic) for the association of myopia (defined as −0.5 D or less) among siblings, which correspond to recurrence risk ratios of 2.09 and 2.58, respectively. Among parent–offspring pairs, using the same definition of myopia, odds ratios of 2.56 (λR = 1.82) for manifest myopia and 2.80 (λR = 2.05) for cycloplegic myopia were observed. The odds ratios and recurrence risk ratios increased with higher myopia thresholds in both family relation types. Cycloplegic myopia also showed a higher degree of familial aggregation; thus the highest odds ratios were seen for myopia defined as cycloplegic refraction below −2 D (5.31 for sibling–sibling pairs, and 5.21 for parent–offspring pairs (λR = 3.86 and 3.81, respectively)). The sibling–sibling odds ratios were higher than the parent–offspring odds ratios in all models, but the differences were less pronounced for cycloplegic refraction. The odds ratios for spouse pairs were not significantly different from 1.0.
Table 3 Familial relations of myopia in multivariable regression using GEE2 method for different definitions of myopia.
| Manifest refraction | Cycloplegic refraction | |||
|---|---|---|---|---|
| Adjusted OR* (CI 95%) | λR | Adjusted OR (CI 95%) | λR | |
| Myopia ⩽−0.5 D | ||||
| Sibling–sibling | 3.42 (1.99 to 5.81) | 2.09 | 4.35 (1.97 to 9.58) | 2.58 |
| Parent–offspring | 2.56 (1.88 to 3.49) | 1.82 | 2.80 (1.88 to 4.22) | 2.05 |
| Spouse | 0.79 (0.51 to 1.22) | 0.84 | 0.68 (0.38 to 1.23) | 0.73 |
| Myopia ⩽−1 D | ||||
| Sibling–sibling | 3.93 (2.16 to 7.10) | 2.67 | 3.25 (1.75 to 5.99) | 2.46 |
| Parent–offspring | 3.03 (2.09 to 4.35) | 2.26 | 3.22 (2.09 to 4.95) | 2.45 |
| Spouse | 0.99 (0.57 to 1.75) | 0.99 | 1.19 (0.59 to 2.34) | 1.15 |
| Myopia ⩽−2 D | ||||
| Sibling–sibling | 4.39 (2.20 to 8.76) | 3.32 | 5.31 (2.43 to 11.59) | 3.86 |
| Parent–offspring | 3.53 (2.18 to 5.75) | 2.84 | 5.21 (3.03 to 9.03) | 3.81 |
| Spouse | 0.87 (0.35 to 2.18) | 0.88 | 1.02 (0.35 to 3.03) | 1.02 |
*All models were adjusted for age, sex, years of education, and height as possible confounding variables (data not shown).
CI, confidence interval; GEE2, second order generalised estimating equations; OR, odds ratio.
In the multivariable analyses, the association of myopia with sex, height, and education (and not age) remained significant in the final GEE2 model (data not shown).
Discussion
In this study, siblings and offspring of a myopic person had, on average, a three to five times greater chance of being myopic than people without such a myopic relative. However, spouses of a myopic individual were not at significantly increased risk.
In a reanalysis of available data from Danish and American studies, Guggenheim and colleagues29 estimated the sibling recurrence risk ratio (λs) to be 20 for high myopia and 1.5 for low myopia. These two figures came from two different populations and were generated using backward analysis of published reports. In another study, Farbrother et al27 showed a λs of 4.5 for high myopia in a sample of English families. In that study, refractive errors were not measured directly and instead, age at onset of myopia was used as an estimator. The above studies were dependent on probands for sampling families, leading to an overestimation of familial aggregation from ascertainment bias.39 Lack of adjustment for other myopia risk factors may also have given rise to high estimates of familial aggregation because of a shared environment. Lee et al3 found odds ratios of 2.82 to 4.25 for myopia less than −0.5 D among sibling pairs from the Beaver Dam population (mean age 61.5 years). Wojciechowski and colleagues,26 as part of a population based study, reported λs for different thresholds of low to moderate myopia in an elderly population (mean age 73.4 years) using a GEE2 model. The recurrence risk ratios in this study ranged between 1.90 and 2.52 depending on the definition used for myopia. The studies in elderly populations might underestimate the effect of heredity in favour of stronger environmental influence associated with aging.26 We showed higher estimates of recurrence risk and odds ratios in the present study, and a more marked increase in higher cut off points for myopia. While the genetic mechanisms of high myopia are now better understood, our results add to the evidence that both low to moderate and high myopia are part of a spectrum that is at least partly determined by complex genetic influences.3,6,26,40
Most previous studies have only reported the recurrence risk of myopia among siblings. The familial aggregation found in this study was greater among siblings than between parents and offspring. Similarly, the familial occurrence of myopia has been noted by several investigators to be greatest between siblings and less between parents and offspring.2,3,4 This suggests that shared environmental factors could be important in the aggregation of myopia.29 There may also be a cohort effect, caused by an increased amount of close up work activity in younger generations.9 This is supported by the observation of increased myopia prevalence in the younger age groups.41 Findings from the Framingham Offspring Eye Study Group also showed that myopia was less aggregated in siblings with a larger age difference.42 Like many others, we showed a strong association between education and the prevalence of myopia.4,19,20 However, it remains unclear whether educational level is an independent risk factor or a surrogate for close up work or some other socioeconomic characteristic.20,21 The amount of near work seems to have increased in recent years, even at the same educational level.9
Although the results of cycloplegic refraction were consistent with those of manifest refraction, the degree of the observed aggregation was higher with cycloplegic refraction. This was not due to decreased prevalence, as such a decrease can only influence recurrence risk ratios and not odds ratios. It has been shown that manifest and subjective refraction tend to show more negative results than cycloplegic refraction,43,44 which is supported by the lower prevalence of cycloplegic versus manifest myopia in our study. Thus, by reducing the number of false positive results and the resultant non‐differential misclassification, cycloplegic refraction can lead to less biased odds ratio estimates which are further from the null.45
The relations between refractive error and height or weight are unconvincing, although eye size may be linked to body stature.25 In our data, height had a significant effect in the model, but it did not affect the odds ratios from familial aggregation. No association was found between myopia and ethnicity in these data, which might reflect the lack of sufficient ethnic heterogeneity in our population.
GEE models are used increasingly to analyse correlated data (such as family studies), especially when they are binary or in the form of counts.46 The use of the extended form of this method (GEE2) made it possible to account for multiple within‐family associations and various family sizes while adjusting for environmental determinants of myopia.36 On the other hand, some other risk factors for myopia—such as near work, night lighting, intelligence, socioeconomic status, and nutrition—were not studied in this population.23
The genetics of myopia are complex and it is rarely possible to find families showing a clear cut monofactorial (Mendelian) inheritance pattern. While extremes of refractive error, such as high myopia, are more likely to have a simple mode of inheritance, refractive error occurs as a continuum across the population and seems likely to be multifactorial in origin, with a complex mode of inheritance. Segregation analysis studies by Klein et al9 and Ashton47 suggest that the trait may be multifactorial, and analyses in our population could help to clarify the mode of inheritance in this population.
Our findings indicate a relatively high degree of familial aggregation, independent of age, sex, height, and education, in the Tehran population. This residual aggregation may be the result of heredity or the effect of undetermined common environmental factors.
Acknowledgements
This project was funded in part by the Noor Vision Correction Centre and a grant from the Iranian National Research Centre for Medical Sciences, and in part by the intramural programme of the National Human Genome Research Institute, National Institutes of Health, USA.
Abbreviations
GEE - generalised estimating equations
GEE2 - second order generalised estimating equations
Footnotes
Competing interests: None declared.
References
- 1.Goldschmidt E. The mystery of myopia. Acta Ophthalmol Scand 200381431–436. [DOI] [PubMed] [Google Scholar]
- 2.Saw S M, Katz J, Schein O D.et al Epidemiology of myopia. Epidemiol Rev 199618175–187. [DOI] [PubMed] [Google Scholar]
- 3.Lee K E, Klein B E, Klein R.et al Aggregation of refractive error and 5‐year changes in refractive error among families in the Beaver Dam Eye Study. Arch Ophthalmol 20011191679–1685. [DOI] [PubMed] [Google Scholar]
- 4.Rose K A, Morgan I G, Smith W.et al High heritability of myopia does not preclude rapid changes in prevalence. Clin Exp Ophthalmol 200230168–172. [DOI] [PubMed] [Google Scholar]
- 5.Hammond C J, Andrew T, Mak Y T.et al A susceptibility locus for myopia in the normal population is linked to the PAX6 gene region on chromosome 11: a genomewide scan of dizygotic twins. Am J Hum Genet 200475294–304. [DOI] [PMC free article] [PubMed] [Google Scholar]
- 6.Hammond C J, Snieder H, Gilbert C E.et al Genes and environment in refractive error: the twin eye study. Invest Ophthalmol Vis Sci 2001421232–1236. [PubMed] [Google Scholar]
- 7.Lyhne N, Sjolie A K, Kyvik K O.et al The importance of genes and environment for ocular refraction and its determiners: a population based study among 20–45 year old twins. Br J Ophthalmol 2001851470–1476. [DOI] [PMC free article] [PubMed] [Google Scholar]
- 8.Wissinger B, Kohl S, Langenbeck U. Genetics in ophthalmology. Dev Ophthalmol 20033734–49.12876828 [Google Scholar]
- 9.Klein A P, Duggal P, Lee K E.et al Support for polygenic influences on ocular refractive error. Invest Ophthalmol Vis Sci 200546442–446. [DOI] [PubMed] [Google Scholar]
- 10.Young T L, Ronan S M, Drahozal L A.et al Evidence that a locus for familial high myopia maps to chromosome 18p. Am J Hum Genet 199863109–119. [DOI] [PMC free article] [PubMed] [Google Scholar]
- 11.Young T L, Ronan S M, Alvear A B.et al A second locus for familial high myopia maps to chromosome 12q. Am J Hum Genet 1998631419–1424. [DOI] [PMC free article] [PubMed] [Google Scholar]
- 12.Naiglin L, Gazagne C, Dallongeville F.et al A genome wide scan for familial high myopia suggests a novel locus on chromosome 7q36. J Med Genet 200239118–124. [DOI] [PMC free article] [PubMed] [Google Scholar]
- 13.Paluru P, Ronan S M, Heon E.et al New locus for autosomal dominant high myopia maps to the long arm of chromosome 17. Invest Ophthalmol Vis Sci 2003441830–1836. [DOI] [PubMed] [Google Scholar]
- 14.Edwards M, Lewis W H. Autosomal recessive inheritance of myopia in Hong Kong Chinese infants. Ophthalmic Physiol Opt 199111227–231. [PubMed] [Google Scholar]
- 15.Schwartz M, Haim M, Skarsholm D. X‐linked myopia: Bornholm eye disease: linkage to DNA markers on the distal part of Xq. Clin Genet 199038281–286. [PubMed] [Google Scholar]
- 16.Saw S M. A synopsis of the prevalence rates and environmental risk factors for myopia. Clin Exp Optom 200386289–294. [DOI] [PubMed] [Google Scholar]
- 17.Wu H M, Seet B, Yap E P.et al Does education explain ethnic differences in myopia prevalence? A population‐based study of young adult males in Singapore. Optom Vis Sci 200178234–239. [DOI] [PubMed] [Google Scholar]
- 18.Rosner M, Belkin M. Intelligence, education, and myopia in males. Arch Ophthalmol 19871051508–1511. [DOI] [PubMed] [Google Scholar]
- 19.Saw S M, Wu H M, Seet B.et al Academic achievement, close up work parameters, and myopia in Singapore military conscripts. Br J Ophthalmol 200185855–860. [DOI] [PMC free article] [PubMed] [Google Scholar]
- 20.Teikari J M. Myopia and stature. Acta Ophthalmol (Copenh) 198765673–676. [DOI] [PubMed] [Google Scholar]
- 21.Shimizu N, Nomura H, Ando F.et al Refractive errors and factors associated with myopia in an adult Japanese population. Jpn J Ophthalmol 2003476–12. [DOI] [PubMed] [Google Scholar]
- 22.Attebo K, Ivers R Q, Mitchell P. Refractive errors in an older population: the Blue Mountains Eye Study. Ophthalmology 19991061066–1072. [DOI] [PubMed] [Google Scholar]
- 23.Wong T Y, Foster P J, Johnson G J.et al The relationship between ocular dimensions and refraction with adult stature: the Tanjong Pagar Survey. Invest Ophthalmol Vis Sci 2001421237–1242. [PubMed] [Google Scholar]
- 24.McBrien N A, Adams D W. A longitudinal investigation of adult‐onset and adult progression of myopia in an occupational group. Invest Ophthalmol Vis Sci 199738321–333. [PubMed] [Google Scholar]
- 25.Simensen B, Thorud L O. Adult‐onset myopia and occupation. Acta Ophthalmol (Copenh) 199472469–471. [DOI] [PubMed] [Google Scholar]
- 26.Wojciechowski R, Congdon N, Bowie H.et al Heritability of refractive error and familial aggregation of myopia in an elderly American population. Invest Ophthalmol Vis Sci 2005461588–1592. [DOI] [PMC free article] [PubMed] [Google Scholar]
- 27.Farbrother J E, Kirov G, Owen M J.et al Family aggregation of high myopia: estimation of the sibling recurrence risk ratio. Invest Ophthalmol Vis Sci 2004452873–2878. [DOI] [PubMed] [Google Scholar]
- 28.Guo S W. Familial aggregation of environmental risk factors and familial aggregation of disease. Am J Epidemiol 20001511121–1131. [DOI] [PubMed] [Google Scholar]
- 29.Guggenheim J A, Kirov G, Hodson S A. The heritability of high myopia: a reanalysis of Goldschmidt's data. J Med Genet 200037227–231. [DOI] [PMC free article] [PubMed] [Google Scholar]
- 30.Liang K Y, Beaty T H. Statistical designs for familial aggregation. Stat Methods Med Res 20009543–562. [DOI] [PubMed] [Google Scholar]
- 31.Hashemi H, Fotouhi A, Mohammad K. The age‐ and gender‐specific prevalences of refractive errors in Tehran: the Tehran Eye Study. Ophthalmic Epidemiol 200411213–225. [DOI] [PubMed] [Google Scholar]
- 32.Hashemi H, Fotouhi A, Mohammad K. Tehran Eye Study: research design and eye examination protocol. BMC Ophthalmology 200338. [DOI] [PMC free article] [PubMed] [Google Scholar]
- 33.Fotouhi A, Hashemi H, Mohammad K. The prevalence and causes of visual impairment in Tehran: the Tehran Eye Study. Br J Ophthalmol 200488740–745. [DOI] [PMC free article] [PubMed] [Google Scholar]
- 34.Bennett S, Woods T, Liyanage W M.et al A simplified method for cluster sample surveys of health in developing countries. World Health Stat Q 19914498–106. [PubMed] [Google Scholar]
- 35.Iranian Statistics Centre The report of the 1996 population census. http://amar.sci.or.ir (10 March 2003)
- 36.Liang K Y, Beaty T H. Measuring familial aggregation by using odds‐ratio regression models. Genet Epidemiol 19918361–370. [DOI] [PubMed] [Google Scholar]
- 37.Liang K Y, Zeger S L. Longitudinal data analysis using generalized linear models. Biometrika 19867313–22. [Google Scholar]
- 38.Liang K Y, Zeger S L, Qaqish B F. Multivariate regression analyses for categorical data. J R Stat Soc 1992543–40. [Google Scholar]
- 39.Khoury M J, Beaty T H, Cohen B H.Fundamentals of genetic epidemiology. New York: Oxford University Press, 1993238–242.
- 40.Alsbirk P H. Refraction in adult West Greenland Eskimos: a population study of spherical refractive errors, including oculometric and familial correlations. Acta Ophthalmol (Copenh) 19795784–95. [DOI] [PubMed] [Google Scholar]
- 41.Rose K, Smith W, Morgan I.et al The increasing prevalence of myopia: implications for Australia. Clin Experiment Ophthalmol 200129116–120. [DOI] [PubMed] [Google Scholar]
- 42.The Framingham Offspring Eye Study Group Familial aggregation and prevalence of myopia in the Framingham Offspring Eye Study. Arch Ophthalmol 1996114326–332. [DOI] [PubMed] [Google Scholar]
- 43.Choong Y F, Chen A H, Goh P P. A comparison of autorefraction and subjective refraction with and without cycloplegia in primary school children. Am J Ophthalmol 200614268–74. [DOI] [PubMed] [Google Scholar]
- 44.Zhao J, Mao J, Luo R.et al Accuracy of noncycloplegic autorefraction in school‐age children in China. Optom Vis Sci 20048149–55. [DOI] [PubMed] [Google Scholar]
- 45.Szklo M, Nieto F J.Epidemiology: beyond the basics, 2nd edition. Sudbury, MA: Jones and Bartlett 2007121–133.
- 46.Hanley J A, Negassa A, Edwardes M D.et al Statistical analysis of correlated data using generalized estimating equations: an orientation. Am J Epidemiol 2003157364–375. [DOI] [PubMed] [Google Scholar]
- 47.Ashton G. Segregation analysis of ocular refraction and myopia. Hum Hered 198535232–239. [DOI] [PubMed] [Google Scholar]