Abstract
Background/aim
Preattentive visual search (PAVS) describes rapid and efficient retinal and neural processing capable of immediate target detection in the visual field. Damage to the nerve fibre layer or visual pathway might reduce the efficiency with which the visual system performs such analysis. The purpose of this study was to test the hypothesis that patients with glaucoma are impaired on parallel search tasks, and that this would serve to distinguish glaucoma in early cases.
Methods
Three groups of observers (glaucoma patients, suspect and normal individuals) were examined, using computer‐generated flicker, orientation, and vertical motion displacement targets to assess PAVS efficiency. The task required rapid and accurate localisation of a singularity embedded in a field of 119 homogeneous distractors on either the left or right‐hand side of a computer monitor. All subjects also completed a choice reaction time (CRT) task.
Results
Independent sample T tests revealed PAVS efficiency to be significantly impaired in the glaucoma group compared with both normal and suspect individuals. Performance was impaired in all types of glaucoma tested. Analysis between normal and suspect individuals revealed a significant difference only for motion displacement response times. Similar analysis using a PAVS/CRT index confirmed the glaucoma findings but also showed statistically significant differences between suspect and normal individuals across all target types.
Conclusions
A test of PAVS efficiency appears capable of differentiating early glaucoma from both normal and suspect cases. Analysis incorporating a PAVS/CRT index enhances the diagnostic capacity to differentiate normal from suspect cases.
Preattentive vision describes the ability of the visual system to extract basic features from a visual scene in parallel, i.e. parallel processing will prioritise feature differences within the scene; these will pop‐out instantaneously from the background and attract attention.1,2,3 Several studies have shown that the search for a target pattern among homogenous distractor patterns is fast and parallel once this target differs significantly from its background in some basic stimulus dimension such as orientation, flicker, or motion among others.4,5,6,7 A preattentively detected stimulus appears to “pop‐out”7 and this allows very rapid detection of a target among a field of distractors before a saccadic eye movement can be made.
Preattentive vision is a global visual function that can perform a simple analysis of image content simultaneously across an entire image, compared with foveal processing, which provides a spotlight on only a limited portion of the visual field at any moment in time. Consequently, it is a reasonable assumption that preattentive vision is dependent on neural mechanisms being intact across the retina. If this is the case, a suitably configured preattentive visual search (PAVS) test might be able to detect any condition that produces damage across a significant area of the visual field or to the neural hardware subserving vision. If pop‐out does not occur, for example because glaucoma is present, the search will become dependent on foveal mechanisms whose small spatial coverage requires a serial search strategy with each part of an extended image being examined in turn, and response times will increase accordingly.
Glaucoma remains an enigmatic condition, frustratingly elusive in the earliest stages, often progressing despite apparently “successful” therapeutic intervention. Traditional diagnostic techniques are limited to the extent that the earliest losses of glaucoma remain difficult to detect.8,9 By impacting on the peripheral visual field rather than central vision, glaucoma should have an early detrimental impact on PAVS and therefore represents a good basis for a potential diagnostic test.
Given the apparently non‐selective nature10 of retinal ganglion cell death in glaucoma (magnocellular11,12 and parvocellular13,14 deficits occur), it would seem desirable to evaluate the functional integrity of different cell types during the course of a single examination to optimise sensitivity to the earliest losses in glaucoma. Preattentive vision operates across a range of stimulus attributes including colour, movement and flicker so that selective tests can be devised for these pathways.
A test of preattentive vision is inherently different from conventional psychophysical techniques. Such techniques characteristically rely on the presentation of single targets in isolated areas of the visual field. Preattentive vision requires retinal and neural integration of the combined responses of neighbouring and overlapping receptive fields of retinal ganglion cells. Other studies have confirmed that other population‐response tests such as motion coherence15 and pattern‐discrimination perimetry 13,16,17,18 are possibly more sensitive than achromatic perimetry.
Several studies have recently looked at potential applications of PAVS to the detection and diagnosis of clinical conditions, including glaucoma,19 Parkinson's disease20 and dementia.21 In the former case, the authors reported that PAVS tests successfully discriminated between patients with and without glaucoma. The intention here is to determine if those results could be substantiated and to evaluate PAVS in suspect cases without established conventional field loss.
Materials and methods
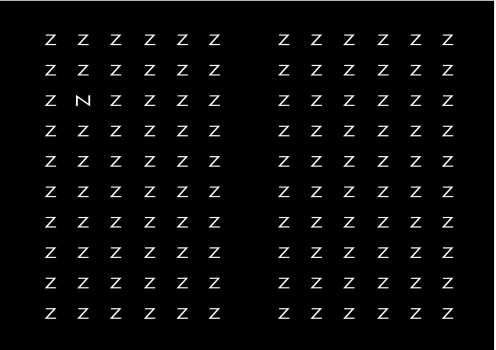
The software used to present and control the experiment was adapted from that devised by Flitcroft et al.19 Figure 1 shows a diagrammatic representation of the target and 119 distractors as presented for the orientation test. The visual search test was presented on a 19‐inch Iiyama colour monitor (Vision Master 450, model S901GT) with 640 × 480 resolution at 80 Hz refresh rate and a dot pitch of 0.26 mm. The test area subtended 33.8° horizontally and 25.8° vertically at a fixation distance of 50 cm. Targets were white with mean luminance of 132 cd/m2; mean background luminance was 2 cd/m2 giving a Michelson contrast ratio of 0.97.
Figure 1 Orientation test target N surrounded by 119 distractors Z (representing a 90 degree orientation shift). The subject was instructed to fixate a central fixation cross that appeared centrally between each presentation.
A two‐alternative forced choice paradigm was adopted, with subjects required to locate accurately the feature pop‐out as quickly as possible on the left or right side of the screen using two handheld buttons, while observing a central fixation cross. Subjects were allowed 20 practice presentations on each of the three targets. Subjects were asked to complete the task as quickly as possible without sacrificing accuracy. One eye was occluded for the duration of the test. Error responses (pressing the wrong button) were ignored in the calculation of the mean response time. To ensure that fast‐guessing was not a significant factor in the reaction time interpretation, subjects achieving less than 90% accuracy were excluded from the studies. PAVS response times were measured using a timer incorporated in the software. More detailed descriptions of the apparatus, stimuli and subject tasks have previously been described elsewhere.22
All subjects were required to have a minimum visual acuity of 6/12, no significant media opacity, no other known ocular or systemic disease, an open anterior chamber angle and a Humphrey visual field assessment performed within the past six months. Full ethics approval was granted by the Dublin Institute of Technology Ethics Committee and informed, written consent was obtained from each subject. Subjects were classified into one of three groups using strict entry criteria (see table 1).
Table 1 Subject classification criteria.
| Glaucoma | Glaucoma suspect | Normal individual |
|---|---|---|
| N = 41 | N = 41 | N = 41 |
| Mean age 67 years | Mean age 62 years | Mean age 64 years |
| Range 49–83 | Range 44–83 | Range 49–83 |
| Characteristic ONH/RNFL damage | Suspicious ONH/RNFL structure | Normal ONH/RNFL structure |
| Characteristic, repeatable, early glaucomatous VF loss (abnormal GHT and/or CPSD <5%, and/or cluster criteria defect | No repeatable characteristic VF loss | Normal VF sensitivity |
| Classified based on IOP and gonioscopy findings | Normal IOP | |
| CD ratio <0.7 |
CD ratio, cup disc ratio; CPSD, corrected pattern standard deviation; GHT, Glaucoma Hemifield Test; IOP, intraocular pressure; ONH, optic nerve head; RNFL, retinal nerve fibre layer; VF, visual field.
A total of 123 subjects was examined, 41 in each category. After the practice session, the subject began the test proper, first for flicker, followed by displacement and finally for orientation, through their near optical prescription if any. Each test consisted of 40 presentations of each target type.
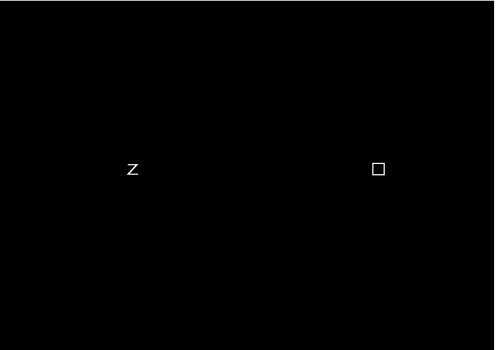
Subjects subsequently performed a choice reaction time (CRT) test (fig 2) that required the subject to discriminate the target from a non‐target and indicate its relative location on the right or left side of the screen to test for any non‐glaucomatous motor/neural deficiencies that could complicate interpretation of the results. The use of a reaction time paradigm instead of a thresholding strategy has significant benefits with regard to task simplicity and speed. It does, however, leave interpretation of data based solely on a subject's speed of response open to misdiagnosis if a subject's response time was artificially increased as a result of non‐visual functional defects. The CRT test requires a subject to indicate the location of a specific target with only one distractor. As such it represents a quite primitive search task. By its very nature, preattentive search times should not increase significantly above the CRT regardless of the number of distractors. The CRT therefore gives an indication as to the approximate PAVS time a subject should achieve given normal preattentive processing skills. Dividing the PAVS time by the CRT produces a perceptual search index (PSI) that is independent of the potential variation with age in the sensory, attentional and motor factors that contribute to the subject's PAVS reaction time.
Figure 2 The choice reaction time test required the subject to indicate the location of the empty box (using two handheld buttons) on the left or right side of the screen as quickly as possible after stimulus onset after a variable time delay.
Results
Glaucoma versus suspect versus normal individuals
A two‐tailed independent samples T test was used to compare the mean response times for each target type across the three groups.
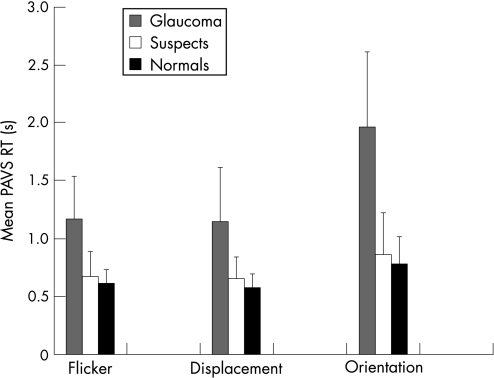
Figure 3 illustrates a number of significant findings. There is an apparent loss of search efficiency among suspects particularly in the glaucoma group compared with the normal group for each preattentive task. The elevation is most apparent for the orientation task.
Figure 3 Mean preattentive visual search response times (plus standard deviation error bars) for normal, suspect and glaucoma subjects for flicker, displacement and orientation targets. PAVS RT, Preattentive visual search response time.
Table 2 outlines the independent samples T test analysis, revealing a statistically significant difference between glaucoma subjects and both normal and suspect individuals across all PAVS targets, and interestingly also for the CRT. Differences between suspect and normal cases are non‐significant for the flicker and orientation task, but statistically significant for the displacement task. No differences were detected in CRT means between normal and suspect individuals.
Table 2 Two‐tailed independent samples T test for equality of preattentive visual search and choice reaction time mean response times across normal, suspect and glaucoma subjects.
| Flicker | Displacement | Orientation | CRT | |
|---|---|---|---|---|
| Glaucoma vs suspect | T = 7.432 | T = 6.251 | T = 9.336 | T = 3.783 |
| p<0.001 | p<0.001 | p<0.001 | p<0.001 | |
| dF = 63.822 | dF = 80 | dF = 63.258 | dF = 80 | |
| Glaucoma vs normal | T = 9.157 | T = 7.535 | T = 10.963 | T = 2.352 |
| p<0.001 | p<0.001 | p<0.001 | p = 0.021 | |
| dF = 51.011 | dF = 46.251 | dF = 50.395 | dF = 80 | |
| Suspect vs normal | T = 1.758 | T = 2.183 | T = 1.393 | T = −0.953 |
| p = 0.083 | p = 0.032 | p = 0.168 | p = 0.343 | |
| dF = 68.798 | dF = 71.038 | dF = 68.196 | dF = 80 |
CRT, choice reaction time; dF, degrees of freedom.
Given the possibility of psychomotor reaction time effects in an elderly subject group, and the observed statistically significant difference between the CRT for glaucoma and both suspect and normal individuals, it was appropriate to examine the effects of any processing differences in the statistical analysis. As such a new index was formed comprising the result of the PAVS time divided by the CRT for each subject, which we have termed the ‘perceptual search index'.
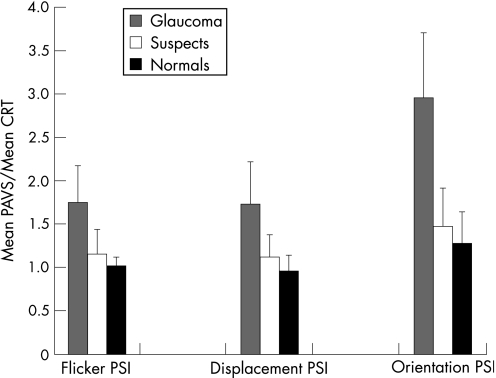
Simple inspection of the group means of the PSI in fig 4 again highlights a similar performance effect between the groups, with the glaucoma group mean substantially increased compared with the other groups.
Figure 4 Preattentive visual search efficiency as a function of choice reaction time – mean perceptual search index (plus standard deviation error bars) among normal, suspect and glaucoma subjects. CRT, Choice reaction time; PAVS, preattentive visual search response time; PSI, perceptual search index.
Independent sample T test analysis confirms the statistically significant performance impairment in the glaucoma group compared with both normal and suspect individuals. More interestingly, however, this index appears to differentiate between the normal and suspect groups on the basis of a statistically significant difference (p<0.05) between the respective PSI scores across all target types (table 3).
Table 3 Two‐tailed independent samples T test for equality of perceptual search index means across normal, suspect and glaucoma subjects.
| Flicker PSI | Displacement PSI | Orientation PSI | |
|---|---|---|---|
| Glaucoma vs suspect | T = 7.566 | T = 7.155 | T = 10.785 |
| p<0.001 | p<0.001 | p<0.001 | |
| dF = 69.38 | dF = 61.749 | dF = 64.623 | |
| Glaucoma vs normal | T = 10.960 | T = 9.956 | T = 13.685 |
| p<0.001 | p<0.001 | p<0.001 | |
| dF = 45.816 | dF = 46.523 | dF = 45.967 | |
| Suspect vs normal | T = 3.193 | T = 3.599 | T = 2.600 |
| p = 0.002 | p = 0.001 | p = 0.012 | |
| dF = 53.001 | dF = 60.624 | dF = 56.640 |
dF, degrees of freedom; PSI, perceptual search index.
Primary open angle glaucoma versus low‐tension glaucoma versus pseudoexfoliative glaucoma
The glaucoma group was divided into three subgroups on the basis of the IOP level at the time of diagnosis and on the status of the anterior chamber drainage angle into either primary open angle glaucoma (POAG) 22 subjects, low‐tension glaucoma (LTG) 11 subjects, or pseudoexfoliative glaucoma (PXF) 8 subjects. POAG subjects were defined on the basis of an IOP greater than or equal to 22 mm Hg and the absence of any pseudoexfoliative material in the chamber angle on gonioscopic evaluation. LTG subjects were similarly defined but with an IOP below 22 mm Hg at the time of diagnosis. The presence of pseudoexfoliative material impeding aqueous outflow as determined on gonioscopic evaluation of the chamber angle facilitated categorisation of the PXF group. The data within the glaucoma group were reanalysed to determine any possible effect of glaucoma type on PAVS efficiency.
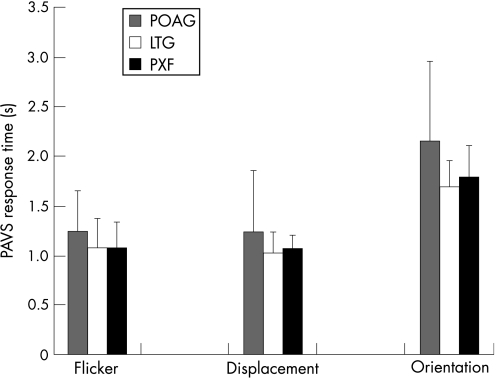
Figure 5 shows the primary open angle group to have slightly greater mean PAVS times compared with pseudoexfoliation and LTG for each task (whose search efficiency appears similar in all cases).
Figure 5 Relationship between glaucoma subtype and preattentive visual search efficiency (plus standard deviation error bars) for flicker, displacement and orientation targets. LTG, Low‐tension glaucoma; PAVS, preattentive visual search response time; POAG, primary open angle glaucoma; PXF, pseudoexfoliative glaucoma.
Table 4 charts independent samples T test results. This reveals no difference in PAVS efficiency between any of the glaucoma subtypes tested. Similarly, no differences were detected in CRT means between any of the glaucoma subtypes. Even so, given the results obtained in the Glaucoma versus suspects versus normals section when the PSI data were computed, it seemed appropriate to assess for similar effects here.
Table 4 Two‐tailed independent samples T test for equality of preattentive visual search and choice reaction time mean response times across glaucoma subtypes.
| Flicker | Displacement | Orientation | CRT | |
|---|---|---|---|---|
| POAG vs LTG | T = 1.110 | T = 1.113 | T = 1.844 | T = 0.167 |
| p = 0.276 | p = 0.274 | p = 0.075 | p = 0.868 | |
| dF = 31 | dF = 31 | dF = 28.791 | dF = 31 | |
| POAG vs PXF | T = 1.012 | T = 0.803 | T = 1.243 | T = 1.696 |
| p = 0.320 | p = 0.429 | p = 0.085 | p = 0.101 | |
| dF = 28 | dF = 28 | dF = 27.631 | dF = 28 | |
| LTG vs PXF | T = 0.026 | T = −0.410 | T = −0.706 | T = 2.096 |
| p = 0.980 | p = 0.687 | p = 0.490 | p = 0.051 | |
| dF = 17 | dF = 17 | dF = 17 | dF = 17 |
CRT, choice reaction time; dF, degrees of freedom; LTG, low‐tension glaucoma; POAG, primary open angle glaucoma; PSI, perceptual search index; PXF, pseudoexfoliative glaucoma.
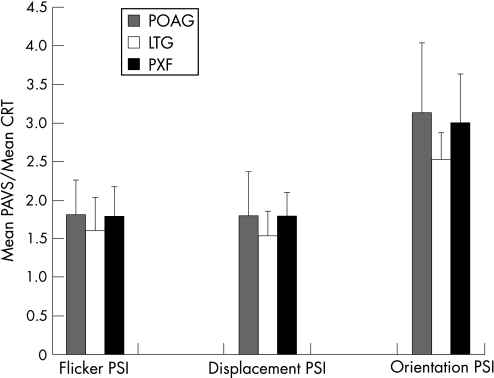
Figure 6 shows an interesting PSI variation from the basic PAVS data above. The LTG PSI means are consistently lower than the pseudoexfoliation and POAG groups, which are remarkably similar. The effect is largest for the orientation task.
Figure 6 Preattentive visual search efficiency as a function of choice reaction time – mean perceptual search index (plus standard deviation error bars) across glaucoma subtypes. CRT, Choice reaction time; LTG, low‐tension glaucoma; PAVS, preattentive visual search response time; POAG, primary open angle glaucoma; PSI, perceptual search index; PXF, pseudoexfoliative glaucoma.
The independent samples T test confirms similar performance effects between the primary open angle and pseudoexfoliation groups across all tasks. Again there are no significant differences between LTG and both other groups for the flicker and displacement tasks. The orientation task, however, shows a statistically significant difference between LTG and both other glaucoma subtypes (table 5).
Table 5 Two‐tailed independent samples T test for equality of perceptual search index means, across glaucoma subtypes.
| Flicker PSI | Displacement PSI | Orientation PSI | |
|---|---|---|---|
| POAG vs LTG | T = 1.237 | T = 1.407 | T = 2.218 |
| p = 0.225 | p = 0.170 | p = 0.034 | |
| dF = 31 | dF = 31 | dF = 29.987 | |
| POAG vs PXF | T = 0.085 | T = 0.056 | T = 0.397 |
| p = 0.933 | p = 0.956 | p = 0.694 | |
| dF = 28 | dF = 28 | dF = 28 | |
| LTG vs PXF | T = −0.974 | T = −1.696 | T = −2.171 |
| p = 0.344 | p = 0.108 | p = 0.044 | |
| dF = 17 | dF = 17 | dF = 17 |
dF, degrees of freedom; LTG, low‐tension glaucoma; POAG, primary open angle glaucoma; PSI, perceptual search index; PXF, pseudoexfoliative glaucoma.
Discussion
The nature of the various target/distractor design combinations is such as to create a test with the potential to preferentially stimulate and assess the integrity of different ganglion cell populations within a single examination.
The temporal characteristics of the flicker and motion displacement targets used here were designed to stimulate the transient, faster conducting magnocellular pathway. The high spatial frequency, stationary orientation target/distractor combination was designed to be preferentially coded by the sustained parvocellular pathway.23,24
It is therefore unsurprising that the orientation task employed here has consistently greater PAVS response times compared with the flicker and motion targets across all subject groups including normal controls. This may reflect a difference in the processing speed of the two pathways involved, a fundamental difference in the processing capacity of the two pathways, a difference in the capacity for attentional capture of a stationary versus a motion/flicker singularity (moving targets may be visually more important from an evolutionary perspective), or possibly nothing more than a basic difference in the task complexity.
All three targets appear to have the capacity to differentiate glaucoma from non‐glaucoma on the basis of preattentive search efficiency. Our results confirm those of a previous study19 that patients with established early glaucoma have impaired parallel search capabilities when compared with either age‐matched normal subjects or glaucoma suspects without established visual field loss. The degree of impairment was highly statistically significant for each target type.
Physical limitations, sensory degradations25 or attentional/neural losses with normal aging or in neurodegenerative diseases26,27 are known to impact upon cognitive performance and could conceivably cause impaired search times in the absence of any true loss of preattentive vision. The CRT was thus used to determine an alternative, more robust performance index (PSI), presumed to be free of any such potential artefactual defects.
The PSI analysis confirms the loss of search efficiency in the glaucoma group to be statistically significant. The finding that the suspect group PSI data are significantly different from the normal group data is of particular interest. The magnitude of the effect is obviously lower than that observed in the glaucoma group, perhaps reflecting the fact that neural loss is more advanced in the glaucoma group. The PSI mean is on average 15–17% higher for suspect individuals compared with normal controls depending on the target type, and between 76% (flicker) and 230% (orientation) higher for glaucoma above normal. Although the current results are not sufficient to say that the test is capable of defining those patients classified as suspects most likely to develop glaucomatous field loss, they are, however, encouraging enough to suggest that a longitudinal analysis of such patients might be worthwhile to determine whether those with the largest PSI values are those who will progress. A test that can determine those most at risk of developing glaucoma is of obvious merit.
Although the end result is always ganglion cell death, the pattern of damage and timeframe for cell death in glaucoma may vary and may therefore have different effects on preattentive performance at different stages. Analysis of PAVS efficiency among glaucoma subtypes, however, does not reveal any significant differences in performance between the three glaucoma groups. The observed PSI difference for LTG compared with both POAG and PXF for the orientation target, however, poses some interesting questions. Search remains marginally less affected in LTG than the other two groups. Does this suggest a relative preservation of parallel mechanisms in the pathogenesis of LTG compared with high‐tension cases? Is this preservation limited to or more significant in the parvocellular pathway? One might thus hypothesise that smaller diameter parvocellular fibres are less susceptible to vascular insufficiency, whereas the compressive effects of higher IOP are less selective for pathway at this stage of glaucoma. Such a hypothesis remains to be tested.
Whereas the test does not appear to clarify issues relating to the pathophysiology of the subtypes of glaucoma, the results here indicate that the test's ability to detect glaucomatous damage does not depend on the type of glaucoma. This may prove beneficial in the context of screening for glaucoma.
The importance of early detection to glaucoma management and visual prognosis is well known.28 Evidence of selective damage to large ganglion cells in glaucoma, 29,30 psychophysical losses of M cell function12 and observations of reduced axonal flow to the magnocellular layers of the lateral geniculate body31 have led to attempts to develop tests that isolate the magnocellular pathway.
Retinal sampling has become central to the development of novel tests of retinal function in glaucoma. Cells that have sparse representation may yield the earliest detectable losses of visual function.10 The insensitivity of conventional perimetric stimuli probably reflects the non‐selective nature of the achromatic stimuli used, and the significant degree of overlap of ganglion cell receptive fields in all retinal locations masks early functional losses.
The current test, which incorporates stimuli capable of testing both pathways to varying degrees, may provide a useful alternative screening technique for the rapid clinical evaluation of visual functional status in those at risk of glaucoma.
The use of a response time here, rather than a threshold experimental paradigm, also simplifies the nature of the PAVS test. This has potential advantages if the test is to be applied to patients with a limited span of attention, including elderly patients among whom most types of glaucoma are most prevalent.32,33 It is also a very rapid test taking as little as one minute per eye to perform a complete assessment using all three targets on a normal individual (under three minutes in glaucoma patients). The current test remains resistant to the potentially confounding effects of optical blur, with the exception of the high spatial frequency orientation target that is resistant to approximately 1 D of optical defocus.22 Such a rapid means of assessment, simplicity of task34 and resistance to optical blur have obvious merit for the development of a clinically viable test for glaucoma.
Acknowledgements
The authors wish to thank James Callis (School of Physics, Dublin Institute of Technology) who contributed to the software re‐development.
Abbreviations
CRT - choice reaction time
IOP - intraocular pressure
LTG - low‐tension glaucoma
PAVS - preattentive visual search
POAG - primary open angle glaucoma
PSI - perceptual search index
PXF - pseudoexfoliative glaucoma
Footnotes
Funding: This study was partly supported by a research grant from Irish Fight for Sight.
Competing interests: None.
References
- 1.Wolfe J M. “Effortless” texture segmentation and “parallel” visual search are not the same thing. Vis Res 199232757–763. [DOI] [PubMed] [Google Scholar]
- 2.Hoffman J E. A two stage model of visual search. Percept Psychophys 197925319–327. [DOI] [PubMed] [Google Scholar]
- 3.Treisman A, Gelade G. A feature‐integration theory of attention. Cogn Psychol 19801297–136. [DOI] [PubMed] [Google Scholar]
- 4.Nakayama K, Silverman G H. Serial and parallel processing of visual feature conjunctions. Nature 1986320264–265. [DOI] [PubMed] [Google Scholar]
- 5.Nothdurft H ‐ C. Texture segmentation and pop‐out from orientation contrast. Vis Res 1991311073–1078. [DOI] [PubMed] [Google Scholar]
- 6.Nothdurft H ‐ C. The role of features in preattentive vision: comparison of orientation, motion and color cues. Vis Res 1993331937–1958. [DOI] [PubMed] [Google Scholar]
- 7.Saarinen J. Localization and discrimination of “pop‐out” targets. Vis Res 199636313–316. [DOI] [PubMed] [Google Scholar]
- 8.Quigley H A, Addicks E M, Green W R. Optic nerve damage in human glaucoma: III. Quantitative correlation of nerve fiber loss and visual field defect in glaucoma, ischemic neuropathy, disc edema and toxic neuropathy. Arch Ophthalmol 1982100135–146. [DOI] [PubMed] [Google Scholar]
- 9.Foster P J, Buhrmann R, Quigley H A.et al The definition and classification of glaucoma in prevalence surveys. Br J Ophthalmol 200286238–242. [DOI] [PMC free article] [PubMed] [Google Scholar]
- 10.Johnson C A. Selective versus nonselective losses in glaucoma. J Glauc 19943(suppl)S32–S44. [PubMed] [Google Scholar]
- 11.Quigley H A. Are some ganglion cells killed by glaucoma before others? In: Kriegelstein GK, ed. Glaucoma update III. Berlin: Springer‐Verlag, 198723–26.
- 12.Anderson R S, O'Brien C. Psychophysical evidence for a selective loss of M ganglion cells in glaucoma. Vis Res 1997371079–1083. [DOI] [PubMed] [Google Scholar]
- 13.Drum B, Severns M, O'Leary D.et al Selective loss of pattern discrimination in early glaucoma. Appl Opt 1989281135–1144. [DOI] [PubMed] [Google Scholar]
- 14.Johnson C A, Adams A J, Casson E J.et al Blue‐on‐yellow perimetry can predict the development of glaucomatous visual field loss. Arch Ophthalmol 1993111645–650. [DOI] [PubMed] [Google Scholar]
- 15.Silverman S E, Trick G L, Hart W M. Motion perception is abnormal in primary open angle glaucoma and ocular hypertension. Invest Ophthalmol Vis Sci 199031722–729. [PubMed] [Google Scholar]
- 16.Drum B, Severns M, O'Leary D.et al Pattern discrimination and light detection test different types of glaucomatous damage. In: Heijl A, ed. Perimetry update 1988/1989. Amsterdam: Kugler & Ghedini, 1989341–347.
- 17.Nutaitis M J, Stewart W C, Kelly D M.et al Pattern discrimination perimetry in patients with glaucoma and ocular hypertension. Am J Ophthalmol 1992114297–301. [DOI] [PubMed] [Google Scholar]
- 18.Chauhan B C, LeBlanc R P, McCormick T A.et al Comparison of high‐pass resolution and pattern discrimination perimetry to conventional perimetry in glaucoma. Can J Ophthalmol 199328306–311. [PubMed] [Google Scholar]
- 19.Flitcroft D I, Doyle A, Eustace P.et al A new psychophysical approach in glaucoma detection: preattentive vision testing [abstract]. Invest Ophthalmol Vis Sci 199637S510 [Google Scholar]
- 20.Troscianko T, Calvert J. Impaired parallel visual search mechanisms in Parkinson's disease – implications for the role of dopamine in visual attention. Clin Vis Sci 19938281–287. [Google Scholar]
- 21.Cormack F, Gray A, Ballard C.et al A failure of ‘pop‐out' in visual search tasks in dementia with Lewy bodies as compared to Alzheimer's and Parkinson's disease. Int J Geriatr Psych 200419763–772. [DOI] [PubMed] [Google Scholar]
- 22.Davison P, Loughman J. Effects of retinal image degradation on pre‐attentive visual search (PAVS) efficiency for flicker, movement and orientation stimuli. Ophthal Physiol Opt 200626456–463. [DOI] [PubMed] [Google Scholar]
- 23.Lennie P, Trevarthen C, Van Essen D.et al Parallel processing of visual information. In: Spillman L, Werner JS, eds. Visual perception: the neurophysiological foundations. Orlando: Academic Press, 1990103–129.
- 24.Derrington A M, Lennie P. Spatial and temporal contrast sensitivities of neurones in lateral geniculate nucleus of macaque. J Physiol 1984357219–240. [DOI] [PMC free article] [PubMed] [Google Scholar]
- 25.Scialfa C. Adult age differences in visual search: the role of non‐attentional processes. In: Enns JT, ed. The development of attention: research and theory. North Holland: Elsevier Science Publishers BV, 1990509–526.
- 26.Ballard C, O'Brien J, Gray A.et al Attention and fluctuating attention in patients with dementia with Lewy bodies and Alzheimer's disease. Arch Neurol 200158977–982. [DOI] [PubMed] [Google Scholar]
- 27.Pache M, Flammer J. A sick eye in a sick body? Systemic findings in patients with primary open‐angle glaucoma. Surv Ophthalmol 200651179–212. [DOI] [PubMed] [Google Scholar]
- 28.Tezel G, Siegmund K D, Trinkaus K. Clinical factors associated with progression of glaucomatous optic disc damage in treated patients. Arch Ophthalmol 2001199813–818. [DOI] [PubMed] [Google Scholar]
- 29.Quigley H A, Sanchez R M, Dunkelberger G R. Chronic glaucoma selectively damages large optic nerve fibers. Invest Ophthalmol Vis Sci 198728913–920. [PubMed] [Google Scholar]
- 30.Glovinsky Y, Quigley H A, Dunkelberger G R. Retinal ganglion cell loss is size dependent in experimental glaucoma. Invest Ophthalmol Vis Sci 199132484–491. [PubMed] [Google Scholar]
- 31.Dandona L, Hendrickson A, Quigley H A. Selective effects of experimental glaucoma on axonal transport by retinal ganglion cells to the dorsal lateral geniculate nucleus. Invest Ophthalmol Vis Sci 1991321593–1599. [PubMed] [Google Scholar]
- 32.Tielsch J M, Katz J, Singh K. A population‐based evaluation of glaucoma screening: the Baltimore Eye Survey. Am J Epidemiol 19911341102–1110. [DOI] [PubMed] [Google Scholar]
- 33.Klein B E, Klein R, Sponsel W E. Prevalence of glaucoma. The Beaver Dam Eye Study. Ophthalmology 1992991499–1504. [DOI] [PubMed] [Google Scholar]
- 34.Ahissar M, Hochstein S. Learning pop‐out detection: specificities to stimulus characteristics. Vis Res 1996363487–3500. [DOI] [PubMed] [Google Scholar]


