Abstract
Using pulsed-field-gradient (PFG) experiments, the sizes of the pores in ordered porous media can be estimated from the “diffraction” pattern that the signal attenuation curves exhibit. A different diffraction pattern is observed when the experiment is extended to a larger number (N) of diffusion gradient pulse pairs. Simulations to calculate signal values from arbitrary gradient waveforms are performed for diffusion in restricted geometries using a matrix operator formalism. The simulations suggest that the differences in the characteristics of the attenuation curves are expected to make it possible to measure smaller pore sizes, to improve the accuracy of pore size measurements and potentially to distinguish different pore shapes using the N-PFG technique. Moreover, when an even number of PFG pairs is used, it is possible to observe the diffraction pattern at shorter diffusion times and measure an approximation to the average pore size even when the sample contains pores with a broad distribution of sizes.
Keywords: MR, diffusion, diffraction, coherence, double, PGSE, PFG, pore size, distribution, general gradient waveform, matrix formalism, multiple scattering
1 Introduction
The observation of diffusion of spin-labeled molecules provides an indirect means to probe geometries whose characteristic dimensions are smaller than the voxel resolution of conventional noninvasive MR imaging techniques. Incorporation of pulsed field gradients in MR pulse sequences has made it possible to conveniently measure the diffusion characteristics of the sample [1]. One striking observation was that in materials with an ordered structure, signal attenuation (when plotted as a function of q = γδG/2π, where γ is the gyromagnetic ratio, δ is the diffusion pulse duration and G is the gradient vector) exhibited non-monotonic behavior [2]. Specifically, when the wave-number (q = |q|) assumed certain values depending on the spacing between the restrictions, there was an almost perfect phase cancelation resulting in very small signal values. This fact was exploited to determine the compartment size. Perhaps the simplest system that exhibits this behavior is di using molecules sandwiched between two infinite parallel planes separated by a distance L. For this geometry, the diffraction dips occur when the wave-vector takes the values q = n/L, where n = 1, 2, 3, . . . is the index of the diffraction well.
Another observation regarding the diffraction patterns is that in anisotropic samples, if diffusion is almost free along certain directions but restricted along others, the diffraction pattern is very sensitive to the direction of the diffusion gradient; it is observed only when the diffusion gradients are almost perpendicular to the restricting walls [3]. This fact can be exploited to estimate fiber orientations.
Despite its potential, the application of diffraction patterns has been limited mostly because of the demanding nature of the experiments. In particular, the q-value has to exceed the reciprocal of the spacing between restricting barriers. This can be achieved by increasing the magnitude of the diffusion gradients or their durations. However, hardware limitations prohibit increasing the gradient strength beyond a certain point. Although increasing the gradient duration is possible, the violation of the narrow pulse approximation pushes the diffraction dips towards even larger q-values which in turn makes the pore size estimations less accurate. Another characteristic of the diffraction patterns that limits their widespread use is that the diffraction wells are observable when the diffusion time is long. In short diffusion times, the signal attenuation curve is quite featureless. In contrast to the requirement on q described above, this makes it diffcult to measure the sizes of larger pores.
Last but not least, most porous materials of interest are composed of pores with a broad distribution of sizes. In this case the diffraction wells are not observable at all, and the estimation of an average pore size may be possible using sophisticated methods but not directly from the locations of the diffraction dips. This problem is especially important for the estimation of cell sizes in biological specimens because of their large variability. Consequently, the non-monotonicity of the MR signal has been observed only in the very coherently organized regions of biological tissue such as corpus-callosum of fixed rat brains [4].
A logical extension of the PFG experiment involved the inversion of the magnetization via the application of a series of subsequent 180° radio-frequency (RF) pulses and application of separate pairs of diffusion gradients before and after each of the RF pulses as shown in Figure 1. Here, tm denotes the waiting time between two consecutive pulsed-gradient spin-echo (PGSE) blocks. This pulse sequence, or variants of it, have been considered before but to our knowledge not in the context of diffusion/diffraction phenomenon. The experiment was first proposed in [5], was used to map velocity exchange in molecules undergoing flow [6], and more generally to observe the time correlations of molecular motion [7]. Mitra studied the multi-PFG experiments theoretically in [8] where his emphasis was on the dependence of the MR signal on the angle between the two diffusion gradient pulses. This angular dependence is a signature of local anisotropy, which was observed in lyotropic liquid crystals [9] as well as in macroscopically isotropic biological tissue [10]. Furthermore, Mitra showed that for very long mixing times (tm), the quartic term in a Taylor series expansion of the signal had a dependence on the angle between the two gradients whereas when tm = 0 the quadratic term exhibited this angular dependence. The former finding was employed to measure the average eccentricity and sizes of randomly oriented elongated yeast cells [11]. The latter finding was also used in the estimation of an average pore size [12, 13, 14]. Both of these approaches have employed the results from ‘idealized’ experimental conditions such as δ = 0, Δ → ∞ (where Δ is the diffusion pulse separation) and tm = 0 or tm → ∞.
Figure 1.
A schematic of the N-pulse experiment. The gray boxes depict the RF pulses while the blank boxes show the gradients. All diffusion pulses have the same duration δ. All N pairs have the same separation Δ, and the consecutive pairs are separated by the same mixing time tm.
In this paper, we consider the case of applying the same gradient strength along the direction perpendicular to the boundaries, where Δ corresponding to each pair of the pulses is equal. This special case of the N-PFG experiment has been studied before to observe the (temporal) frequency dependence of the MR signal [15, 16]. Stapf has proposed a single-shot acquisition of several echoes in such experiments with particular emphasis on obtaining the values of the correlation function at multiple times [17]1. In this work, we show that this special case of the N-PFG experiment will yield diffraction-type non-monotonic signal attenuation patterns which are different from the diffraction patterns obtained when a single pair of pulses is used. To produce the signal attenuation curves, we employ the matrix formalism developed by Callaghan [19], which is based on the idea of representing an arbitrary gradient waveform by a series of impulses [20]. This approach was previously used to investigate the diffraction patterns from finite pulsewidth single-PFG experiments in parallel plane, cylindrical and spherical pores with finite wall relaxation [21]. In this paper, we show that this approach can be extended to conveniently simulate the signal from multi-PFG experiments in these restricted domains. Specifically, we first illustrate the diffusion-diffraction pattern in idealized experimental conditions for diffusion taking place in parallel plane, cylindrical and spherical pores. Then we focus on the parallel plane pore and simulate the effects of variations of Δ, δ and tm on the signal attenuation curves. The new diffraction patterns obtained from multi-PFG experiments are expected to improve the feasibility and accuracy of the pore size estimation from diffusion/diffraction experiments and make it possible to estimate an average pore size even when the sample contains pores with a broad distribution of sizes.
2 Theory
2.1 The experiment in “ideal” conditions
When the duration of the diffusion gradients (δ) is small compared to the diffusion-time, given by the time delay between the application of the pulses (Δ), the echo attenuation, i.e., the ratio of the diffusion-attenuated signal to the signal obtained when no gradient is applied, in a single-PFG experiment is given by
| (1) |
where ρ(r) is the initial spin density, and PΔ (r, r′) is the propagator indicating the probability of a diffusing particle initially at location r to end up at r′ after time Δ. For extreme values of diffusion time, the propagator becomes
| (2) |
| (3) |
Note that this single-PFG experiment is a special case of the experiment in Figure 1 with δ = 0 and N = 1.
Next, we shall consider the N-PFG experiment depicted in Figure 1 with δ = 0. We further consider the case in which all diffusion times, gradient strengths and their directions, and mixing times are equal. In this case, there are a total of 2N gradients applied and the signal attenuation is given by
| (4) |
In the limit of infinite diffusion times as well as mixing times, Eq. 3 can be used in all appearances of the propagator in Eq. 4, which results in complete decoupling of all integrations to yield
| (5) |
where S0(q) is the structure function given by
| (6) |
and obeys the relation S0(−q) = S0(q)*.
When ρ(r) is taken to be equal to the reciprocal of the pore volume inside the pore and 0 elsewhere, the structure function takes the following forms for three simple geometries considered2:
| (7) |
Perhaps a more interesting limit is when Δ is infinite, but mixing time is 0. In this case, there are a total of N + 1 gradient pulses with effective q-values
| (8) |
resulting in a signal attenuation of
| (9) |
When P number of pores, isolated from each other, contribute to the overall signal, the resulting signal attenuation is given by
| (10) |
where EΔ,tm,k is the signal attenuation from the k-th pore, which depends on its size, and Vk is the volume of the pore, which can be taken to be L, r2 and R3 when, respectively, distributions of parallel plane, cylindrical and spherical pores are concerned.
2.2 N-PFG experiment with arbitrary timing parameters
Although the above results are quite instructive, the assumptions regarding the timing parameters are not met in real-life experiments. The deviations from the ideal parameters typically involve finite values of Δ and δ. Moreover, although tm = 0 condition can be realized experimentally, this would require application of gradient pulses whose magnitude is twice that of the first and last gradients. Therefore, when the gradient strength is limited, it is beneficial to have a mixing time greater than or equal to δ. To understand the e ects of deviations from ideal parameters, we have adapted the matrix formalism developed in [19] to the multi-PFG experiments that we are considering. Our implementation followed directly from [19] with one correction on the discretization of finite-width pulses, which is detailed in the appendix.
3 Results
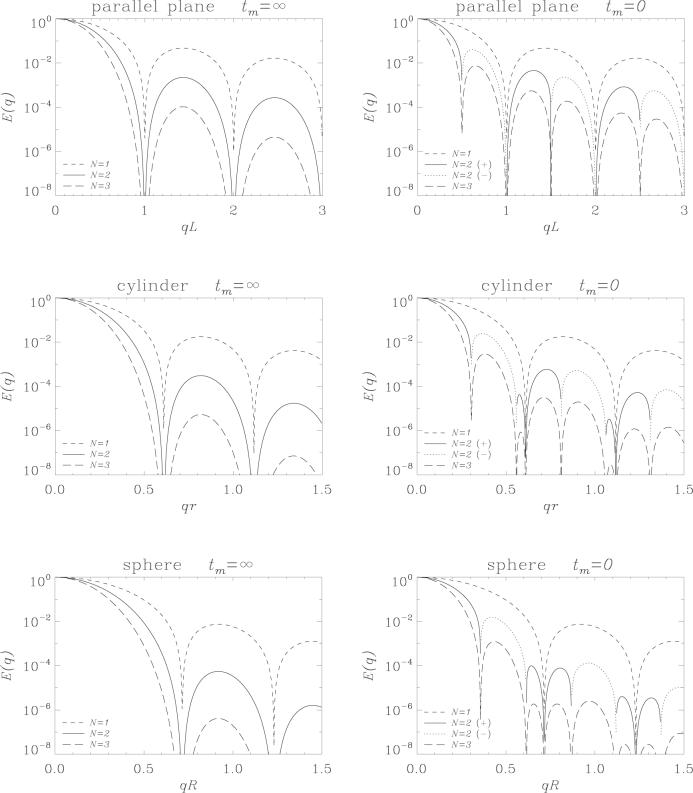
In Figure 2 we show the results of our simulations from parallel plane, cylindrical and spherical pores under idealized experimental parameters. The left column shows the results with infinite mixing time, whereas the right column depicts the same for tm = 0. It is clear from Eq. 5 that the experiments with higher number of pulse pairs (N) when mixing time is large, simply attenuates the signal even more without adding any new information. The left column confirms this expectation.
Figure 2.
Signal attenuation as a function of q with varying number of diffusion gradient pairs for parallel plane pore with spacing L (top), cylindrical pore with radius r (middle) and spherical pore with radius R (bottom). The left column shows the results obtained in the limit tm → ∞ whereas tm = 0 case was shown on the right column. In both cases δ = 0 and Δ → ∞. The continuous and dotted lines both illustrate the curve obtained with N = 2 where the former shows the positive sections and the latter shows the negative sections after flipping.
The situation is quite different when mixing time is set to 0. There are a number of observations that should be made. First, we shall consider the case when N is odd. When N is greater than 1, Eq. 9 suggests that the echo attenuation from a single-PFG experiment is multiplied by a power of the absolute value of S0(2q). Since S0(q) exhibits diffraction dips, |S0(2q)| has to have similar behavior at exactly half the q-value. This fact is readily observed by comparing the attenuation curves from N = 1 with those from N = 3. It should also be noted that when N is odd, the signal is real and positive.
Finally, we consider the case when N is even. In this case, the signal can in general be complex. However, since the structure function is the Fourier transform of a real function, when the geometry is symmetric around the plane that goes through the origin and whose normal is parallel to the diffusion gradient, the results will be real. Furthermore, the S0(q)2S0(2q)* factor ensures that the resulting signal will be real even when S0(q) is complex, as long as the geometry has a symmetry plane perpendicular to the direction of the gradient. This is the case for the parallel plane pore that we study. The signal may be negative valued though. In our plots, negative values are flipped, but assigned a dotted line to discriminate them from the positive sections of the curves represented by continuous lines. Note that Eq. 9 does have the S0(2q) factor, indicating that the compartment size can be estimated using half the gradient strength. In this case, however, the signal crosses into negative values rather than bouncing back up. Note that there are significant qualitative differences between the signal curves obtained from different geometries. The signal decay curves obtained from cylindrical and spherical pores possess extra lobes when compared to the curves from parallel planes when N is greater than 1. The signal vanishes when qr = {0.305, 0.558, 0.610, . . .} for the cylindrical pore and qR = {0.358, 0.601, 0.715, . . .} for the spherical pore.
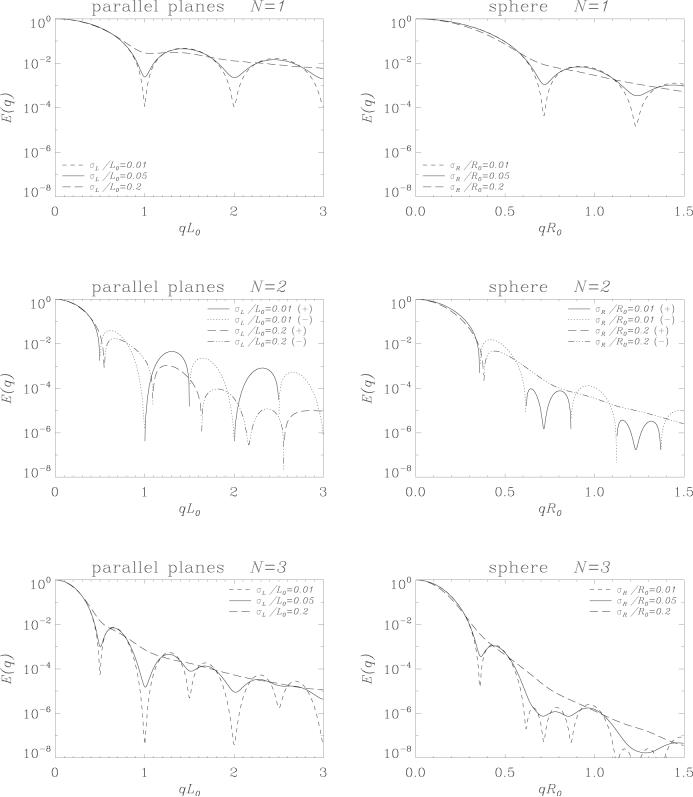
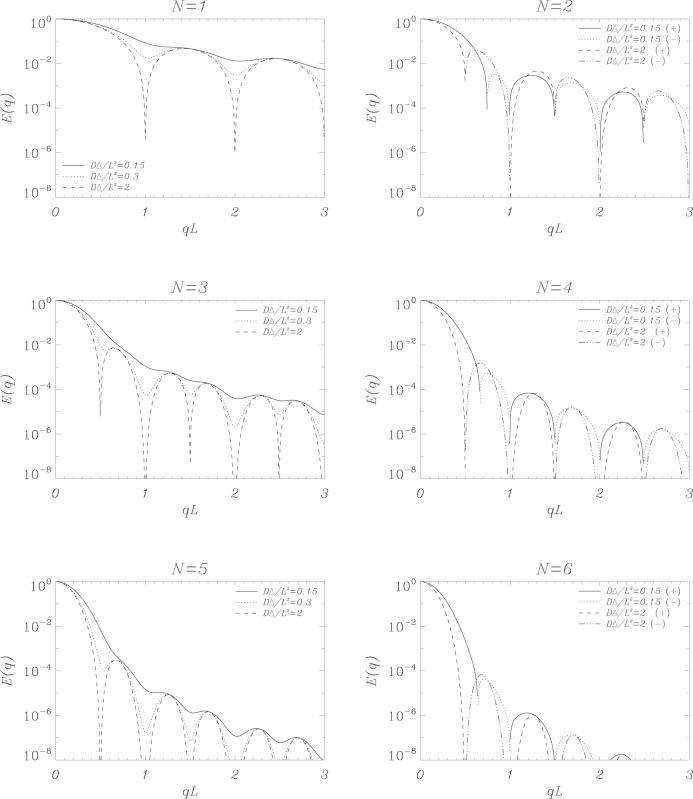
Figure 3 shows the signal attenuation curves when a distribution of isolated pores with varying dimensions are considered. In these simulations we have assumed that the dimensions are Gaussian distributed with mean values of L0, R0 and standard deviations of σL, σR for the parallel plane and spherical pore ensembles respectively. Note that as the distribution of pore sizes gets broader, the diffraction dips disappear in single-PFG experiments. A similar response is observed when experiments with other odd number of pulse pairs are simulated. However, when the number of pulse pairs is even, especially the first diffraction dip is well preserved although its location may suffer slight shifts. This is due to the fact that the “dips” for even N are characterized by zero crossings. Consequently, when the q-value is close to its zero-crossing value, the contribution of the pores whose sizes are smaller than what is implied by the zero crossing will be positive whereas the contribution from larger pores will be negative. These two groups of contributions will cancel each other maintaining the zero crossing. There are two competing effects that try to shift the zero crossing away from its position implied by a homogeneous distribution of pores. The larger pores contain more spins than the smaller pores. This is why the signal attenuations are multiplied by the pore volume in Eq. 10. This effect pushes the zero crossings to the left. However, diffusion inside larger pores gives rise to more rapid signal attenuation, which acts in the opposite fashion. As seen in the second row of Figure 3, in the simulations we have performed, the latter effect seems to influence the signal more than the former. However, the location of the first zero-crossing seems to remain very close to the point implied by the mean value of the pore size even when the standard deviation is large. Next, we focus on the parallel plane pore and investigate the effects of variations in Δ. The results for experiments from N = 1 through N = 6 are shown in Figure 4. Similar to the tm → ∞ case, increasing N beyond N = 3 does not create any change other than attenuating the signals more. The straightening of the single-PFG curve for smaller values of Δ is observed in a similar fashion in other odd values of N. When N is even, the features of the curves are more resilient to the decreases in Δ. This is because the zero crossings do not disappear readily in the attenuation curves. The first of these crossings appear to occur at slightly larger values of q when Δ is reduced.
Figure 3.
Signal attenuation curves as a function of q from distributions of parallel planes (left column) and spheres (right column). The mean and standard deviation of the spacings of the parallel planes are denoted by L0 and σL whereas the mean and standard deviations of the radii of the spheres are denoted by R0 and σR respectively. Simulations of experiments with number of pulse pairs varying 1 through 3 (top to bottom) are shown. δ = tm = 0, Δ → ∞.
Figure 4.
Signal attenuation as a function of q with varying values of Δ for the parallel plane pore. Each figure depicts the signal attenuation curve with a different number of diffusion gradient pulse pairs. δ = 0, tm = 0.
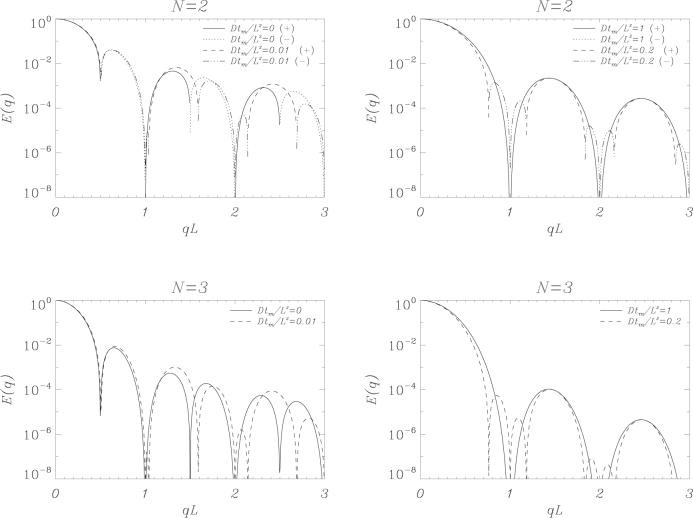
Another timing parameter that can be changed in multi-PFG experiments is the mixing time tm. Since it is not defined in single-PFG experiments, we provide results from double- and triple-PFG experiments only. The left column of Figure 5 shows the results when tm is increased from the value of 0. This is important because the tm = 0 condition necessitate the application of twice the gradient strength which may not be affordable especially when one is interested in measuring the sizes of smaller pores. If this is the case, then the minimum value of tm can be equal to δ. The results indicate that the first few lobes of the attenuation curves are quite robust to the variations in tm although significant alterations are observed at higher q-values. Progressively increasing tm pushes the zero crossings towards the locations of diffraction wells observed when N = 1. The locations of these do not change at all. When tm gets very large, zero crossings reach these points. This is the case when the diffusional processes in different sections of the multi-PFG experiment become completely independent from one another. In this case, the diffraction patterns become similar to those from single-PFG experiments although experiments with larger number of gradient pairs suffer more signal loss.
Figure 5.
Signal attenuation as a function of q with varying values of tm for the parallel plane pore. δ = 0, DΔ/L2 = 2. The left column shows the attenuation curves when tm is small, where the right column shows the same for large values of tm.
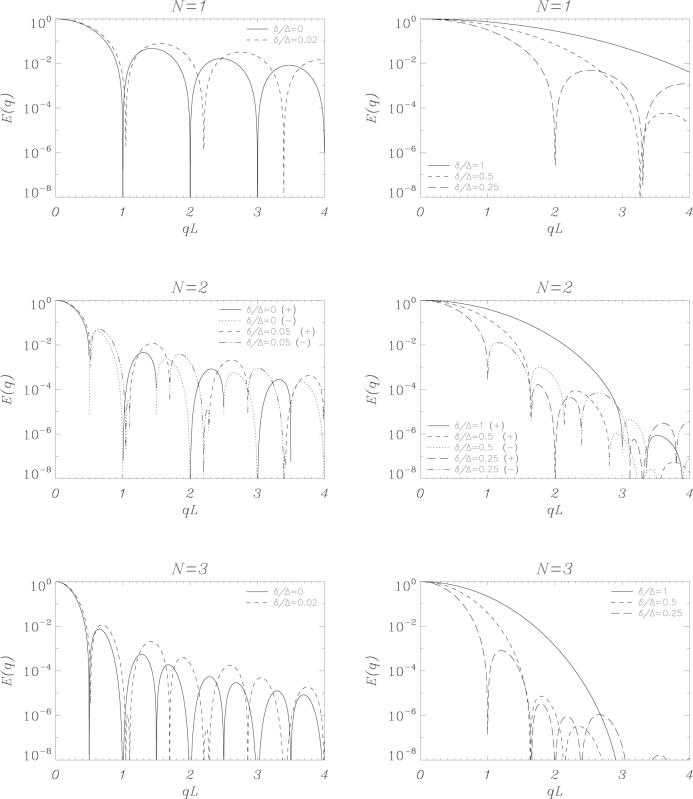
Finally, we consider the N-PFG experiment with finite sized gradient pulses. It was shown that in finite-pulsewidth single-PFG experiments, the diffusion signal appears as if the motion of spins takes place between the two centers-of-mass of the particles calculated during the application of the diffusion pulses [22]. Therefore, the pore appears to be smaller than its actual size resulting in a shift of the diffraction dips towards higher q-values. As shown in Figure 6, as the pulse width increases, the same effect is observed in multi-PFG experiments.
Figure 6.
Signal attenuation as a function of q with varying values of δ for the parallel plane pore. tm = 0, DΔ/L2 = 2. The left column shows the attenuation curves when δ is small, where the right column shows the same for larger values of δ.
4 Discussion
The formulations and the simulations we have presented indicate that the non-monotonic behavior of the signal attenuation from N-PFG experiments leads to significant advantages in the determination of compartment sizes when compared to those from single-PFG experiments. An estimate for the compartment sizes can be obtained by determining the locations (q-values) at which the signal is lost. The reciprocal of the q-values that yield the diffraction dips, upon multiplication of the expected values of qL, qr or qR as described above, gives the estimate for the compartment size. If the experimental parameters differ from the ideal conditions, then the values of qL, qr and qR will have to be modified accordingly.
Since the diffraction patterns have different characteristics when different number of pulse pairs (N) are employed, it may be beneficial to repeat the experiment with different number of pulse pairs. An alternative is to simply acquire the signal obtained at different refocussing times [17] during a single scan. In either case, obtaining a hierarchy of signals is expected to improve the identification of different diffraction dips.
Despite the significant improvements the N-PFG experiment introduces to the feasibility of the observation of diffraction dips, it has some disadvantages as well. The predicted signal values when N > 1 are smaller than those from single-PFG experiments necessitating higher signal-to-noise-ratios (SNRs). This may be alleviated to certain extent by using smaller Δ values and even number of gradient pulse pairs (see Figure 4 and related discussion). Also note that, when N is even, the signal is predicted to be negative and possibly complex. Therefore magnitude-valued data can not illustrate the zero-crossings. However, upon taking the magnitude value of the signal, the zero-crossings turn into dips, which can still be employed in the compartment size estimation.
Finally, we would like to note that it may be possible to obtain more information from the signal attenuation curves by transforming the signal decay profiles into higher-dimensional joint probability density functions [23, 18], which could suggest an alternative explanation to the origins of the predicted diffraction patterns by illustrating the correlations of molecular motion between the separate encoding intervals.
5 Conclusion
We have investigated the diffusion/diffraction phenomenon in multi-PFG experiments. We have shown that the diffraction patterns of multi-PFG experiments with small mixing times are qualitatively different from those obtained via single-PFG experiments. These differences are predicted to yield significant improvements in the feasibility of acquisitions and widen the range of potential applications of the diffraction patterns. Specifically, we have shown that the first diffraction dip occurs at exactly half the q-value when compared with diffraction patterns from single-PFG experiment. This makes it possible to measure smaller pore sizes and make the pore size estimates more accurate as pulses of half the width can be applied. Moreover, the diffraction pattern is different when obtained from different pore shapes, which can be exploited to infer the shapes of the pores. When an even number of gradient pulse pairs is used, it is possible to observe diffraction patterns at shorter diffusion times; this in turn makes the experiments more feasible, reduces the total acquisition time and makes it possible to measure large pore sizes. Finally, it is possible to estimate an average compartment size from samples with a broad distribution of pore sizes using the multi-PFG technique with an even number of pulse pairs.
Acknowledgments
This research was supported by the Intramural Research Program of NICHD.
Appendix
We show two different discretizations of finite width gradient pulses in Figure 7 where panel (a) shows the scheme employed in [19], and panel (b) shows our approach. The pulse sequence is a simple steady gradient spin echo experiment which is a special case of PGSE experiment with δ = Δ. Note that when the number of gradient impulses approximating each of the gradient lobes is set to 1, i.e., when we keep only the first impulse of each gradient lobe, the scheme in 7a yields a pulse separation value of Δ = δ + τ/2, which is inconsistent with the real diffusion time.
Figure 7.
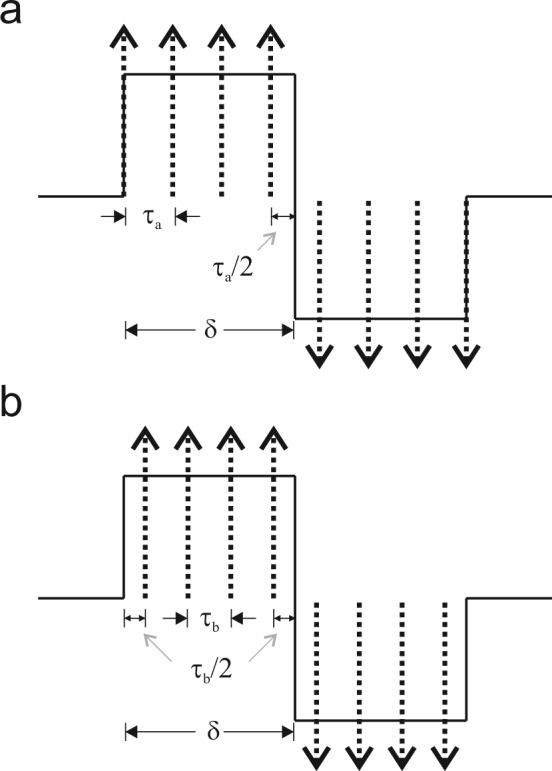
Discretization of a steady gradient experiment using a) the scheme in [19] and b) our approach. In the former case, δ = (M − 1/2)τa whereas in the latter δ = Mτb.
In order to make a more quantitative assessment, we consider the case of Gaussian diffusion with this pulse sequence. Unlike in Figure 7 however, we start from a train of M pulses with separation time τ. Note that this same train of impulses can be envisioned to be the discretizations of the steady gradient spin echo experiments with δa = (M − 1/2) τ and δb = M τ according to the schemes in [19] and ours respectively. The exact form of the signal attenuation from this experiment is given, after some algebra, by
| (11) |
where q is the net wave number and D is the diffusion coefficient. Comparing this result with the analytical expression for continuous pulses given by the well-known Stejskal-Tanner formula E(q) = exp(−4π2q2D(Δ − δ/3)) with Δ = δ suggests that the train of M pulses exactly represents an experiment with an effective pulse duration
| (12) |
Comparing this result with those implied by the two discretization approaches suggests that our discretization depicted in Figure 7b is more accurate since the true value of δ in Eq. 12 asymptotically converges to the value of Mτ from above whereas the value implied by the former approach is smaller than Mτ.
The error caused by the former discretization can be quite significant. For example, consider Gaussian diffusion with D = 2.0 × 10⁻³mm2/s observed using the single PFG experiment with Δ = δ = 50ms, and q = 40mm−1. If we discretize this pulse sequence with M = 10; using the scheme in Figure 7a, we get a signal value of 0.0116, whereas the discretization in Figure 7b would yield the approximate value of 0.0145 for the same pulse sequence. Exact result for the signal attenuation implied by the Stejskal-Tanner relation is 0.0148.
Footnotes
Publisher's Disclaimer: This is a PDF file of an unedited manuscript that has been accepted for publication. As a service to our customers we are providing this early version of the manuscript. The manuscript will undergo copyediting, typesetting, and review of the resulting proof before it is published in its final citable form. Please note that during the production process errors may be discovered which could affect the content, and all legal disclaimers that apply to the journal pertain.
For a review of the more general N-PFG experiments and techniques of obtaining the features of spatiotemporal correlations of molecular motion, see [18].
It is assumed that the cylindrical and spherical pores are centered at the origin, which is defined by the point at which the magnetic field due to the diffusion gradient is zero. In the parallel plane pore, it is assumed that one of the planes go through the origin and the gradient is applied in the direction perpendicular to the parallel planes. Similarly, in the cylindrical pore, diffusion gradient is taken to be perpendicular to the cylinder's axis.
References
- 1.Stejskal EO, Tanner JE. Spin diffusion measurements: Spin echoes in the presence of a time-dependent field gradient. J Chem Phys. 1965;42(1):288–292. [Google Scholar]
- 2.Callaghan PT, Coy A, MacGowan D, Packer KJ, Zelaya FO. Diffraction-like effects in NMR diffusion studies of fluids in porous solids. Nature. 1991;351:467–469. [Google Scholar]
- 3.Avram L, Assaf Y, Cohen Y. The effect of rotational angle and experimental parameters on the diffraction patterns and micro-structural information obtained from q-space diffusion NMR: implication for diffusion in white matter fibers. J Magn Reson. 2004;169(1):30–38. doi: 10.1016/j.jmr.2004.03.020. [DOI] [PubMed] [Google Scholar]
- 4.Weng J-C, Chen J-H, Kuo L-W, Wedeen VJ, Tseng W-YI. Maturation-dependent microstructure length scale in the corpus callosum of fixed rat brains by magnetic resonance diffusion-diffraction. Magn Reson Imaging. 2007;25(1):78–86. doi: 10.1016/j.mri.2006.08.018. [DOI] [PubMed] [Google Scholar]
- 5.Cory DG, Garroway AN, Miller JB. Applications of spin transport as a probe of local geometry. Polym Preprints. 1990;31:149. [Google Scholar]
- 6.Callaghan PT, Manz B. Velocity exchange spectroscopy. J Magn Reson A. 1994;106:260–265. [Google Scholar]
- 7.Stapf S, Damion RA, Packer KJ. Time correlations in fluid transport obtained by sequential rephasing gradient pulses. J Magn Reson. 1999;137:316–323. doi: 10.1006/jmre.1998.1685. [DOI] [PubMed] [Google Scholar]
- 8.Mitra PP. Multiple wave-vector extensions of the NMR pulsed-field-gradient spin-echo diffusion measurement. Phys Rev B. 1995;51(21):15074–15078. doi: 10.1103/physrevb.51.15074. [DOI] [PubMed] [Google Scholar]
- 9.Callaghan PT, Komlosh ME. Locally anisotropic motion in a macroscopically isotropic system: displacement correlations measured using double pulsed gradient spin-echo NMR. Magn Reson Chem. 2002;40:S15–S19. [Google Scholar]
- 10.Komlosh ME, Freidlin RZ, Horkay F, Assaf Y, Basser PJ. Detection of microscopic anisotropy in gray matter using d-PGSE, in. Proc Intl Soc Magn Reson Med. 2005;13:843. doi: 10.1016/j.jmr.2007.07.003. [DOI] [PubMed] [Google Scholar]
- 11.Cheng Y, Cory DG. Multiple scattering by NMR. J Am Chem Soc. 1999;121:7935–7936. [Google Scholar]
- 12.Koch MA, Finsterbusch J. Multiple wave vector diffusion experiments on restricted diffusion. Proc Intl Soc Mag Reson Med. 2005;13:840. [Google Scholar]
- 13.Koch MA, Finsterbusch J. Numerical simulation of double wave vector diffusion experiments. Proc Intl Soc Mag Reson Med. 2006;14:1631. doi: 10.1002/mrm.21976. [DOI] [PubMed] [Google Scholar]
- 14.Ziener CH, Weber T, Bauer WR, Jakob PM. Quantification of the spinal cord axon diameter using an extension of the PGSE sequence. Proc Intl Soc Mag Reson Med. 15:2007. [Google Scholar]
- 15.Stepišnik J, Callaghan PT. The long time tail of molecular velocity correlation in a confined fluid: observation by modulated gradient spin-echo NMR. Physica B. 2000;292:296–301. [Google Scholar]
- 16.Stepišnik J, Callaghan PT. Low-frequency velocity correlation spectrum of fluid in a porous media by modulated gradient spin echo. Magn Reson Imaging. 2001;19:469–472. doi: 10.1016/s0730-725x(01)00269-7. [DOI] [PubMed] [Google Scholar]
- 17.Stapf S. Determination of velocity autocorrelation functions by multiple data acquisition in NMR pulsed-field gradient experiments. J Magn Reson. 2001;152:308–312. [Google Scholar]
- 18.Stapf S, Han S-I, Heine C, Blümich B. Spatiotemporal correlations in transport processes determined by multiple pulsed field gradient experiments. Concepts Magn Reson. 2002;14(3):172–211. [Google Scholar]
- 19.Callaghan PT. A simple matrix formalism for spin echo analysis of restricted difffusion under generalized gradient waveforms. J Magn Reson. 1997;129:74–84. doi: 10.1006/jmre.1997.1233. [DOI] [PubMed] [Google Scholar]
- 20.Caprihan A, Wang LZ, Fukushima E. A multiple-narrow-pulse approximation for restricted diffusion in a time-varying field gradient. J Magn Reson A. 1996;118:94–102. [Google Scholar]
- 21.Codd SL, Callaghan PT. Spin echo analysis of restricted diffusion under generalized gradient waveforms: Planar, cylindrical, and spherical pores with wall relaxivity. J Magn Reson. 1999;137:358–372. doi: 10.1006/jmre.1998.1679. [DOI] [PubMed] [Google Scholar]
- 22.Mitra PP, Halperin BI. Effects of finite gradient-pulse widths in pulsed-field-gradient diffusion measurements. J Magn Reson A. 1995;113:94–101. [Google Scholar]
- 23.Stapf S, Packer KJ. Two-dimensional propagators and spatio-temporal correlations for flow in porous media: a comparative study. Appl Magn Reson. 1998;15:303–322. [Google Scholar]


