Abstract
Cholinergic projections from the medial septum and diagonal band of Broca into the hippocampus have long been implicated in learning and memory. Projections from CA3 to neurons in the medial septum and the diagonal band of Broca have been anatomically characterized. The present experiments were designed to evaluate interactions between the dorsal CA3 subcortical efferents and the cholinergic efferents from the medial septum and diagonal band of Broca for spatial and nonspatial (visual object) novelty detection in the rat. In Experiment 1, physostigmine and scopolamine (both 0.4 μL at 30 μM) were infused into dorsal CA3 and animals were tested on a spatial and nonspatial (visual object) novelty detection paradigm. Scopolamine infusions into the dorsal CA3 caused deficits for both spatial and nonspatial (visual object) novelty detection. Physostigmine infusions into the dorsal CA3 enhanced both spatial and nonspatial (visual object) novelty detection. These data support models proposing that acetylcholine may control the dynamics for encoding, consolidation, and retrieval in the hippocampus. In Experiment 2, a selective transection of dorsal CA3 efferents in the fimbria resulted in deficits for spatial and nonspatial (visual object) novelty detection. These deficits were similar to the deficits caused by scopolamine infusions into dorsal CA3. These data demonstrate that dorsal CA3 and the medial septum/diagonal band of Broca interact, and that dorsal CA3 influences cholinergic inputs into the hippocampus to facilitate encoding.
Keywords: Modulation, Acetylcholine, Learning and Memory, Novelty Detection, Physostigmine, Scopolamine, Spatial Learning, CA3, Hippocampus, Fimbria
Introduction
A neural circuit between the hippocampus and the septum (i.e. the medial septum and lateral septum) and the diagonal band of Broca has been well documented, as has the pivotal role of CA3 in this circuit (Gaykema et al., 1991; Raisman et al., 1966; McLennan & Miller, 1974; McNaughton & Miller, 1986; Swanson & Cowan, 1977, 1979; Wyss et al., 1980). Briefly, CA3 sends axons through the ventrolateral portion of the fimbria that monosynaptically terminate in the lateral septum, medial septum, and diagonal band of Broca (on cholinergic neurons in the latter two) (Gaykema et al., 1991; Raisman et al., 1966; Wyss et al., 1980). The medial septum and diagonal band of Broca send cholinergic and GABAergic projection fibers through the dorsomedial portion of the fimbria into the hippocampus, and most strongly to CA3 (Swanson & Cowan, 1977, 1979). The cholinergic fibers, in particular, have been implicated in hippocampal theta rhythm (McLennan & Miller, 1974; McNaughton & Miller, 1986) and have modulatory effects for learning and memory tasks. The cholinergic inputs have been the main focus of research since the GABAergic efferents may cause too rapid of effects to modulate learning and memory per se (cf. Hasselmo & Fehlau, 2001; Wallenstein & Hasselmo, 1997). It has also been shown that acetylcholine (ACh) has a more robust effect in stratum radiatum (s rad) than stratum lacunosum-moleculare (s l-m) or stratum lucidum (s luc) in slice preparations (Hasselmo & Schnell, 1994; Hasselmo et al., 1995). This is relevant since the recurrent collaterals in CA3 and Schaffer collaterals in CA1 synapse in the s rad, whereas inputs from the entorhinal cortex via the perforant path synapse in the s l-m and the mossy fiber inputs to CA3 synapse in s luc. These anatomical and neurophysiological data suggest that ACh selectively acts upon the recurrent collaterals in CA3 to facilitate efficient encoding, consolidation, or retrieval of information from mossy fiber and perforant path inputs.
It has been proposed that the optimal circuit dynamics in the hippocampus for efficient encoding, consolidation, and retrieval are controlled by cholinergic efferents from the medial septum and diagonal band of Broca (Hasselmo & McGaughy, 2004; Hasselmo & Schnell, 1994; Hasselmo, Schnell, & Barkai, 1995). This model suggests that high levels of acetylcholine (ACh) facilitate encoding of novel information by biasing the recurrent collaterals and Shaffer collaterals to encode information from the mossy fiber and perforant path inputs. These models have been tested using two encoding and consolidation/retrieval tasks by Rogers and Kesner (2003, 2004), who reported that increasing acetylcholine receptor activation via physostigmine infusions into dorsal CA3 did not disrupt encoding, whereas reducing acetylcholine receptor activation via scopolamine infusions into dorsal CA3 resulted in encoding deficits during delay fear conditioning (Rogers & Kesner, 2003) and a Hebb-Williams maze (Rogers & Kesner, 2004). Conversely, low levels of ACh have been proposed to cause inefficient encoding of novel information but facilitate consolidation and retrieval of familiar information (Hasselmo & McGaughy, 2004; Hasselmo & Schnell, 1994; Hasselmo et al., 1995). Rogers and Kesner (2003, 2004) validated this prediction using a Hebb-Williams maze and delay fear conditioning tasks. On both of these tasks, scopolamine infusions into dorsal CA3 disrupted encoding, but not consolidation or retrieval. Physostigmine infusions into dorsal CA3 disrupted consolidation or retrieval, but not encoding on the same Hebb-Williams maze and delay fear conditioning tasks.
The role of CA3 in modulating the medial septal and diagonal band of Broca cholinergic projections into the hippocampus via the fimbria has not been examined. There is a direct projection via the fimbria from CA3 to cholinergic neurons in the medial septum and diagonal band of Broca (Gaykema et al., 1991), as well as a more diffuse projection from CA3 to the medial septum, diagonal band of Broca, and lateral septum (Raisman, Cowan, & Powell, 1966; Swanson & Cowan, 1977, 1979). All of these projections are topographically organized (Raisman et al., 1966; Wyss, Swanson, & Cowan, 1980).
In Experiment 1, scopolamine and physostigmine were infused into dorsal CA3 and the animals were run on a spatial and nonspatial (visual object) novelty detection task (Poucet, 1989; Lee, Hunsaker, & Kesner, 2005; cf. Hasselmo, 2005). In Experiment 2, dorsal CA3 subcortical efferents via the fimbria were transected while sparing cholinergic afferents from medial septum and diagonal band of Broca to test the interaction between dorsal CA3 and the medial septum/diagonal band of Broca during the same spatial and nonspatial (visual object) novelty detection task. The effects of this selective transection of dorsal CA3 subcortical efferents via the fimbria were subsequently compared to the effects of physostigmine and scopolamine infusions into dorsal CA3.
Experiment 1
Material and Methods
Subjects
Twenty-six male Long Evans rats served as subjects for this experiment. They weighed between 275 and 350 g when they arrived (Simonsen Laboratories, Inc.; Gilroy, CA). Animals were free fed and had access to water ad libitum. The health of the animals was assessed weekly by a University of Utah IACUC veterinarian. All experimental and surgical procedures conformed to the NIH Guide for the Care and Use of Laboratory Animals, University of Utah IACUC, and AAALAC regulations and protocols.
Behavioral Apparatus
The behavioral apparatus was an open, circular platform (i.e. cheeseboard; cf. Gilbert & Kesner, 2003; Lee et al., 2005). The platform was 119 cm in diameter and elevated 70 cm from the floor. The platform was covered by a vinyl curtain. The platform was kept in a well-lit room with one door, an air tank, and posters of various sizes and colors on the walls. Rats were kept in a cage outside the testing room during intersession intervals. A video camera attached to the ceiling of the room was connected to a VCR and monitor in an adjacent room.
Surgical Method
Experimentally naïve animals received chronic dorsal CA3 cannulae (SCOPO n=9; PHYSO n=9; CONTROL (PBS) n=8). Animals were anesthetized with isoflurane (1-4% at 1-2 L/min) and placed in a stereotaxic frame (David Kopf Instruments; Tujunga, CA). Dorsal CA3 cannula coordinates were bilaterally 3.6 mm posterior to bregma, 3.6 mm lateral to the midline suture, and 3.6 mm ventral to the skull surface. Burr holes were drilled for each stylus as well as three holes for screws that were used to anchor the dental cement. Cannulae implanted were 22 gauge (GA) stylae through which 26 GA injection cannulae could be inserted to project 1.0 mm from the bottom of the stylus. Ventral coordinates were taken from the tip of a 26 GA cannula projecting through a 22 GA stylus. Cannula supplies were purchased from Plastics One (Roanoke, VA). Screws were fastened to the skull and stylae were lowered into place. Dental cement (Orthojet Powder and Liquid; Lang Dental; Wheeling, IL) was mixed and placed on the skull to anchor the stylae. Once the cement hardened, animals were returned to their home cages to recover. As the animals recovered, the injection cannulae were removed from the stylus and dust caps with dummy cannulae were put in their place to keep foreign particles out of each stylus.
Behavioral Method
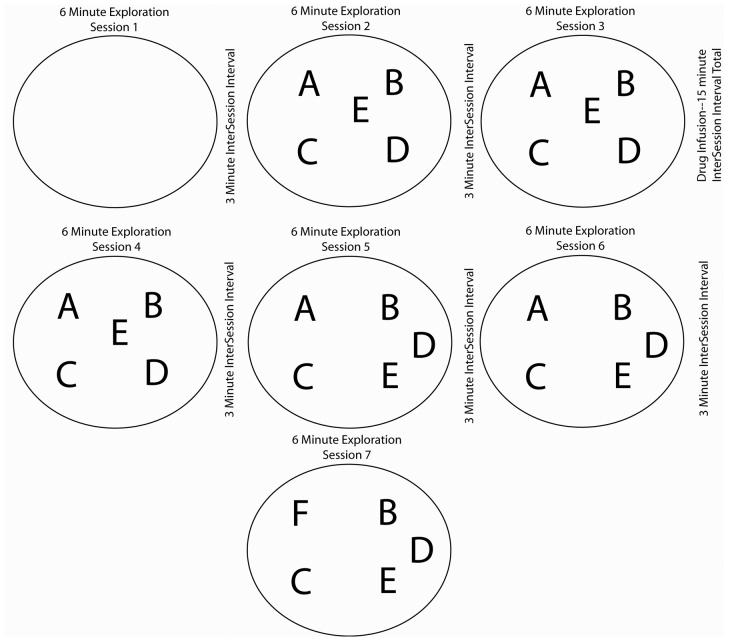
During Session 1, no objects were present on the board. Rats were placed on the board and allowed six minutes to explore. After Session 1, the animal was placed in a cage outside the testing room for a three-minute intersession interval (ISI). Before Session 2, five objects to which the animal had never been exposed were placed on the maze in a geometric pattern (Figure 1). Rats were allowed to explore both the board and objects, followed by a three-minute ISI. During Session 3, the animal was placed on the maze with everything identical to Session 2. After Session 3, animals with dorsal CA3 cannulae received a bilateral intracranial infusion of scopolamine (a cholinergic antagonist) (SCOPO n=9; 0.4 μL/hemisphere @ 30 μM in PBS), physostigmine (a cholinergic agonist) (PHYSO n=9; 0.4 μL/hemisphere @ 30 μM in PBS), or PBS as a vehicle control (CONTROL (PBS) n=8; 0.4 μL/hemisphere @ 125 mM) at a flow rate of 6.0 μL/hr. An animal received only a single drug. Drug infusion took five minutes and the animal was placed in a cage for an additional 10 minutes prior to Session 4. This resulted in a 15-minute ISI after Session 3. Session 4 was identical to Sessions 2 and 3. Before Session 5, two of the objects were moved in space (cf. Figure 1). After a three-minute ISI, Session 5 began when the animal was placed on the board with the familiar objects in the novel spatial configuration. After six minutes of exploration, the animal was removed for a three-minute ISI. Session 6 was identical to Session 5. Before Session 7, a novel object was substituted for the object occupying the upper left hand corner of the geometric pattern. The rat was then placed on the board after the three-minute ISI and allowed to explore the objects for the six-minute Session 7. After Session 7, the rat was returned to its home cage, fed, and testing was complete.
Figure 1. Experimental Apparatus.
Diagram of the experimental apparatus and experimental paradigm.
Histological Method
Each animal was sacrificed by an injection of 1 mL pentobarbital (70 mg/mL) and intracardially perfused with PBS and 10% formalin. The brain was stored at 4°C for 72 hours in a 30% sucrose/formalin solution. A tissue block containing the hippocampus was frozen and cut into 40 μm sections. For sections from animals with dorsal CA3 cannulae from experiment 1, the slides were coverslipped. Cannulae placements were verified microscopically.
Dependent Measures and Statistical Analysis
The dependent measure for Object Exploration was time spent exploring the objects. Exploration was recorded when the animal sniffed, pawed at, or continuously looked in the direction of an object from a distance of under 1 cm for greater than 0.5 seconds. To measure Habituation of object exploration, we calculated a difference score by subtracting the time spent exploring each object in Session 2 from the time spent exploring the same object during Session 3. The same calculation was performed comparing Sessions 3 and 4. The habituation index was the arithmetic mean of the difference scores for all five objects (A, B, C, D, and E) between Sessions 2 and 3 (Habituation 1) and between Sessions 3 and 4 (Habituation 2). A spatial novelty index was calculated to quantify the amount of exploration for the two objects moved from their original locations (Displaced Object Exploration). The sum of the exploration time of both of the displaced objects (i.e., Objects D and E) during Sessions 3–4 was subtracted from the sum of the exploration time for the same objects during Sessions 5-6. The spatial mismatch index was calculated for the nondisplaced objects (Nondisplaced Object Exploration: Objects A, B, and C) to assess whether a spatial reconfiguration of two objects in the environment would result in general re-exploration of all six objects or selective exploration of only the two moved objects. We calculated an object novelty index by subtracting the average exploration time for the four objects that were not changed (Objects B, C, D, and E) from the time spent exploring the newly introduced object during Session 7 (Object F--Novel Object Exploration; calculation after Poucet, 1989; Lee et al., 2005).
To measure general locomotor activity, nine equal sized grids were drawn on the television monitor. The total number of these grids crossed per Session was used as a measure of general locomotor activity. A rat was scored as having crossed a grid if all four limbs entered a grid. All behavioral data was scored from recorded videotape by an experimenter who was blind to treatment.
General locomotor behavior measured by grid crossings was analyzed statistically by performing two-way repeated measures ANOVA with drug infused as the between factor and Session as the within factor. All object exploration factors calculated were analyzed statistically using one-way ANOVA with drug infused as the between factor. All analyses were performed using the statistics toolbox on MATLAB (v6.5 R13; Natick, MA). Alpha was set at p<0.05 for all statistical analyses and Tukey's HSD post hoc paired comparisons tests were run on all significant effects.
Results
Histology
Cannula tips were all located in dorsal CA3. Figure 2 shows reconstructed cannula placements for animals in the present experiment on a plate modified from Paxinos and Watson (1997). No animals were excluded from analysis due to occluded or misplaced cannulae.
Figure 2. Experiment 1 Histology.
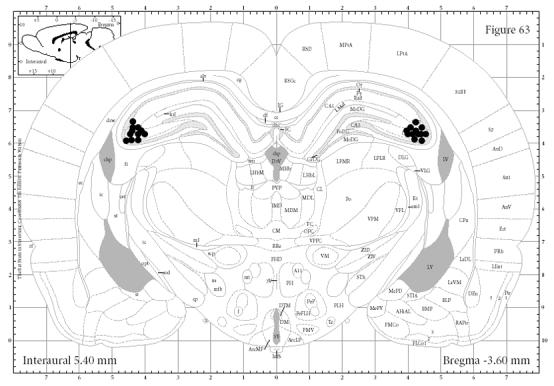
Dorsal CA3 cannulae placements in animals from Experiment 1. Note that all cannulae are within dorsal CA3.
Behavioral Results
Locomotor Activity
Two-way repeated measured ANOVA were performed to determine whether animals habituated their locomotor activity and to test whether drugs caused any hyper or hypo-activity. Grid crossings for SCOPO, PHYSO, and CONTROL (PBS) as a function of Session are plotted in Figure 3a. There was no significant effect of drug infused (F(2,181)=1.54, p=0.22). There was a significant effect of Session, since all groups crossed fewer grids as a function of Session (F(6,181)=18.21, p<0.0001). There was no interaction between drug infused and Session (F(12,181)=0.91, p=0.52). All animals crossed fewer grids in later sessions relative to earlier sessions, but did not differ from each other.
Figure 3. Results of Experiment 1.
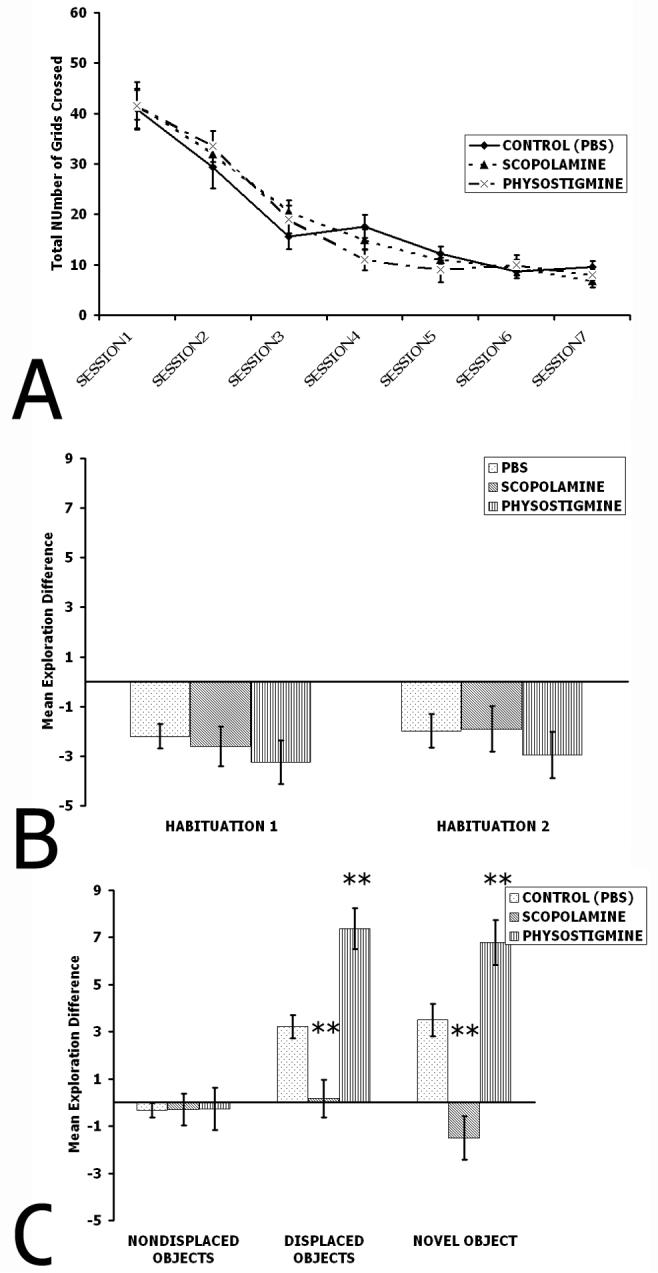
A. Habituation of locomotor activity as a function of Session. Notice that all drug infusion groups exhibited similar habituation. B. Habituation of object exploration. Note that no animals differed from each other. C. Nondisplaced Object exploration, Displaced Object exploration, and Novel Object exploration. There were no differences in any drug infusions groups for Nondisplaced Object exploration. Note that the SCOPO group shows a pronounced deficit for both the displaced object and novel object exploration relative to CONTROL (PBS) and PHYSO groups. The PHYSO group showed significant facilitation for both the displaced object and novel object condition compared to the CONTROL (PBS) group. ** p<0.01 relative to all other groups.
Object Exploration
A one-way ANOVA was performed to determine whether rats habituated their object exploration as a function of session (Figure 3b). There were no group differences when Sessions 2 and 3 were compared (Habituation 1) (F(2,24)=0.39, p=0.68) nor was there an effect when Sessions 3 and 4 were compared (Habituation 2) (F(2,24)=0.67, p=0.52). Since a comparison of Sessions 2 and 3 (during which there were no drug infusions) and a comparison of Sessions 3 and 4 (between which animals received infusions of drug) both showed no differences among the groups, it can safely be assumed that the drug itself did not affect habituation. All animals habituated their object exploration during later Sessions compared to earlier Sessions. Nondisplaced object exploration (Figure 3c) was analyzed in the same manner and there was no significant effect for drug infused (F(2,24)=1.84, p=0.18). Animals did not increase exploration of the nondisplaced objects after the spatial change.
A one-way ANOVA was performed to determine whether or not rats re-explored the displaced objects (Figure 3c). There was a significant effect for drug infused (F(2,24)=22.79, p<0.0001). Tukey's HSD post hoc paired comparisons test revealed that the SCOPO group explored the displaced objects less than CONTROL (PBS) or PHYSO groups (p<0.01). PHYSO explored the displaced objects more than the CONTROL (PBS) and SCOPO groups (p<0.01). These results demonstrate that scopolamine infusions into dorsal CA3 disrupted spatial novelty detection, whereas physostigmine infusions enhanced spatial novelty detection.
Selective exploration of a novel object introduced into the environment (Figure 3c) was analyzed by performing a one-way ANOVA. There was a significant effect of drug infused (F(2,24)=21.3, p<0.0001). Tukey's HSD post hoc indicated that the PHYSO group explored the novel object more than CONTROL (PBS) and SCOPO groups (p<0.01). The SCOPO group explored the novel object less than CONTROL (PBS) and PHYSO groups (p<0.01). These results demonstrate scopolamine infusions disrupted visual object novelty detection, whereas physostigmine infusions enhanced visual object novelty detection.
Discussion
Infusions of scopolamine into dorsal CA3 (which decreased acetylcholine receptor activation) caused significant deficits for both spatial and nonspatial (visual object) novelty detection. It must be noted that the infusions of scopolamine were directly into dorsal CA3 and not systemic. This, presumably, is why there were no evident motor problems with the scopolamine infusion group. Also, it is of potential interest that the scopolamine infusion group did not display any abnormal behaviors during testing that would offer alternative interpretations of the data. When the animals did not re-explore the displaced objects, they passed near them but did not explore them, as if they did not detect the spatial change. Physostigmine infusions which increased acetylcholine receptor activation) resulted in enhanced spatial and nonspatial (visual object) novelty detection.
The present results support reports indicating that the attenuation of cholinergic projection neurons in medial septum and diagonal band of Broca by 192-IgG saporin infusions into the dorsal hippocampus causes encoding deficits on a Hebb-Williams Maze (Pereira, Cosquer, Schimchowitsch, & Cassell, 2005) in a manner similar to deficits seen after infusions of scopolamine into dorsal CA3 (Rogers & Kesner, 2004). These data support models that propose acetylcholine as a critical determinant of efficient encoding, consolidation, or retrieval (Hasselmo, 2005; Hasselmo & McGaughy, 2004; Hasselmo & Schnell, 1994; Hasselmo et al., 1995).
Previous work (Lee, Hunsaker, & Kesner, 2005) has shown that both DG and CA3 are necessary for spatial novelty detection as measured in an object and spatial recognition task. It is assumed that in that task the DG and CA3 were acting cooperatively with DG providing an orthogonal representation of space, which was passed into the dorsal CA3 via the mossy fiber inputs. It is assumed that in the present task, dorsal CA3 is using the orthogonal spatial information from the dorsal DG and using it to detect changes in a spatial configuration of objects. The present study was designed to test the role of the cholinergic modulation of CA3 for encoding of spatial information and spatial novelty detection.
Experiment 2
Material and Methods
Subjects
Eleven Long Evans rats served as subjects for this experiment. They weighed between 275 and 350 g when they arrived. Animals were free fed and had access to water ad libitum. The health of the animals was assessed weekly by a University of Utah IACUC veterinarian. All experimental procedures conformed to the NIH Guide for the Care and Use of Laboratory Animals, University of Utah IACUC, and AAALAC regulations and protocols
Surgical Method
Rats receiving selective transections of the dorsal CA3 subcortical efferents in the fimbria (FIMB n=5; CONTROL n=6) were anesthetized with Ketamine and Xylazine (55 mg/kg and 5-10 mg/kg i.p.). Burr holes were drilled above the lateral septum (anterior 0.6 mm and lateral 0.6-0.8 mm), dorsal fimbria (posterior 2.3 mm and lateral 3.2 mm), and dorsal CA3 (posterior 3.0 mm and lateral 3.0 mm). Coordinates were based upon studies of the hippocampo-septal system (McLennan & Miller, 1974; McNaughton & Miller, 1986) and by comparing two stereotaxic atlases (Kruger, Saporta, & Swanson, 1995; Paxinos & Watson, 1997). Bipolar recording electrodes from Plastics One were lowered into the lateral septum and dorsal CA3 and adjusted to obtain maximal signal of resting neural activity. Signals were amplified 2000 times (Grass-Telefactor P-3000; West Warwick, RI) and visualized using a virtual oscilloscope (SciWorks 3.0; Datawave Technologies; Berthoud, CO) on a PC computer running Windows XP (Microsoft Co.; Redmond, WA). Once all electrodes were in place and resting activity visualized, dorsal CA3 was stimulated using 0.4 ms duration square pulses at 0.5 Hz and 0.4 mA using an analog stimulator (Ortec 4710 Dual Channel Stimulator; Oak Ridge, TN), and stimulus isolation unit (Grass-Telefator PSIU-6D) and evoked potentials were recorded from the lateral septum.
Once the potentials were reliably evoked and visualized, the lateral septum was stimulated and responses from dorsal CA3 were evoked without manipulating the electrodes. Once both dorsal CA3 and lateral septal responses could be reliably evoked, electrodes remained untouched. Pre-transection evoked responses and theta were then collected for analysis. These potentials were exported to a spreadsheet and the maximal amplitudes of the responses were calculated after removal of the stimulus artifacts. Theta was analyzed by using SciWorks software to determine the frequency and power of theta for each animal both pre and post transection. Dorsal CA3 was stimulated at 0.33-0.5 Hz and responses in the lateral septum were visualized during the transection. A fine wire knife retracted into a small diameter handle was lowered to the ventro-lateral region of the fimbria (ventral approximately 5.0 mm). The blade was protracted and the ventrolateral portion of the fimbria was slowly transected while monitoring lateral septal responses to dorsal CA3 simulation until these responses were attenuated. Dorsal CA3 responses to lateral septum stimulation were then evoked, verifying that the cholinergic and GABAergic fibers in the fimbria from the medial septum and diagonal band of Broca were not significantly damaged. The knife was retracted to avoid further damage to the fimbria and removed. Post-transection evoked responses and theta were recorded for analysis. The transection was repeated in the other hemisphere for a bilateral selective transection of dorsal CA3 subcortical efferents. After surgery, all animals were allowed to recover in their home cages. CONTROL animals (n=6) received the neurophysiological procedure but did not receive a fimbria transection.
Behavioral Method
The behavioral apparatus and methodology was identical to that in Experiment 1, except that between Session 3 and Session 4 the animals in Experiment 2 were given a 15-minute intersession interval but no drugs were infused.
Histological Method
Each animal was sacrificed by an injection of 1 mL pentobarbital (70 mg/mL) and intracardially perfused with PBS and 10% formalin. The brain was stored at 4°C for 72 hours in a 30% sucrose/formalin solution. A tissue block containing the lateral septum, medial septum, and hippocampus was frozen and cut into 40 μm sections. For sections from animals with selective transections of dorsal CA3 subcortical efferents in the fimbria and CONTROL animals from Experiment 2, alternate sections were stained for acetylcholinesterase after the procedure of Karnovsky and Roots (1964) and nissl stained with cresyl violet.
Results
Histology
Figure 4a shows the locations of histologically verified electrode tips. Bilateral locations have been projected onto a single hemisphere (plate modified from Paxinos and Watson (1997)). Figure 4b shows the average results of pre- and post-fimbria transection evoked responses in dorsal CA3 to lateral septum stimulation (Figure 4bi) and lateral septum responses to dorsal CA3 stimulation (Figure 4bii). Twenty-eight consecutive evoked responses taken five minutes pre- and 10 minutes post-transection were compared statistically and used to calculate means. Dorsal CA3 responses evoked by stimulation of the lateral septum did not change pre- to post-transection, whereas the response in the lateral septum evoked by stimulation of dorsal CA3 was reduced in amplitude. Amplitude changes of the responses pre- and post-transection were analyzed by performing one-tailed t-tests using the statistics toolbox on MATLAB. There was a significant overall reduction in the amplitude of the evoked responses post-transection as compared to pre-transection, from (mean +/− SEM) 0.20 +/− 0.04 mV to 0.05+/− 0.02 mV (t(54)=14.19, p<0.0001). There was no significant change in the response amplitude in dorsal CA3 to lateral septal stimulation; from 0.28 +/− 0.07 mV to 0.30 +/− 0.06 mV (t(54)=−1.78, p=0.81). These results provide evidence that the partial fimbria transection did not significantly affect the hippocampal afferent fibers from the medial septum and diagonal band of Broca, only dorsal CA3 subcortical efferents. Theta was recorded to assess whether the transection of subcortical dorsal CA3 efferents dramatically changed baseline input from the medial septum and diagonal band of Broca and results are shown in Figure 5. Theta frequency and power were calculated using SciWorks software, after which pre- and post-transection correllograms were calculated for each measure. This was done to assess the change in theta frequency and power, not to measure raw frequency or power or theta per se. There was no significant change in theta frequency (t(18)=−0.09, p=0.46; cf. Figure 5a for pre-post frequency correllogram) or power (t(18)=-0.013, p=0.23; cf. Figure 5b for pre-post power correllogram). Raw traces of theta both pre- and post-transection are provided in Figure 5c. These results suggest theta was not significantly affected, which was expected since transections were selective to dorsal CA3 efferents and spared the cholinergic fibers from the medial septum and diagonal band of Broca.
Figure 4. Experiment 2 Histology.
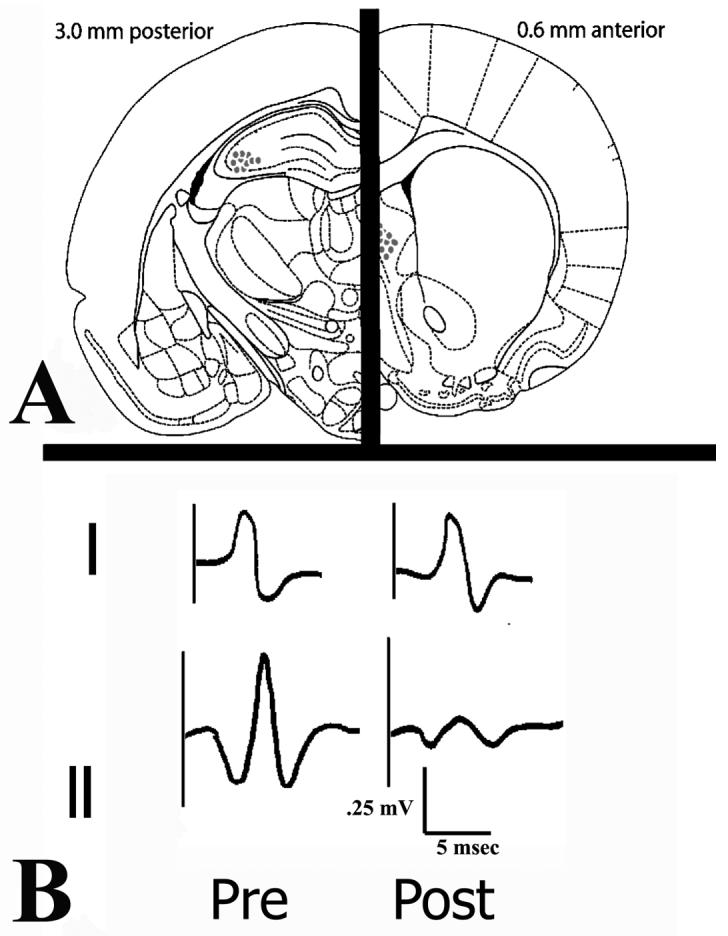
A. Histologically verified electrode tip locations. Bilateral locations have been imposed over a single hemisphere on a plate modified from Paxinos and Watson (1997). B. Tracings of evoked responses in dorsal CA3 (I. dorsal CA3 response evoked by LS stimulation) and LS (II. LS response evoked by dorsal CA3 stimulation). Notice the dorsal CA3 evoked response did not show a significant amplitude change whereas the lateral septal response changed dramatically post-transection.
Figure 5. Experiment 2 Theta.
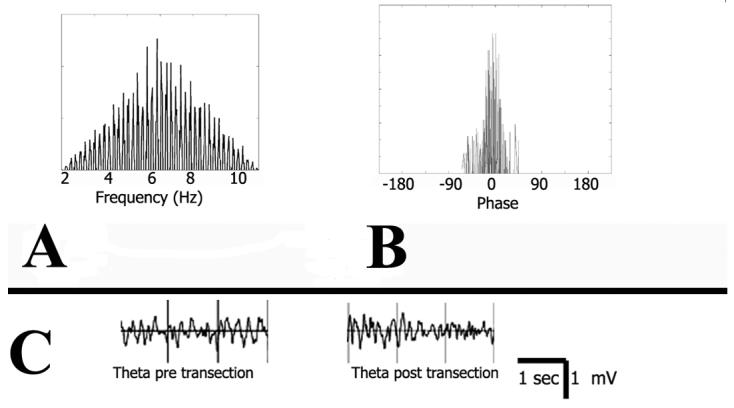
A. Frequency correllogram with pre-transection theta frequency compared to post-transection frequency. Frequency of theta did not change post-transection. B. Power correllogram with pre-transection power compared to post-transection power. Power of theta did not change pre- to post-transection. C. Raw traces of theta rhythm pre- and post-transection.
Figure 6a shows an acetylcholinesterase (AChE) stained section from a rat that had received a transection of the dorsal CA3 subcortical efferents in the fimbria. The continued presence of AChE in the dorsal hippocampus and overlying cortices reflects a continued cholinergic presence. Normal AChE banding was also observed in the ventral hippocampus (Figure 6b). A control dorsal hippocampus stained for AChE is presented (Figure 6c—note that there is no difference between AChE staining in the section from a control animal and the section from an animal having received a partial fimbria transection).
Figure 6. Experiment 2 Acetylcholinesterase.
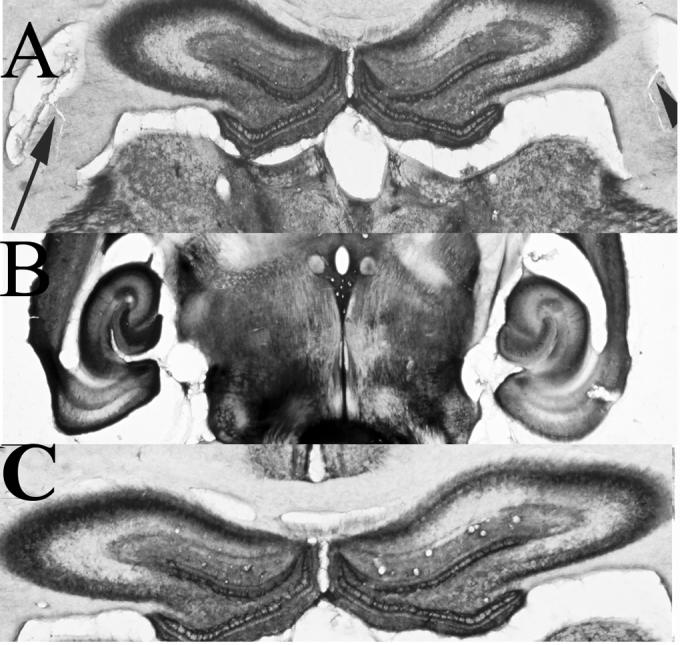
A. Acetylcholinesterase stain of rodent hippocampus showing continued presence of AChE as well as fimbria transection. Arrowheads point to bilateral fimbria transection. B. Ventral hippocampus stained for AChE after fimbria transection. C. Control brain processed for AChE. Note there were no differences between the control and transected brains with respect to AChE staining.
Behavioral Results
Locomotor Activity
To test whether FIMB and CONTROL animals decreased their locomotor activity as a function of Session (Figure 7a), a two-way repeated measures ANOVA was performed with groups as the between factor and Session as the within factor. There was no significant effect of group (F(1,76)=1.89, p=0.17), but there was a significant effect of Session since all animals decreased their grid crossings as a function of Session (F(6,76)=2.97, p=0.01). There was no interaction between group and Session (F(12,76)=0.87, p=0.52).
Figure 7. Results of Experiment 2.
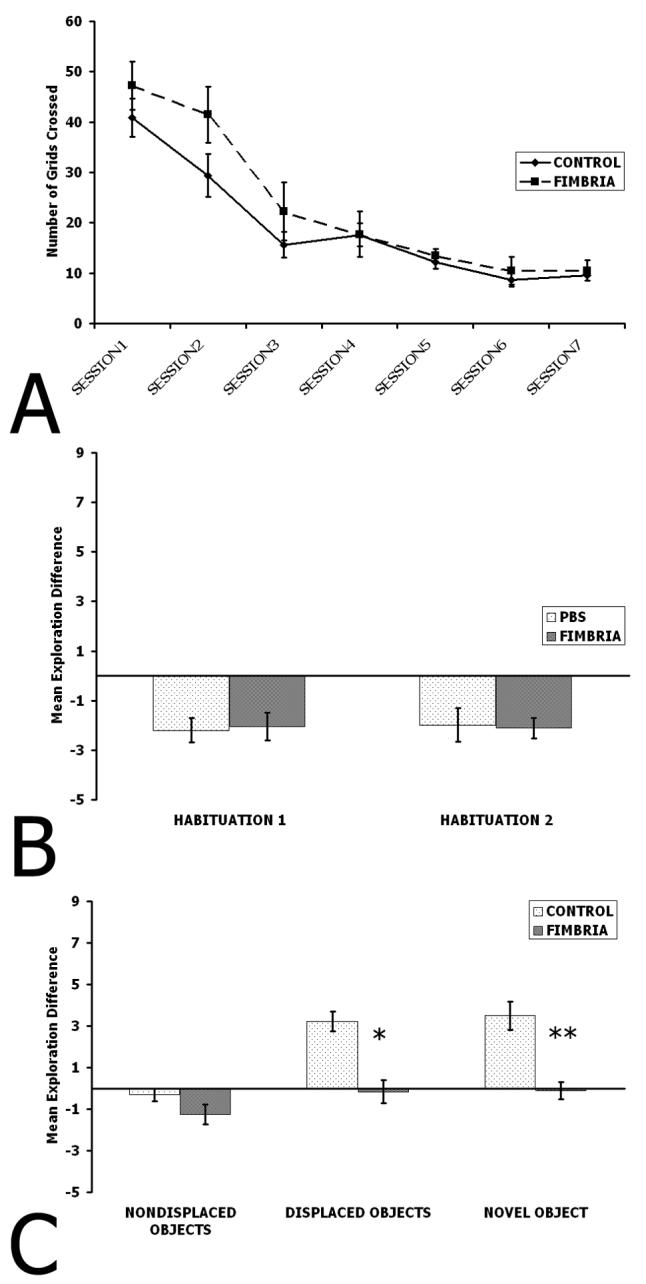
A. Habituation of locomotor activity as a function of Sessions. Notice that all animals exhibited similar levels of habituation across Sessions. B. Habituation of object exploration. Note that no animals differed from each other. C. Nondisplaced Object exploration, Displaced Object exploration, and Novel Object exploration. Note that no groups differed for Nondisplaced Object Exploration and that the FIMB group shows a pronounced deficit relative to the CONTROL group for both Displaced Object Exploration and Novel Object Exploration. *p<0.05, **p<0.01.
Object Exploration
Habituation data (Figure 7b) was analyzed by performing a one-way ANOVA with group as the between factor. There were no significant group differences when Sessions 2 and 3 were compared (Habituation 1) (F(1,10)=0.03, p=0.87), nor was there an effect when Sessions 3 and 4 were compared (Habituation 2) (F(1,10)=0.11, p=0.75). All animals habituated their object exploration during later Sessions compared to earlier Sessions. It appears the fimbria transection did not affect habituation. Nondisplaced object exploration (Figure 7c) was analyzed in the same manner, and there were no significant group effects (F(1,10)=2.52, p=0.15). Animals did not explore the nondisplaced objects after the spatial change.
Whether or not rats re-explored the displaced objects (Figure 7c) was analyzed by performing a one-way ANOVA. There was a significant group effect (F(1,10)=8.57, p=0.02). This result suggests that transecting the dorsal CA3 subcortical efferents in the fimbria disrupts spatial novelty detection. Selective exploration of a novel object introduced into the environment (Figure 7c) was analyzed by performing a one-way ANOVA. There was a significant group effect (F(1,10)=15.58, p=0.003). These results suggest that a fimbria transection causes deficits for visual object novelty detection
Discussion
Despite the lack of an effect between animals having a selective transection of dorsal CA3 subcortical efferents via the fimbria and control groups, it appears that there may be a subtle difference for exploratory activity during Session 2 between the groups. Even though this difference may exist, it appears to not significantly change any resulting analyses since during both Sessions 1 and 3 there were no group differences.
These data suggest that transecting dorsal CA3 efferents via the fimbria is sufficient to disrupt both spatial and nonspatial (visual object) novelty detection. These data demonstrate that the dorsal CA3 subcortical efferent fibers in the fimbria are involved in proper spatial and nonspatial (visual object) information processing.
Overall Discussion
The present experimental results suggest that the transection of dorsal CA3 subcortical efferents produced deficits in both spatial and nonspatial (visual object) novelty detection by reducing the quantity of ACh entering the hippocampus from the medial septum and diagonal band of Broca. For spatial information processing and nonspatial (visual object) information processing, disrupting subcortical efferents from dorsal CA3 produced deficits similar to those seen after infusions of scopolamine directly into dorsal CA3. Furthermore, the responses recorded during the fimbria transection suggest that there is a circuit between the hippocampus and septal nuclei, as has been shown previously (McLennan and Miller, 1974, McNaughton and Miller, 1986). This pathway offers a substrate for hippocampal control over the septal cholinergic inputs into the hippocampus.
The present data support the model proposed by Hasselmo and colleagues (Hasselmo & McGaughy, 2004; Hasselmo & Schnell, 1994; Hasselmo et al., 1995) that suggests that ACh controls the dynamics for encoding and consolidation or retrieval in dorsal CA3 by selectively affecting the recurrent collaterals. High levels of ACh increase the signal to noise ratio in the recurrent collaterals and facilitate long term potentiation in recurrent collateral synapses, both of these changes favor encoding of novel information over consolidation or retrieval of familiar information. Low levels of ACh decrease the signal to noise ratio and decreases long term potentiation in recurrent collaterals, favoring consolidation or retrieval of familiar information over encoding of novel information. A critical assumption of these models is that the hippocampus communicates with the medial septum and diagonal band of Broca, or at least signals them with information about current activity level within the hippocampus.
Hasselmo and colleagues proposed a putative “match/mismatch” process in CA1 that could provide a signal the hippocampus would send to the medial septum. A “match” or “mismatch” would be the result of comparisons between incoming information and information already in the system (Hasselmo & Schnell, 1994). They later expanded this theory to take CA3 activity into account (Hasselmo, 2005; Hasselmo et al., 1995), and even went as far as to propose a similar “match/mismatch” process in CA3 that may function similarly to that in CA1, but reflecting the mnemonic functions of CA3 (Hasselmo, 2005; cf. Rolls & Kesner, 2006).
These data suggest that dorsal CA3 subcortical efferents communicate a “match/mismatch” signal to the medial septum and diagonal band of Broca. In response to a “mismatch” signal, the medial septum and diagonal band of Broca would increase ACh release into the hippocampus via the cholinergic projections via the fimbria to facilitate efficient encoding of the novel information. A “match” signal would either signal the medial septum and diagonal band to attenuate ACh release into the hippocampus or else to maintain the baseline level to facilitate efficient consolidation or retrieval of the familiar information. A dearth of dorsal CA3 signal (caused by a transection of dorsal CA3 subcortical efferents via the fimbria) would leave the medial septum and diagonal band of Broca unable to react to dorsal CA3 activity levels (Hasselmo & McGaughy, 2004; Hasselmo & Schnell, 1994; Hasselmo et al., 1995). Scopolamine infusions into dorsal CA3, which reduce acetylcholine receptor activation, disrupted the heightened exploration in reaction to the spatial and nonspatial (visual object) changes relative to control animals and those receiving infusions of physostigmine into dorsal CA3. Conversely, physostigmine infusions into dorsal CA3, which increase acetylcholine receptor activation, resulted in significantly enhanced re-exploration of both the spatial and nonspatial (visual object) change. In comparison with these drug infusions into dorsal CA3, a transection of dorsal CA3 subcortical efferent axons in the fimbria caused deficits similar to those seen after infusions of scopolamine into dorsal CA3.
Since dorsal CA3 appears to be involved in rapid encoding of information (Hasselmo, 2005; Hasselmo et al., 1995; Rolls & Kesner, 2006), dorsal CA3 may send a “mismatch” signal to the medial septum and diagonal band of Broca to facilitate efficient encoding of information and efficient associative memory formation. The present data provide no data as to the nature of any dorsal CA1 signal, but Hasselmo and Schnell (1994) postulate the dorsal CA1 would send a “match” signal to the medial septum and diagonal band of Broca to attenuate cholinergic input into the hippocampus. This idea is congruent with theories proposing the mnemonic function of CA1 as a consolidation and/or retrieval mechanism (Hasselmo & Schnell, 1994; Rolls & Kesner, 2006). Any dorsal CA1 “match” signals would facilitate consolidation and/or retrieval in dorsal CA1, but would also affect dorsal CA3, if dorsal CA3 were unable to communicate a “mismatch” signal the medial septum and diagonal band of Broca about its own activity state, as was the case after the selective transection of dorsal CA3 subcortical efferents in the present task.
The present data demonstrate that dorsal CA3 influences the medial septum and diagonal band of Broca during learning. This result suggests that dorsal CA3 and the medial septum and diagonal band of Broca form a neural circuit that may be involved in controlling the dynamic activity state within the hippocampus via ACh to effectively encode or retrieve, based upon task demands and the mnemonic function of the particular subregion.
Acknowledgements
This research was supported by NSF IBN-0135273 and NIH R01MH065314 awarded to R. P. K.
Footnotes
Publisher's Disclaimer: This is a PDF file of an unedited manuscript that has been accepted for publication. As a service to our customers we are providing this early version of the manuscript. The manuscript will undergo copyediting, typesetting, and review of the resulting proof before it is published in its final citable form. Please note that during the production process errors may be discovered which could affect the content, and all legal disclaimers that apply to the journal pertain.
References
- Gaykema RP, van der Kuil J, Hersh LB, Luiten PG. Patterns of direct projections from the hippocampus to the medial septum-diagonal band complex: anterograde tracing with phaseolus vulgaris leucoagglutinin combined with immunohistochemistry of choline acetyltransferase. Neuroscience. 1991;43:349–360. doi: 10.1016/0306-4522(91)90299-4. [DOI] [PubMed] [Google Scholar]
- Gilbert PE, Kesner RP. Localization of function within the dorsal hippocampus: The role of CA3 in paired-associate learning. Behavioral Neuroscience. 2003;117:1385–1394. doi: 10.1037/0735-7044.117.6.1385. [DOI] [PubMed] [Google Scholar]
- Gilbert PE, Kesner RP, Lee I. Dissociating hippocampal subregions: a double dissociation between dentate gyrus and CA1. Hippocampus. 2001;11:626–636. doi: 10.1002/hipo.1077. [DOI] [PubMed] [Google Scholar]
- Hasselmo ME. The role of hippocampal regions CA3 and CA1 in matching entorhinal input with retrieval of associations between objects and context: theoretical comment on Lee et al. (2005) Behavioral Neuroscience. 2005;119:342–345. doi: 10.1037/0735-7044.119.1.342. [DOI] [PubMed] [Google Scholar]
- Hasselmo ME, Fehlau BP. Differences in time course of ACh and GABA modulation of excitatory synaptic potentials in slices of rat hippocampus. Journal of Neurophysiology. 2001;86:1792–1802. doi: 10.1152/jn.2001.86.4.1792. [DOI] [PubMed] [Google Scholar]
- Hasselmo ME, McGaughy J. High acetylcholine levels set circuit dynamics for attention and encoding and low acetylcholine levels set dynamics for consolidation. Progress in Brain Research. 2004;145:207–231. doi: 10.1016/S0079-6123(03)45015-2. [DOI] [PubMed] [Google Scholar]
- Hasselmo ME, Schnell E. Laminar selectivity of the cholinergic suppression of synaptic transmission in rat hippocampal region CA1: computational modeling and brain slice physiology. Journal of Neuroscience. 1994;14:3898–3914. doi: 10.1523/JNEUROSCI.14-06-03898.1994. [DOI] [PMC free article] [PubMed] [Google Scholar]
- Hasselmo ME, Schnell E, Barkai E. Dynamics of learning and recall at excitatory recurrent synapses and cholinergic modulation in rat hippocampal region CA3. Journal of Neuroscience. 1995;15:5249–5262. doi: 10.1523/JNEUROSCI.15-07-05249.1995. [DOI] [PMC free article] [PubMed] [Google Scholar]
- Hunsaker MR, Mooy GG, Swift J, Kesner RP. Program No. 66.2 Society for Neuroscience Abstracts (CD ROM) Society for Neuroscience; Atlanta, GA: 2006. Dissociating the role of the medial and lateral perforant path projection into dorsal CA3 and CA1 for spatial and nonspatial information processing. Online. [DOI] [PubMed] [Google Scholar]
- Hunsaker MR, Mooy GG, Swift J, Kesner RP. Dissociating the Medial and Lateral Perforant Path Projections into Dorsal Hippocampal Subregions for Spatial and Nonspatial Information Processing. Behavioral Neuroscience. 2006 doi: 10.1037/0735-7044.121.4.742. submitted. [DOI] [PubMed] [Google Scholar]
- Karnovsky MJ, Roots LA. “Direct-coloring” thiocholine method for cholinesterases. Journal of Histochemistry Cytochemistry. 1964;12:219–221. doi: 10.1177/12.3.219. [DOI] [PubMed] [Google Scholar]
- Kruger L, Saporta S, Swanson LW. Photographic atlas of the rat brain: the cell and fiber architecture illustrated in three planes with stereotaxic coordinates. Cambridge University Press; New York: 1995. [Google Scholar]
- Lee I, Hunsaker MR, Kesner RP. The role of hippocampal subregions in detecting spatial novelty. Behavioral Neuroscience. 2005;119:145–153. doi: 10.1037/0735-7044.119.1.145. [DOI] [PubMed] [Google Scholar]
- McLennan H, Miller JJ. The hippocampal control of neuronal discharges in the septum of the rat. Journal of Physiology. 1974;237:607–624. doi: 10.1113/jphysiol.1974.sp010500. [DOI] [PMC free article] [PubMed] [Google Scholar]
- McNaughton N, Miller JJ. Collateral specific long term potentiation of the output of field CA3 of the hippocampus of the rat. Experimental Brain Research. 1986;62:250–258. doi: 10.1007/BF00238844. [DOI] [PubMed] [Google Scholar]
- Paxinos G, Watson C. The rat brain in stereotaxic coordinates. 3rd ed. Academic Press; San Diego: 1997. [Google Scholar]
- Pereira PM, Cosquer B, Schimchowitsch S, Cassel J-C. Hebb-Williams performance and scopolamine challenge in rats with partial immunotoxic hippocampal cholinergic deafferentation. Brain Research Bulletin. 2005;64:381–394. doi: 10.1016/j.brainresbull.2004.09.007. [DOI] [PubMed] [Google Scholar]
- Poucet B. Object exploration, habituation, and response to spatial change in rats following septal or medial frontal cortical damage. Behavioral Neuroscience. 1989;103:1009–1016. doi: 10.1037//0735-7044.103.5.1009. [DOI] [PubMed] [Google Scholar]
- Raisman G, Cowan MW, Powell TPS. An experimental analysis of the efferent projection of the hippocampus. Brain. 1966;89:83–108. doi: 10.1093/brain/89.1.83. [DOI] [PubMed] [Google Scholar]
- Rogers JL, Kesner RP. Cholinergic modulation of the hippocampus during encoding and retrieval. Neurobiology of Learning and Memory. 2004;80:332–342. doi: 10.1016/s1074-7427(03)00063-7. [DOI] [PubMed] [Google Scholar]
- Rogers JL, Kesner RP. Cholinergic Modulation of the Hippocampus during Encoding and retrieval of tone/shock-induced fear conditioning. Learning and Memory. 2003;11:102–107. doi: 10.1101/lm.64604. [DOI] [PMC free article] [PubMed] [Google Scholar]
- Rolls ET, Kesner RP. A computational theory of hippocampal function and empirical tests of the theory. Progress in Neurobiology. 2006;79:1–48. doi: 10.1016/j.pneurobio.2006.04.005. [DOI] [PubMed] [Google Scholar]
- Swanson LW, Cowan MW. An autoradiographic study of the organization of the efferent connections of the hippocampal function in the rat. Journal of Comparative Neurology. 1977;172:49–84. doi: 10.1002/cne.901720104. [DOI] [PubMed] [Google Scholar]
- Swanson LW, Cowan MW. The connections of the septal region in the rat. Journal of Comparative Neurology. 1979;186:621–656. doi: 10.1002/cne.901860408. [DOI] [PubMed] [Google Scholar]
- Wallenstein GV, Hasselmo ME. GABAergic modulation of hippocampal population activity: sequence learning, place field development, and the phase precession effect. Journal of Neurophysiology. 1997;78:393–408. doi: 10.1152/jn.1997.78.1.393. [DOI] [PubMed] [Google Scholar]
- Wyss X, Swanson LW, Cowan WM. The organization of the fimbria, dorsal fornix, and ventral hippocampal commissure in the rat. Anatomy and Embryology. 1980;138:303–316. doi: 10.1007/BF00301819. [DOI] [PubMed] [Google Scholar]


