Abstract
Real-time monitoring of the translation of non-capped luciferase mRNA in a wheat germ cell-free system has been performed by continuous in situ measurement of the luminescence increase in the translation mixture. The phenomenon of acceleration of translation has been revealed. It has been shown that the acceleration is accompanied by the loading of translating polysomes with additional ribosomes, and thus is caused mainly by a rise in the initiation rate, rather than the stimulation of elongation or the involvement of additional mRNA molecules in translation. The acceleration requires a sufficient concentration of mRNA and depends on the sequence of the 5′ untranslated region (UTR). It can be abolished by the addition of excess cap analog (m7GpppGm). As the acceleration does not depend on the preliminary translation of other mRNAs in the same extract, the conclusion has been made that the effect is not due to activation of the ribosome population or other components of the system during translation, but rather it is the consequence of intra-polysomal events. The acceleration observed is discussed in terms of the model of two overlapping initiation pathways in eukaryotic polysomes: translation of non-capped mRNAs starts with eIF4F-independent initiation at 5′ UTR, and after the formation of sufficiently loaded polysomes, they rearrange in such a way that a mechanism of re-initiation of terminating ribosomes switches on. The eIF4F-mediated circularization of polysomes may be considered as a possible event that leads to the re-initiation switch and the resultant acceleration effect.
INTRODUCTION
Translation initiation is a crucial phase in protein synthesis. It is at this stage that translational control is realized both in prokaryotic and eukaryotic cells. Cell-free translation systems serve as an important tool for studying the molecular mechanisms of translation initiation. Analysis of changes during the course of translation in a cell-free system in response to the addition or omission of various factors, including specific proteins that affect the initiation process, is one of the principal experimental approaches to the study of initiation mechanisms.
The standard practice to determine the kinetic parameters of protein synthesis consists in collecting aliquots of a reaction mixture at consecutive time points and then determining the amount of protein synthesized by its specific activity or the incorporation of radioactive amino acids. This approach has two obvious limitations: first, it is technically complicated to collect aliquots more frequently than one per minute; second, the collection of aliquots with subsequent determinations of protein concentrations introduces a higher statistical data spread that decreases the accuracy of kinetic curve analysis. In light of this, it looks very attractive to measure the rate of protein synthesis directly in the reaction volume. More than a decade ago, it was proposed to use the cell-free synthesis of luciferase from American firefly Photinus pyralis to monitor the process of protein folding during translation (1). This enzyme catalyzes the conversion of luciferin substrate to its oxyform in the presence of ATP and molecular oxygen. The reaction proceeds with the emission of light. The method is based on the observations that the composition of the translation system is similar to the conditions of luciferase activity assay, and that the reaction substrate is not toxic to the translational apparatus. Thus, luciferin can be added to the translation system and the activity of the newly synthesized luciferase can be continuously recorded during incubation of the translation mixture in a luminometer cell. This method enables one to obtain smooth kinetic curves reflecting the accumulation of the active enzyme in real time with high accuracy.
Here we demonstrate the adequacy of the method for continuous monitoring of the rate of protein synthesis in a cell-free system. We show that we can independently study the contributions of the initiation and elongation stages to the overall process of translation. In this study, the attention was paid to some peculiarities of the translation of eukaryotic non-capped mRNAs. It has been found that (i) the rate of protein accumulation during translation of firefly luciferase non-capped mRNA (Luc-mRNA) in a wheat germ cell-free translation system is not constant but can increase in the course of translation, (ii) such an acceleration effect reflects mainly the increase of the initiation rate, rather than the involvement of new mRNA molecules in the translation process and (iii) the acceleration is due to the superimposition of a delayed cap analog-inhibited (presumably eIF4F-dependent) process on the primary cap-analog-insensitive (eIF4F-independent) process of initiation. The contribution of the second pathway has been shown to depend on 5′ UTR and concentration of mRNA.
MATERIALS AND METHODS
Enzymes and reagents
Restriction endonucleases NarI, XhoI and NdeI, T4 DNA ligase, T7 and SP6 RNA polymerases, creatine phosphokinase, creatine phosphate, RNase inhibitor, dNTPs and NTPs were obtained from Roche Diagnostics (Basel, Switzerland). Endonucleases BseAI and ClaI were obtained from MBI Fermentas (Burlington, Canada), HindIII and PstI from GibcoBRL (Carlsbad, California), and T4 polynucleotide kinase from Promega (Madison, Wisconsin). Amino acids and polyadenylic acid were obtained from Sigma (USA), and spermidine was from Fluka (Buchs, Switzerland). Total yeast tRNA was from Boehringer Mannheim (Mannheim, Germany). [14C]leucine, [14C]ATP and m7GpppGm were purchased from Amersham/Pharmacia Biotech (Little Chalfont, UK). All ordinary chemicals were of the highest grade.
Plasmid constructions
Plasmid pGEMluc was purchased from Promega. It contains a segment of firefly luciferase cDNA (1698 bp long) including the complete luc ORF and 45 nt of 3′ UTR cloned into the pGEM3a vector under the control of the SP6 promoter. The product of SP6 transcription is luciferase mRNA with a 49-nt-long 5′ UTR that is claimed to be a part of the polylinker. Plasmid pT7luc described in (2) is a result of cloning luc ORF into the pT7-7 vector. T7 transcription of the plasmid produces mRNA with a 64-nt-long leader containing prokaryotic regulatory elements: Shine–Dalgarno and Epsilon sequences. The pTZ10Ωluc plasmid was constructed by cloning the HindIII–PstI fragment of the pΩluc plasmid described in (3) between HindIII and PstI sites of the pTZ19R vector (Fermentas). The 5′ UTR of the T7 transcription product includes the complete Ω sequence from the tobacco mosaic virus (TMV) RNA. The pTZβluc plasmid is a result of cloning the HindIII–PstI fragment of the pSP36T-lucA50 plasmid described in (4) between HindIII and PstI sites of the pTZ19R vector. Its T7 transcription results in an mRNA with the complete Xenopus β-globin 5′ leader sequence in 5′ UTR. pTZluc was constructed as follows: the pT7luc and pTZ19R plasmids were cleaved by NdeI and HindIII endonucleases, respectively, treated with S1 nuclease to blunt the ends, digested with PstI, mixed and joined by T4 DNA ligase. The resulting product, which encodes Luc-mRNA with short (GGGA) 5′ UTR, was selected by restriction analysis.
The pTZlucΔ1, pGEMlucΔ1 and pT7lucΔ1 plasmids were constructed from pTZluc, pGEMluc and pT7luc, respectively, by digestion with BseAI endonuclease and re-circularization with T4 DNA ligase. This removed a 513 bp (corresponding to 171 aa) long fragment from inside the luc sequence but kept the ORF position intact. The protein product length of this construct was 379 amino acids. pTZlucΔ2 plasmid was constructed similarly by removal of the NarI—ClaI 1332 bp long fragment (corresponding to 444 aa) from pTZluc. Sequences of all the constructs were checked by direct sequencing.
In vitro transcription
All the plasmids were linearized with XhoI endonuclease; the 3′ UTR sequence of 56 nt was the same in all the mRNA constructs.
In vitro transcription was performed according to (5) with minor modifications. The reaction mixture contained 50 μg/ml linearized plasmid, 200 U/ml T7 RNA polymerase, 200 U/ml RNase inhibitor, 100 μg/ml Ac-BSA, 6 mM each NTP, 0.05 mM [14C]ATP in 200 mM HEPES–KOH buffer, pH 8.0 with 28 mM MgCl2 and 40 mM DTT. The reaction was run for 2 h at 38°C. RNA was extracted with phenol/chlorophorm/NaOAc, pH 5.0. 0.3 volume of saturated LiCl was added and the mixture was kept on ice for 40 min. The RNA was pelleted by centrifugation at 14 000g for 10 min, dissolved in water and consecutively precipitated by ethanol from high (1.5 M NH3OAc) and low (0.3 M NaOAc) salt conditions. The pellet was washed twice with 70% ethanol, dried under vacuum and dissolved in Milli-Q-purified water. The RNA concentration was calculated from radioactive ATP incorporation measured by scintillation counting of ice-cold trichloroacetic acid (TCA) insoluble fraction. A typical yield was around 2.5 mg of target RNA per 1 ml of the reaction mixture.
The mRNA constructs were named after the corresponding template plasmids but with the prefix m instead of p (i.e. mTZluc, mGEMluc, etc.).
Cell-free protein synthesis in a wheat germ translation system
Wheat germ extract (WGE) was prepared from germs of wheat, sort Kazakhstanskaya 4, mainly according to the protocol of Erickson and Blobel (6) with a modification concerning germ-washing procedure (7) [for the detailed protocol see Ref. (8)]. The density of the WGE obtained was 246 OU260/ml. The final translation mixture contained 20% v/v WGE, 100 μg/ml creatine phosphokinase, 500 U/ml RNase inhibitor, 50 mg/ml yeast total tRNA, 0.1 mM each amino acid, 1 mM ATP, 0.6 mM GTP, 16 mM creatine phosphate in 40 mM HEPES–KOH buffer pH 7.6 with 1.8 mM Mg(OAc)2, 100 mM KOAc, 2.5 mM DTT and 0.25 mM spermidine. For in situ monitoring of protein synthesis, 0.1 mM luciferin was added. Reaction components were mixed on ice, adjusted to 80% of the final volume and incubated for 2 min at 25°C. Two microliter of 5-fold concentrated mRNA were diluted with 8 μl of the prepared mixture. A microcentrifuge tube with the sample was immediately put to the temperature-controlled cell of an MLT-2 (Hidex) luminometer, and the intensity of light emission was measured continuously by collecting the streaming data with the computer as a kinetic curve. Alternatively, up to 10 samples with various mRNA concentrations were incubated in the dry thermostat at 25°C and put in the luminometer cell cyclically one-by-one with 3 s exposition time. The luminescence data and the precise measurement time points were collected by computer in tabular form and further processed in the program SigmaPlot (SPSS Inc.) to give kinetic curves for all the samples from one experiment.
For the luciferase activity assay, 2.5 μl of the translation mixture were diluted in 47.5 μl of assay buffer containing 50 mM HEPES–KOH, pH 7.6, 100 mM KOAc, 5 mM Mg(OAc)2, 2.5 mM DTT, 0.1 mM luciferin. Samples were incubated for 3 min at 25°C, and the light intensity was measured in the MLT-2 luminometer.
Determination of protein elongation rate
One hundred microliter of the translation mixture without addition of exogenous leucine was incubated for 4 or 18 min at 25°C. 1.6 × 10⁶ DPM of [14C]leucine dissolved in 5 μl of water were added. After 2 min of further incubation at 25°C, 2 μl of 50 mM unlabeled leucine was added to the final concentration of 2.5 mM. Aliquots of 5 μl were collected every 0.5 min, chilled on ice, dissolved in 15 μl of dilution buffer (20 mM HEPES–KOH pH 7.6, 5 mM MgCl2, 100 mM KCl, 0.05% cycloheximide) and centrifuged in a Beckman TL100 rotor at 90 000 r.p.m. for 1 h at 4°C. [14C]leucine condensation in the supernatant was measured by scintillation counting of the hot TCA insoluble fraction and plotted versus chase time. From the time when the rate of incorporation of radioactivity sharply slowed down, one can determine the protein chain elongation time (transit time).
Sedimentation analysis of polysomes
A total of 150 μl of the translation mixture collected at a certain time point was chilled on ice, cycloheximide was added to final concentration of 0.01 mg/ml and the mixture was layered on the linear 15–45% sucrose gradient in 12 ml Beckman tubes. The gradient contained 25 mM Tris–HCl pH 7.6, 5 mM MgCl2, 100 mM KCl, 0.1 mM EDTA and 0.01 mg/ml cycloheximide. Samples were centrifuged for 2 h in a SW-41 rotor in a Beckman L5-65 ultracentrifuge at 37 000 r.p.m. and 4°C. A glass capillary was inserted to the bottom of the tubes, and the content was pumped out at a rate of 0.5 ml/min through the cell of Uvicord SII (Amersham/Pharmacia Biotech) photometer connected to the computer for data collecting. The optical density at 254 nm was measured continuously.
RESULTS
Real-time monitoring of luciferase synthesis in a wheat germ cell-free translation system
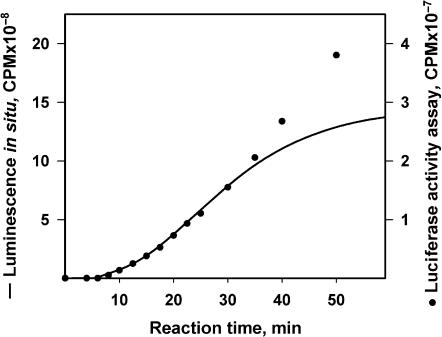
In order to minimize possible effects of specific 5′ UTRs, the leaderless non-capped luciferase mRNA (mTZluc) with just 4 nt (GGGA) preceding the start codon (AUG) (Figure 1) was chosen for our first experiments. Translation of this mRNA was found to be sufficiently productive. The time course of the luminescence intensity increase due to accumulation of luciferase activity in a wheat germ translation system is demonstrated in Figure 2. The introduction of luciferin to the translation mixture to the final concentration of 0.1 mM allows measurement of the activity of the newly synthesized protein directly in the reaction tube (Figure 2, solid curve). Under these conditions, the emission of a 10 μl reaction volume reaches 108–109 photon counts per minute (CPM) while background emission normally does not exceed 104 CPM. Specific luminescence amounts to ∼107 CPM/pmol of the synthesized enzyme. The statistical data spread does not exceed 0.1% of the total amplitude. Thus, the system demonstrates excellent sensitivity and signal-to-noise ratio.
Figure 1.
mRNA constructs used for in situ monitoring of firefly luciferase synthesis in cell-free translation system. All constructs contain the same luc coding sequence and the first 45 bases of the natural luc 3′ UTR. (A) mTZluc (‘leaderless Luc-mRNA’) has only the tetranucleotide sequence GGGA immediately preceding the coding sequence. (B) mGEMluc (‘Luc-mRNA with random leader’) has a 49-base arbitrary sequence from the polylinker of Promega pGEM3a vector as its 5′ UTR. (C) mT7luc (‘Luc-mRNA with prokaryotic leader’) has Shine-Dalgarno and the preceding UA-rich Epsilon enhancers (underlined) in its 5′ UTR. (D) mTZ10Ωluc (‘Luc-mRNA with Omega leader’) contains the 67-base leader sequence of TMV RNA, the so-called Ω sequence, within its 5′ UTR. (E) mTZβluc (‘Luc-mRNA with β-globin leader′) includes the 62-base leader sequence of Xenopus β-globin mRNA within its 5′ UTR.
Figure 2.
Comparison of two different methods for the analysis of active luciferase synthesis in a cell-free system. The leaderless Luc-mRNA (mTZluc) at concentration of 500 nM was translated in a 10 μl reaction volume containing luciferin with continuous recording of the luminescence intensity (continuous curve). Alternatively, the same concentration of mRNA was translated in larger volume and 2.5 μl aliquots were collected at certain intervals to perform the luciferase activity assay (filled circle).
However, the luminescence intensity of the reaction mixture depends not only on the amount of newly synthesized luciferase, but also on the concentrations of the enzyme substrates, luciferin and ATP, which can change in the course of translation. To make certain that the online data adequately reflects the synthesis of the active enzyme, we compared them with those obtained by collection of aliquots every 2.5 min with further determination of luciferase activity under standard concentrations of the substrates. Figure 2 shows that the time-course curves of the luciferase accumulation obtained by these two different methods coincide by shape within the first 25–30 min of incubation of the translation mixture. However, after 30 min the curves diverge: while the aliquot method still shows a linear increase, in the case of the in situ monitoring the plateau is reached soon after 40 min, which is most likely due to consumption of luciferin and ATP. Thus, the reliable analysis of the time course of translation can be based on the proposed method of the continuous monitoring of protein synthesis in the translation mixture, but only within the first 30 min of the incubation time.
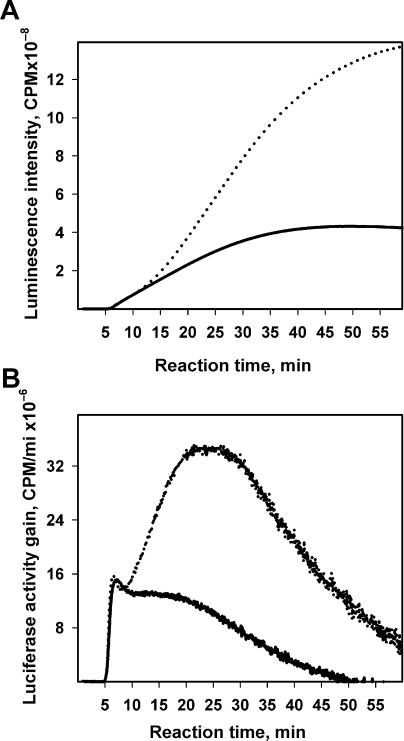
Figure 3 demonstrates the time-course curves obtained by the continuous monitoring of luciferase activity in the wheat germ system translating two different concentrations of the non-capped leaderless mRNA (mTZluc). A high signal-to-noise ratio permits numerical derivation of the data to obtain smooth curves reflecting changes in the rate of active enzyme accumulation (Figure 3B). The lag time between the start of translation and the appearance of the first active product can be measured quite precisely and amounts to 6 min. Earlier it was shown that the folding of luciferase occurs cotranslationally in both eukaryotic and prokaryotic translation systems, and the protein displays its activity immediately upon leaving the ribosome (1,2). Hence, the measured 6 min lag is the time required for the synthesis of the first full-sized protein chains, or the initial transit time for translating ribosomes. The further rise of luminescence intensity reflects the increase in the concentration of active luciferase as a result of its synthesis by following translating ribosomes.
Figure 3.
Time course of the synthesis of the functionally active luciferase in a wheat germ cell-free system at two different concentrations of mRNA. (A) Translation of the leaderless Luc-mRNA (mTZluc) at the concentrations of 250 nM (solid curve) and 500 nM (dotted curve). Luciferase activity was measured in situ by recording the luminescence of the reaction mixture. Data were collected every 1 s (B) Time derivatives of the curves in A.
Acceleration of protein synthesis occurs during progressing translation of non-capped mRNA
The most remarkable result of the experiment depicted in Figure 3 is that the time-course curve of the progressing translation of the uncapped luciferase mRNA is clearly biphasic. This is especially evident at higher mRNA concentration (500 nM) when the rate of protein synthesis starts to noticeably increase in the course of the translation reaction after 10 min of incubation, which is the time roughly equal to two lag periods, or two initial transit times; the maximum synthesis rate achieved by the 20–25th min exceeds the initial rate 2.5 times.
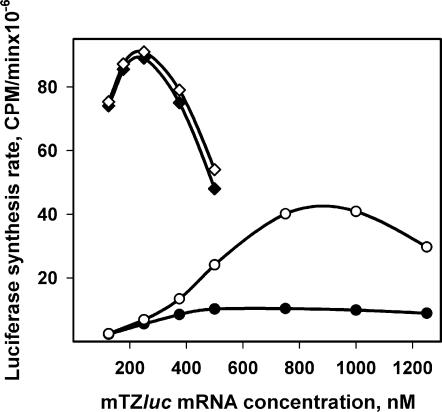
Figure 4 shows the dependence of the initial and maximum synthesis rates on the concentration of mTZluc mRNA in the translation system. The initial rate is defined as the average rate of luciferase accumulation during the first 5 min of translation after the first active product appeared. The maximum rate is determined from the maximum slope of the full time-course curve of luciferase accumulation. The difference between the initial and maximum synthesis rates at high mRNA concentrations implies the change in protein accumulation rate in the course of the translation reaction. As follows from Figure 4, in the case of the leaderless non-capped mRNA, the initial synthesis rate reached a plateau at mRNA concentration around 375 nM and then became independent of mRNA concentration. The maximum synthesis rate increases as mRNA rises to 800–1000 nM and then begins to decrease (displaying the ‘self-inhibition’ phenomenon due to sequestration of initiation factors by excess mRNA; see Ref. (9) for discussion).
Figure 4.
Dependence of luciferase synthesis rates on the concentrations of uncapped (filled circle) and capped (filled diamond) leaderless Luc-mRNA (mTZluc). Initial synthesis rate (filled symbols) was calculated as the averaged luciferase activity gain (the slope of the kinetic curve) during the 5 min after the first detectable appearance of active product. Maximum synthesis rate (hollow symbols) is the highest value achieved in the course of the translation reaction.
It is interesting that translation of the capped mTZluc mRNA does not manifest any acceleration during translation: it seems to be ‘accelerated’ from the beginning (Figure 4). As expected, the presence of the cap structure results in significant stimulation of the protein synthesis rate at low mRNA concentrations. However, due to the strong ‘self-inhibition’ effect of capped mRNA and a significant acceleration of translation of non-capped mRNA, the levels of translation of both mRNAs become closer to each other at higher mRNA concentrations.
The acceleration effect is also observed with non-capped natural leader sequences
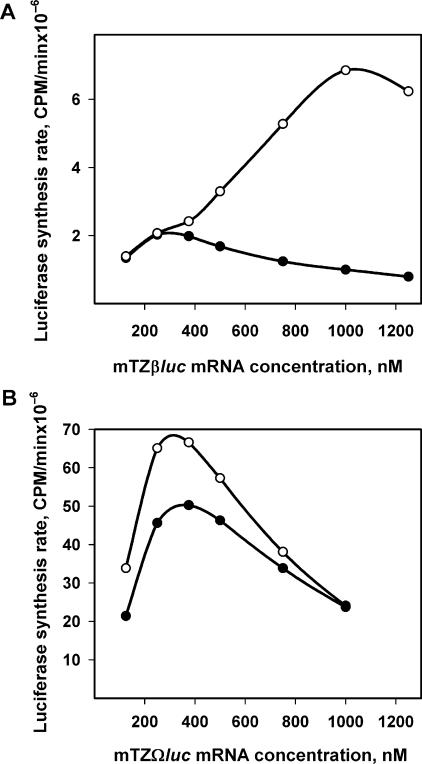
A very similar acceleration effect during translation can be observed also with non-capped mRNA that carries a natural leader sequence, such as β-globin mRNA leader (Figure 5A). In the case presented in the figure, the initial rate is relatively low, but the acceleration at high concentrations of the mRNA is very pronounced and reaches its maximum at 1 nmol of mRNA per ml, after which the self-inhibition starts to suppress translation.
Figure 5.
Dependence of luciferase synthesis rates on the concentrations of Luc-mRNAs with natural eukaryotic leaders. (A) Luc-mRNA with β-globin leader (mTZβluc). (B) Luc-mRNA with Omega leader (mTZΩluc). Initial (filled circle) and maximum (hollow circle) luciferase synthesis rates were defined as in the legend to Figure 4.
A somewhat different case is the translation of mRNA with the TMV RNA leader—the so-called Ω-leader (Figure 5B): translation of this non-capped construct (mTZ10Ωluc) is the most productive among the mRNAs tested and the acceleration effect, though is weaker than in the above described cases, takes place even at the lowest concentrations of the message. The acceleration effect at higher mRNA concentrations seems to be partially masked by the strong self-inhibition known to be intrinsic to Ω-carrying mRNAs [seemingly caused by sequestration of the initiation factor eIF4F due to its affinity for Ω-sequence; see Ref. (10)].
The acceleration effect strongly depends on the structure of 5′ UTRs
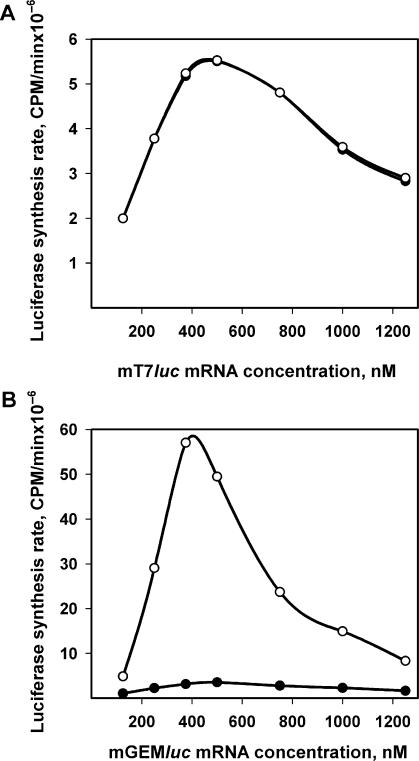
Two more mRNA constructs tested, namely mGEMluc mRNA with a 49 nt ‘random’ leader and mT7luc mRNA with a 63 nt ‘prokaryotic’ leader (Figure 1), demonstrate two extreme situations of the influence of 5′ UTR structures on the acceleration effect. In the case of mT7luc mRNA with prokaryotic-type 5′ UTR, the maximum synthesis rate is reached immediately and no acceleration occurs during further translation at any concentration of mRNA (Figure 6A).
Figure 6.
Dependence of luciferase synthesis rates on the concentrations of Luc-mRNAs with non-eukaryotic 5′ UTRs. (A) Luc-mRNA with prokaryotic leader (mT7luc). (B) Luc-mRNA with random leader (mGEMluc). Initial (filled circle) and maximum (hollow circle) synthesis rates were defined in the legend to Figure 4.
The opposite situation where acceleration is the most pronounced at any mRNA concentration is represented by the mGEMluc mRNA with an artificial (‘random’) leader (Figure 6B). Translation starts with very low initial rate values, and after approximately two rounds of weak translation, a strong acceleration takes place even at relatively low mRNA concentrations. As a result, despite the weak start, the maximum synthesis rate reaches values comparable with those obtained from translation of mTZ10Ωluc, the message with an effective viral leader.
Thus, the above two cases can be considered experimental models of different types of translational behavior of non-capped mRNAs in a eukaryotic system: the uniform rate process of translation at any concentration of mRNA (Figure 6A) and the process with accelerated translation where the highest effect is attained at some optimal concentration of mRNA (Figure 6B).
The time of the synthesis of one polypeptide chain remains constant during many rounds of translation
It is clear that the first active (full-sized) molecules of luciferase cannot appear in the reaction mixture before the first ribosomes finish reading the message. Therefore, the lag between the start of the reaction and the appearance of the first active product in the translation mixture can be interpreted as the time required for the synthesis of one protein molecule. As mentioned above (Figures 2 and 3) this time can be measured quite precisely and amounts to ∼6 min. This value, however, is liable to change in the course of the reaction, and the decrease in this time could be responsible for the acceleration effect during translation. In order to check whether the time of elongation changes or remains constant during the whole translation reaction, it should be measured at different time points. This can be done by blocking the initiation at different time points of the translation reaction by the addition of an inhibitory agent; then the measurements of the delays in the cessation of protein production will give the values for the time of the synthesis of one protein molecule.
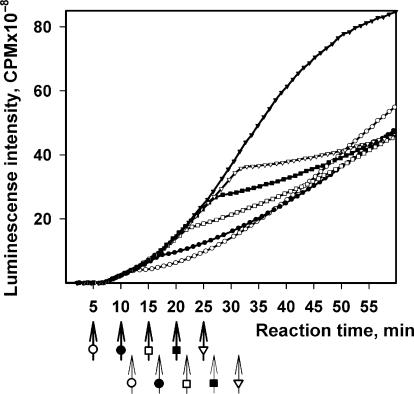
In this study, the inhibitory effect of exogenous poly(A) on the initiation of translation of non-capped mRNAs (11,12) has been used. Figure 7 shows that poly(A) at a concentration of 12.5 μM of adenylic residues added to a wheat germ cell-free system translating mTZluc mRNA (750 nM) inhibits translation with the time delay of 6–6.5 min, regardless of the time point when the addition has been made—after 5, 10, 15, 20 or 25 min of the system incubation. This delay time coincides with the time of the synthesis of the first protein chains (see above). Hence, the elongation time seems to be constant during the first 30 min of the translation reaction, and thus the changes in the protein synthesis rate (acceleration effect) should be explained by the processes during the initiation stage.
Figure 7.
Determination of protein chain synthesis time by the method of specific cessation of initiation with exogenous poly(A). A total of 0.5 μl of poly(A) solution was added at time points marked with ‘bold arrows’ to 10 μl reaction mixtures translating 500 nM of the leaderless Luc-mRNA (mTZluc). The final concentration of poly(A) corresponded to 12.5 μM adenylic residues. Time lag of the response to the addition of poly(A) (kink of the kinetic curves, thin arrows) was interpreted as the time required for the synthesis of one protein chain.
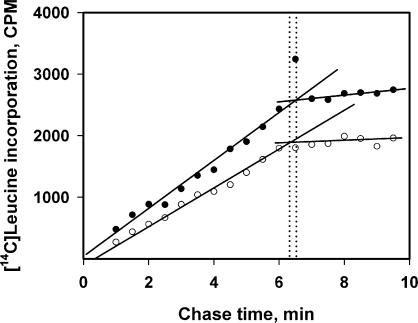
As an independent test for the invariance of the elongation time, the method described by Sørensen and Pedersen (13) for determination of the transit time in vivo was used with minor modifications in our in vitro system. Briefly the procedure is as follows. High-labeled [14C]leucine is added to the translation mixture at some time point during the translation run, and after a short incubation (2 min) the incubation mixture is diluted with a large excess of unlabeled leucine; the time course of the accumulation of radioactive full-length protein is measured during the subsequent chase period incubation. Time-course curves are shown in Figure 8. The time point when radioactivity reaches a plateau is interpreted as the joint time of elongation and termination, or transit time. It can be seen that the transit times measured after 5 and 18 min from the start of protein synthesis are roughly the same and equal to ∼6 min.
Figure 8.
Determination of luciferase elongation/termination time (transit time) after 4 min (hollow circle) and 18 min (filled circle) of translation of the leaderless Luc-mRNA (mTZluc) at the concentration of 500 nM by the pulse-chase method. The kinetics of accumulation of radioactivity in full-length protein after increasing chase periods. ‘Dotted lines’ indicate the estimations of transit time values (see Determination of protein elongation rate in the Materials and Methods section for details).
Acceleration is not caused by involvement of new mRNAs in translation, but rather reflects the increase of initiation rate
As the rate of elongation is constant in the course of the translation experiment, the acceleration of protein synthesis can be explained either by the change of initiation rate or by the involvement of new mRNA molecules into the translation process. At first glance, the dependence of the observed effects on the concentration of mRNA favors the latter explanation. The analysis of the time-course curves does not make possible a decision between the two possibilities. In order to solve this question, the analysis of a polysome distribution profile during the translation experiment has been undertaken. There is a clear test: if the elongation rate is constant, the ‘heavy shift’ in polysome profile (the increase of the number of ribosomes per mRNA) during translation will indicate the initiation rate rise [see, e.g. (14)].
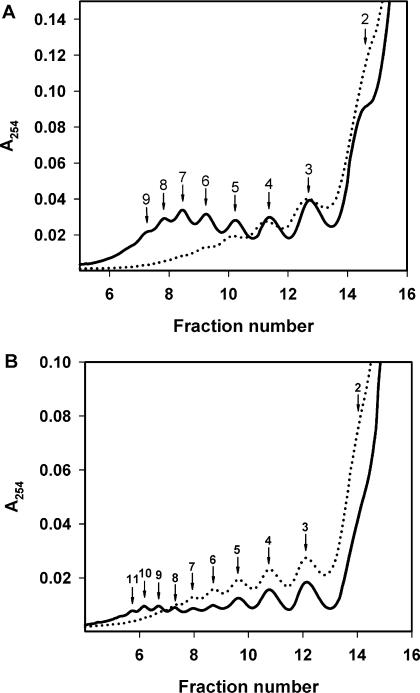
Polysomes formed after 10 min of translation and after 30 min of translation of the mTZluc mRNA were analyzed by ultracentrifugation in a linear sucrose gradient (Figure 9). The UV distribution profiles make it possible to reliably distinguish the peaks from di- to trisomes up to undeca- to dodecasomes. It is seen that under conditions where strong acceleration effect takes place (750 nM mRNA, Figure 9A) there is a very pronounced ‘heavy shift’ in polysome distribution that is expected for the case of the initiation rate rise. Some ‘heavy shift’ is also visible even in the case of a weaker acceleration (250 nM mRNA, Figure 9B). All this implies that the acceleration effect observed is caused mainly by the increase of the initiation rate on the same mRNA molecules, rather than by involvement of new mRNAs in translation. It must be underscored that aforementioned ‘initiation rate’ implies not the time taken to accomplish the sequence of initiation events (recognition, scanning, etc.) but the overall frequency of recruitment of ribosomes into mRNA translation.
Figure 9.
Formation of polysomes in the system translating the leaderless Luc-mRNA (mTZluc) at the concentrations of 750 nM (A) and 250 nM (B). Aliquots of 150 μl were collected after 10 min (dotted curves) and 30 min (solid curves) of translation and fractionated by centrifugation in 12 ml 15–45% sucrose gradient. Numbers indicate the size of polysomes in the corresponding peak.
The acceleration effect is switched off by cap analog
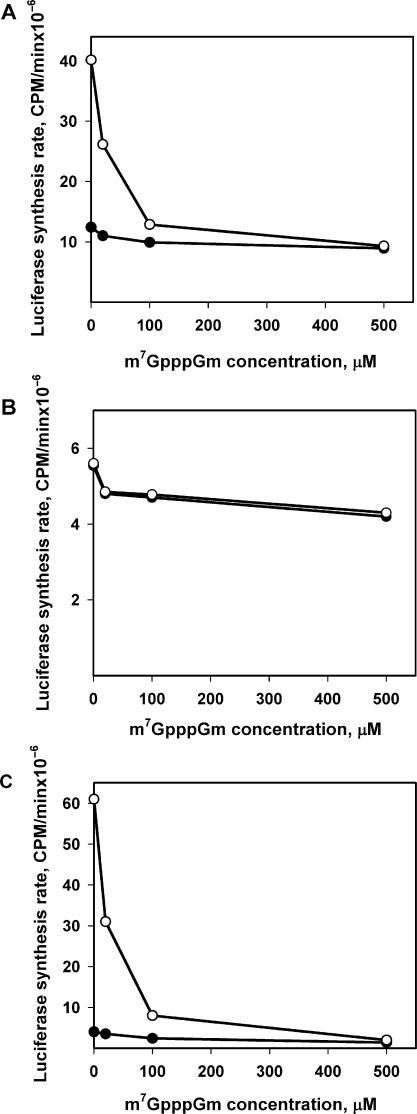
It is known that the addition of a cap analog (m7GpppGm) to a eukaryotic cell-free translation system traps the initiation factor eIF4F and thus inhibits translation of capped mRNAs, and also non-capped mRNAs in the cases when eIF4F is required for initiation [see, e.g. Ref. (15)]. Figure 10A shows the effect of different concentrations of m7GpppGm on the initial and maximum rates of translation of the non-capped leaderless luciferase mRNA. One can see that the effect on the initial protein synthesis is weak: even at the maximum cap-analog concentration used, the initial translation rate decreases by no more than 15–20%. On the contrary, the inhibition of the maximum synthesis rate is significant—at high m7GpppGm concentration it becomes equal to the initial rate, thus switching off the acceleration effect completely. All this implies that in the case of translation of a non-capped mRNA two different mechanisms of initiation can coexist and overlap: the eIF4F-independent pathway switched on from the very beginning of translation, and the later involved eIF4F-dependent pathway switched on only after the mRNA has been read out by many ribosomes.
Figure 10.
Effect of cap-analog (m7GpppGm) on the initial (filled circle) and maximum (hollow circle) rates of translation of Luc-mRNAs at the concentration of 500 nM. (A) Leaderless Luc-mRNA (mTZluc). (B) Luc-mRNA with prokaryotic leader (mT7luc). (C) Luc-mRNA with random leader (mGEMluc). Initial and maximum synthesis rates were determined as described in the legend to Figure 4.
Two different modes of initiation are also demonstrated by dissimilar responses to the cap analog (m7GpppGm) in the cases of Luc-mRNAs with artificial leader sequences, one of which provides only the slow phase in the course of translation and the second of which displays just acceleration without the slow phase of the time-course curve (see above Figure 6A and B, respectively). Thus, the translation of mT7luc mRNA is little affected by the cap analog: the shape of the time-course curve remains unchanged (data not shown) and the translation rate is diminished by only 20% even at the highest concentration of m7GpppGm (Figure 10B). At the same time, in the case of mGEMluc mRNA almost all translation is inhibited by m7GpppGm (Figure 10C).
The acceleration can be stimulated by the presence of a high concentration of another translatable mRNA
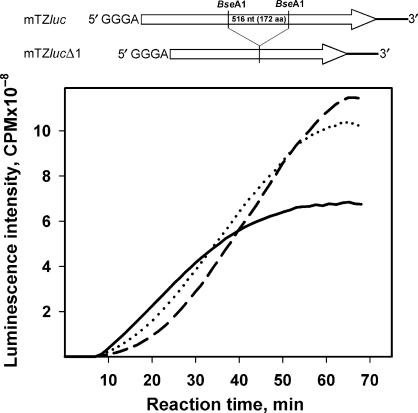
As seen from our first experiments (Figures 3 and 4), the acceleration effect in the course of translation of a non-capped mRNA in a cell-free system is especially displayed at high concentrations of mRNA. In order to check the possibility of some kind of feedback control of translation by the product of translation, a number of mutant mRNAs have been derived from Luc-mRNAs where no active luciferase can be formed as a result of their translation. In particular, a mutant leaderless mRNA (mTZlucΔ1) has been constructed which encodes for the polypeptide with the deletion of internal fragment comprising amino acid residues from 233 to 404 (the resulting polypeptide is to be of 378 residues). Translation of this construct is found to have about the same efficiency as that of the original full-length leaderless mTZluc mRNA, but the product is functionally inactive (data not shown). Nevertheless, when added to the translation mixture, this mutant mRNA stimulated acceleration of translation as much as the excess of the original Luc-mRNA (Figure 11). In these experiments, the translation of mTZluc mRNA in a low concentration has been performed in the presence of high concentrations of the mutant mTZlucΔ1 RNA, so that the total molar mRNA concentration reaches the region where the acceleration effect is well displayed (cf. Figure 4). The measured luminescence of the reaction volume reflected solely the synthesis of full-size luciferase, the product of mTZluc mRNA. One can see that the addition of mTZlucΔ1 to the system led to the appearance of the acceleration effect during translation of the full-size mRNA in low concentration. Moreover, the final enzyme yield estimated through the luciferase activity increased significantly in the presence of the mutant mTZlucΔ1 mRNA. Thus, the trans-stimulation of Luc-mRNA translation is observed upon the addition of an excess alien mRNA to the translation mixture.
Figure 11.
Effect of the addition of mRNA encoding for luciferase deletion mutant (minus 172 amino acid residues, see scheme at the top) to the system translated the full-sized luciferase mRNA. The leaderless Luc-mRNA (mTZluc) at the concentration of 50 nM was translated alone (solid curve) or in the presence of the mRNA with the deletion (mTZlucΔ1) at the concentrations of 450 nM (dotted curve) or 950 nM (dashed curve).
The acceleration effect is not the consequence of activation of terminated ribosomal subunits or any other components outside polysomes
In order to explain why several rounds of translation are required for the acceleration effect (presumably caused by the involvement of eIF4F in the process of initiation), and why alien mRNA molecules can act as trans-activators of the acceleration, the hypothesis could be proposed that terminated ribosomes (40S ribosomal subunits) preferentially interact with initiation factors, including eIF4F, and thus become specially activated for re-initiation. Further experiments, however, have shown that this is not the case.
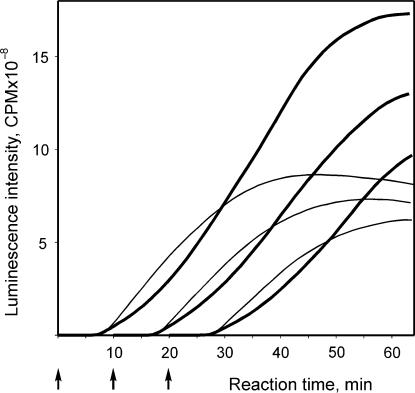
The most important observation is that the preliminary translation of ‘trans-accelerator’ mutant mRNA (mTZlucΔ1) for 10 or even 20 min before the addition of the luciferase-encoding mRNA (mTZluc) has almost no effect on the course of the acceleration of luciferase synthesis after the addition of Luc-mRNA (Figure 12). In other words, the preliminary translation of an alien mRNA has not prepared the system for accelerated translation of the newly added mRNA, and the acceleration effect is developed again from the beginning. Hence, the observed acceleration is not determined by changes in the surrounding medium of the reaction mixture as a result of translation (such as an accumulation of terminated ribosomes or activation of initiation factors and ribosomal subunits), but seems to be an internal characteristic process intrinsic to translating mRNA molecules or corresponding polysomes.
Figure 12.
Effect of preincubation of the translation system with another translatable mRNA. The translation system was incubated at 25°C with (bold curves) or without (thin curves) the mutant mRNA with deletion (mTZlucΔ1) at the concentration of 950 nM. At time points marked with arrows the leaderless Luc-mRNA (mTZluc) at a concentration of 50 nM was added to the reaction mixture. The accumulation of the full-size luciferase was the luminescence of the reaction mixture.
Trans-stimulation of the translation acceleration by the excess mRNAs depends on their 5′ UTRs and other structural features
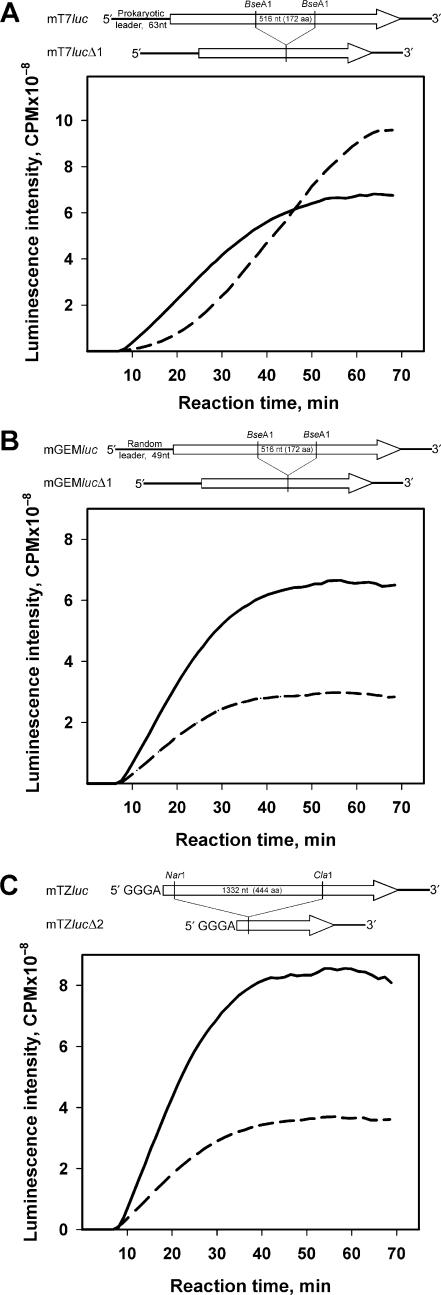
Further experiments show that, as in the case of the strong dependence of the acceleration effect on the structure of 5′ UTRs of individual mRNAs used for translation at high concentrations (Figures 5 and 6), similar requirements are found to hold true for alien ‘trans-accelerator’ mRNAs. The results are presented in Figure 13. The experiments were made with Luc-mRNAs that carry two different 5′ UTRs and have the same deletion as in the case of mTZlucΔ1 (Figures 11 and 12): mT7lucΔ1 mRNA with a ‘prokaryotic’ 63 nt leader and mGEMlucΔ1 mRNA with a ‘random’ 49 nt leader. Translation of the non-deleted mGEMluc and mT7luc mRNAs (Figure 6) showed that they behave in quite opposite ways: the first manifests a high acceleration effect at all mRNA concentrations, thus always being an accelerated message, whereas the other demonstrates no acceleration at any concentrations. Accordingly, the deletion mutants of these mRNAs, mT7lucΔ1 and mGEMlucΔ1, when added in excess to mTZluc mRNA that encodes the full-length luciferase, produce different effects on the luciferase synthesis: the first, after slight inhibition of the initial rate of translation, switches on the acceleration of translation of mTZluc mRNA, which make it an excellent ‘trans-accelerator’ (Figure 13A), while the other just causes a partial inhibition of the luciferase synthesis when added to the translation mixture (Figure 13B).
Figure 13.
Effect of the 5′ UTR sequence and the size of cotranslated mRNA on the acceleration of translation of luciferase mRNA. Solid curves—translation of the leaderless Luc-mRNA (mTZluc) alone at the concentration of 50 nM. Dashed curves—950 nM of luciferase deletion mutant mRNAs were added to the system: (A) mT7lucΔ1—mRNA with prokaryotic leader; (B) mGEMlucΔ1—mRNA with random leader; (C) the shortest mutant mRNA with GGGA 5′ UTR and the deletion of 1332 nt (mTZlucΔ2). Schemes at the top of the panels illustrate the construction of corresponding plasmid templates.
A proper 5′ UTR is found to be not the only requirement for the acceleration effect. The experiment with the use of another deletion mutant of the Luc-mRNA—namely mTZlucΔ2, where the short 5′ UTR (GGGA) is identical to that of the excellent ‘trans-accelerator’ mTZlucΔ1 mRNA (Figures 11 and 12), but the deletion comprises a significantly larger fragment (corresponding to amino acid residues from 12 to 456)—shows the absence of any ‘trans-acceleration’ effect (Figure 13C). Hence, either some structural elements inside ORF exist whose deletion causes the loss of the acceleration effect, or, more likely, a sufficient size of RNA (longer than 300–400 nt) is required to provide the acceleration effect (see Discussion section).
DISCUSSION
The precise in situ analysis of the time course of cell-free protein synthesis has revealed several unexpected peculiarities of the translation of non-capped mRNAs in a eukaryotic system. First of all, it has been demonstrated that the rate of translation initiation of a non-capped mRNA can significantly increase in the course of a translation experiment. This acceleration is observed only after formation of polysomes and multiple reading out of the full-length mRNA chain by ribosomes; the rise of the rate is clearly visible after two full transit times and further. The rate of elongation (transit time) remains constant. The acceleration proceeds without involving new mRNA molecules in the translation process. Correspondingly, the stimulation is accompanied by the loading of translating polysomes with additional ribosomes (heavy shift of polysome profile).
The structure of 5′ UTR of mRNA makes a noteworthy contribution to the acceleration effect: luciferase mRNAs, all of which have an identical luc ORF and 3′ UTR, display notably variable levels of acceleration depending on the sequences of their 5′ UTRs. This ranges from the entire absence of acceleration to a pronounced effect with a many-fold increase in the translation rate. In any case, the acceleration effect with non-capped mRNAs can be eliminated by the addition of a cap analog (m7GpppGm) to the translation mixture, which suggests the participation of the initiation factor eIF4F in the second (accelerated) phase of translation. Translation of capped mRNA does not display the initial slower phase typical of non-capped mRNA and starts directly from the accelerated mode of initiation.
The acceleration is stimulated by high concentrations of mRNA, where the excess mRNA remains untranslated (silent). The similar stimulation can also be caused by the addition of sufficient concentrations of mRNAs that do not encode the same product. Thus, the trans-stimulation is observed in both cases, and it is realized not through the product of translation.
It is worth noting that the acceleration of translation of a given mRNA does not depend on preliminary incubation or translation of another translatable mRNA in the same extract, which implies that the effect is not due to the activation of the monoribosome population or other components of the extract during translation. This observation leads to the conclusion that in the course of the translation experiment in a eukaryotic cell-free system with non-capped mRNA something happens inside translating polysomes that results in a rise in the initiation rate of polysomal mRNA and thus in the acceleration of loading of the polysomes with new ribosomes.
Earlier, the acceleration of protein synthesis was observed by Gallie when certain luciferase mRNA constructs were translated in vivo in carrot protoplasts (10). The effect also was described in the terms of first-round and further translation. It was dependent on capping and polyadenylation of mRNA. Although no in vitro kinetic data were adduced in support, these data can be considered as an independent in vivo confirmation of the acceleration phenomenon.
In order to explain this phenomenon and all relevant observations made here, the model of two overlapping initiation pathways in eukaryotic polysomes (16–18) has been revived. According to the model, free ribosomes (ribosomal subunits) in the ribosomal pool initiate translation at the 5′ UTR of polysomal mRNA, but with a relatively slow rate, while terminating ribosomes reinitiate translation on the same mRNA with a higher rate. This results in a slow exchange of translating ribosomes with the pool of free ribosomes, which was observed both in vivo and in vitro. The model implied that in polysomes ‘the 3′-end (termination site) of mRNA should be close to the 5′-end (initiation site) of the same mRNA’ (18), and the polysomes should be arranged ‘in closed circle configuration’ (16). Later, progress in understanding the role of the poly(A) tail in the initiation of translation on eukaryotic mRNAs has led to the idea of interaction between the 5′-cap structure and the poly(A) sequence via a poly(A)-binding protein (PABP) bridge as a prerequisite for efficient initiation: the so-called closed-loop model (19). A functional ‘synergy’ between the cap and the poly(A) tail of eukaryotic mRNAs was proclaimed even earlier (20). The idea was further supported by the discovery of direct association of PABP with the large subunit (eIF4G) of the cap-binding initiation factor eIF4F and visualization of the physical circularization of mRNA complexed with eukaryotic translation initiation factors eIF4E/eIF4G and PABP (21–23). Recently, using the cell-free system based on WGE Endo with coworkers (24) visualized the formation of circular polysomes (visible mainly as ‘double rows’ on electron micrographs) in the case when neither a poly(A) tail nor a cap structure were present in the mRNA used for translation.
Adapting the model for our case, it can be proposed that translation of non-capped mRNAs in a eukaryotic extract starts with eIF4F-independent initiation at a 5′ UTR; then, after the formation of sufficiently loaded polysomes, they rearrange in such a way that the second mechanism, re-initiation of terminating ribosomes with the participation of eIF4F, switches on. Thus, beginning from this later stage of translation, the two overlapping initiation pathways coexist. Gradual switching on of re-initiation is manifested as a rise in the total initiation rate during translation experiment. The eIF4F (eIF4G)-mediated circularization of polysomes after attaining some level of loading of mRNA with ribosomes may be considered a possible event leading to the re-initiation switch and the resultant acceleration effect. Indeed, while the early polysomes in a cell-free system look linear, the polysomes formed at later stages of translation are represented by ‘double rows’ (V. A. Shirokov and V. D. Vasiliev, personal communication).
The substantial observation made from the experiments presented here is that the acceleration effect requires a sufficient level of saturation of the extract with silent mRNA molecules. An explanation of this phenomenon may follow from the character of eukaryotic extracts: they contain excess mRNA-binding proteins, predominantly of the YB family type, which can form cooperative complexes with exogenous mRNAs added to the extract (25,26). At high YB/mRNA ratio the mRNA-bound protein YB-1 forms a giant multimer (ca. 700 kDa), which comprises about 20 monomeric subunits and packs a 600–700 nt segment of mRNA on its surface (26). Formation of such complexes with translated mRNA may prevent the above-mentioned polysome rearrangement, and the partial sequestration of the mRNA-binding proteins by excess mRNA could be the simplest explanation of the requirement for a sufficiently high total concentration of mRNA in the extract in order to provide the acceleration effect. Moreover, the complex formation of mRNA with protein YB-1 was reported to displace eIF4G from mRNA and thus inhibit eIF4F-dependent initiation of translation, without affecting elongation (27). This information gives a direct factual ground for blocking acceleration by excess protein YB in a eukaryotic extract at low mRNA concentrations and removing the block under high mRNA concentrations. It seems that the presence of cap structure on mRNA enhances the affinity of eIF4F for mRNA and thus counteracts protein YB, which results in successful eIF4F-dependent initiation even at low mRNA concentrations (Figure 4). This new aspect of the functional role of cap structure, namely the interrelation between cap structure of mRNA and YB as a major mRNA-binding protein of the eukaryotic cytoplasm, may deserve special attention in future studies.
From the properties of the cooperative mRNA–YB complexes (26) and the occurrence of displacement of eIF4F from mRNA upon the cooperative complex formation (27) the prediction can be made that relatively short mRNAs, of length up to 500–600 nt, should not serve as proper traps for proteins of the YB family and hence could not stimulate the acceleration observed here. Indeed, this has been found to be the case: the mutant Luc-mRNA with the deletion of 1332 nt (mTZlucΔ2, ∼350 nt in length) does not stimulate the acceleration (Figure 13C).
As the capping of synthetic mRNAs for translation in cell-free systems is an expensive and impractical procedure, it is evident that studies of the translation of non-capped mRNAs can be beneficial for improvements of cell-free translation methodologies. At the same time, this work demonstrates that experiments with cell-free translation of non-capped mRNAs can disclose a number of new properties in the natural mechanisms of translation initiation in eukaryotes. Thus, in this work with non-capped mRNA, the evidence has been obtained in favor of the existence of at least three earlier shaded phenomena in eukaryotic initiation mechanisms: (i) the eIF4F-independent ‘slow’ initiation at 5′ UTR, which is normally hidden by the more efficient cap-dependent initiation process; (ii) the cap-independent involvement of eIF4F in initiation (seemingly, re-initiation) at later stages of translation, after the formation of loaded (probably, circularized) polysomes and (iii) a significant contribution to initiation process of the major mRNA-binding proteins (YB family) massively present in the eukaryotic cytoplasm.
ACKNOWLEDGEMENTS
We are grateful to Victor Vasiliev, Vladimir Shirokov and Vyacheslav Kolb for helpful discussions. We thank Danielle Reifsnyder for critical reading of the manuscript. This work was supported by grant from the President of the Russian Federation (2238.2006.4), and by the Program on Molecular and Cellular Biology of the Russian Academy of Sciences. Funding to pay the Open Access publication charges for this article was provided by the Institute of Protein Research, Russian Academy of Sciences.
Conflict of interest statement. None declared.
REFERENCES
- 1.Kolb VA, Makeyev EV, Spirin AS. Folding of firefly luciferase during translation in a cell-free system. EMBO J. 1994;13:3631–3637. doi: 10.1002/j.1460-2075.1994.tb06670.x. [DOI] [PMC free article] [PubMed] [Google Scholar]
- 2.Kolb VA, Makeyev EV, Spirin AS. Co-translational folding of an eukaryotic multidomain protein in a prokaryotic translation system. J. Biol. Chem. 2000;275:16597–16601. doi: 10.1074/jbc.M002030200. [DOI] [PubMed] [Google Scholar]
- 3.Zeyenko VV, Ryabova LA, Gallie DR, Spirin AS. Enhancing effect of the 3′-untranslated region of tobacco mosaic virus RNA on protein synthesis in vitro. FEBS Lett. 2004;354:271–273. doi: 10.1016/0014-5793(94)01126-5. [DOI] [PubMed] [Google Scholar]
- 4.Wakiyama M, Futami T, Miura K. Poly(A) dependent translation in rabbit reticulocyte lysate. Biochemistry. 1997;79:781–785. doi: 10.1016/s0300-9084(97)86937-4. [DOI] [PubMed] [Google Scholar]
- 5.Pokrovskaya ID, Gurevich VV. In vitro transcription: preparative RNA yields in analytical scale reactions. Anal. Biochem. 1994;220:420–423. doi: 10.1006/abio.1994.1360. [DOI] [PubMed] [Google Scholar]
- 6.Erickson AH, Blobel G. Cell-free translation of messenger RNA in a wheat germ system. Methods Enzymol. 1983;96:38–50. doi: 10.1016/s0076-6879(83)96007-x. [DOI] [PubMed] [Google Scholar]
- 7.Madin K, Sawasaki T, Ogasawara T, Endo Y. A highly efficient and robust cell-free protein synthesis system prepared from wheat embryos: plants apparently contain a suicide system directed at ribosomes. Proc. Natl Acad. Sci. USA. 2000;97:559–564. doi: 10.1073/pnas.97.2.559. [DOI] [PMC free article] [PubMed] [Google Scholar]
- 8.Shirokov VA, Kommer A, Kolb VA, Spirin AS. Continuous-exchange protein-synthesizing systems. In: Grandi G, editor. Methods in Molecular Biology, vol. 375: In Vitro Transcription and Translation Protocols. 2nd. Totowa, NJ: Humana Press; 2007. pp. 19–55. [DOI] [PubMed] [Google Scholar]
- 9.Shaloiko LA, Granovsky IE, Ivashina TV, Ksenzenko VN, Shirokov VA, Spirin AS. Effective non-viral leader for cap-independent translation in a eukaryotic cell-free system. Biotechnol. Bioeng. 2004;88:730–739. doi: 10.1002/bit.20267. [DOI] [PubMed] [Google Scholar]
- 10.Gallie DR. The 5′-leader of tobacco mosaic virus promotes translation through enhanced recruitment of eIF4F. Nucleic Acids Res. 2002;30:3401–3411. doi: 10.1093/nar/gkf457. [DOI] [PMC free article] [PubMed] [Google Scholar]
- 11.Gallie DR, Tanguay R. Poly(A) binds to initiation factors and increases cap-dependent translation in vitro. J. Biol. Chem. 1994;269:17166–17173. [PubMed] [Google Scholar]
- 12.Le H, Tanguay RL, Balasta ML, Wei CC, Browning KS, Metz AM, Goss DJ, Gallie DR. Translation initiation factors eIF-iso4G and eIF-4B interact with the poly(A)-binding protein and increase its RNA binding activity. J. Biol. Chem. 1997;272:16247–16255. doi: 10.1074/jbc.272.26.16247. [DOI] [PubMed] [Google Scholar]
- 13.Sørensen MA, Pedersen S. Determination of the peptide elongation rate in vivo. In: Martin R, editor. Protein Synthesis, Methods and Protocols. Totowa, NJ: Humana Press; 1998. pp. 129–142. [DOI] [PubMed] [Google Scholar]
- 14.Spirin AS, Ryazanov AG. Regulation of elongation rate. In: Trachsel H, editor. Translation in Eukaryotes. Boca Raton, FL: CRC Press; 1991. pp. 325–350. [Google Scholar]
- 15.Jackson RJ, Hunt SL, Reynolds JE, Kaminski A. Cap-dependent and cap-independent translation: operational distinctions and mechanistic interpretations. Curr. Top. Microbiol. Immunol. 1995;203:1–29. doi: 10.1007/978-3-642-79663-0_1. [DOI] [PubMed] [Google Scholar]
- 16.Philipps GR. Haemoglobin synthesis and polysomes in intact reticulocytes. Nature. 1965;205:53–56. doi: 10.1038/205567a0. [DOI] [PubMed] [Google Scholar]
- 17.Adamson SD, Howard GA, Herbert E. The ribosome cycle in a reconstituted cell-free system from reticulocytes. Cold Spring Harbor Symp. Quant. Biol. 1969;34:547–554. doi: 10.1101/sqb.1969.034.01.062. [DOI] [PubMed] [Google Scholar]
- 18.Baglioni C, Vesco C, Jacobs-Lorena M. The role of ribosomal subunits in mammalian cells. Cold Spring Harbor Symp. Quant. Biol. 1969;34:555–565. doi: 10.1101/sqb.1969.034.01.063. [DOI] [PubMed] [Google Scholar]
- 19.Jacobson A. Poly(A) metabolism and translation: the closed-loop model. In: Hershey JWB, Mathews MB, Sonenberg N, editors. Translational Control. NY: CSHL Press; 1996. pp. 451–480. [Google Scholar]
- 20.Gallie DR. The cap and poly(A) tail function synergistically to regulate mRNA translational efficiency. Genes Dev. 1991;5:2108–2116. doi: 10.1101/gad.5.11.2108. [DOI] [PubMed] [Google Scholar]
- 21.Tarun SZJ, Sachs AB. Association of the yeast poly(A) tail binding protein with translation initiation factor eIF-4G. EMBO J. 1996;15:7168–7177. [PMC free article] [PubMed] [Google Scholar]
- 22.Well SE, Hillner PE, Vale RD, Sachs AB. Circularization of mRNA by eukaryotic translation initiation factors. Mol. Cell. 1998;2:135–140. doi: 10.1016/s1097-2765(00)80122-7. [DOI] [PubMed] [Google Scholar]
- 23.Preiss T, Hentze MW. From factors to mechanisms: translation and translational control in eukaryotes. Curr. Opin. Genet. Dev. 1999;9:515–521. doi: 10.1016/s0959-437x(99)00005-2. [DOI] [PubMed] [Google Scholar]
- 24.Madin K, Sawasaki T, Kamura N, Takai K, Ogasawara T, Yazaki K, Takei T, Miura K-I, Endo Y. Formation of circular polyribosomes in wheat germ cell-free protein synthesis system. FEBS Lett. 2004;562:155–159. doi: 10.1016/S0014-5793(04)00221-2. [DOI] [PubMed] [Google Scholar]
- 25.Spirin AS. The second Sir Hans Krebs lecture: informosomes. Eur. J. Biochem. 1969;10:20–35. doi: 10.1111/j.1432-1033.1969.tb00651.x. [DOI] [PubMed] [Google Scholar]
- 26.Skabkin MA, Kiselyova OI, Chernov KG, Sorokin AV, Dubrovin EV, Yaminsky IV, Vasiliev VD, Ovchinnikiv LP. Structural organization of mRNA complexes with major core mRNP protein YB-1. Nucleic Acids Res. 2004;32:5621–5635. doi: 10.1093/nar/gkh889. [DOI] [PMC free article] [PubMed] [Google Scholar]
- 27.Nekrasov MP, Ivshina MP, Chernov KG, Kovrigina EA, Evdokimova VM, Thomas AAM, Hershey JWB, Ovchinnikov LP. The mRNA-binding protein YB-1 (p50) prevents association of the eukaryotic initiation factor eIF4G with mRNA and inhibits protein synthesis at the initiation stage. J. Biol. Chem. 2003;278:13936–13943. doi: 10.1074/jbc.M209145200. [DOI] [PubMed] [Google Scholar]


