Abstract
The Golgi staining method has served neuroscience well for more than a century. In this assay I review recent progresses using genetic methods to recapitulate and extend the Golgi staining method. These methods enable new discoveries on organization and development of neuronal circuits in the fly and mouse brains.
Introduction
Characterizing the complex organization of the central nervous system can be simplified by first analyzing smaller subsets of neuronal populations. The Golgi staining method randomly labels a small population of neurons in a piece of nervous tissue; once a neuron is labeled, its dendritic and axonal processes can be (almost) completely visualized against unlabeled background (Golgi, 1873). The enormous impact of Golgi staining to our understanding of the organization, development and function of nervous systems have been extensively reviewed (Cajal, 1911; Swanson, 2003).
Golgi staining is still widely used today, for instance to analyze neuronal projections in specific areas of the nervous system or gene knockout phenotypes with single neuron resolution. Despite its wide applications, Golgi staining has several limitations. First, although Golgi staining can usually label complex dendritic trees completely, it does not always reliably label all axonal branches and fine terminal arborizations. Second, the Golgi technique cannot label neurons in live tissues or organisms because the staining requires sample fixation. Third, Golgi staining does not allow genetic manipulations of labeled neurons for mechanistic studies of how individual neurons acquire their elaborate morphology and how groups of neurons form intricate circuits. Fortunately, these limitations can now be overcome by genetic methods.
In this essay, I summarize recent progress in the development of genetic methods to label single neurons that recapitulate and extend the Golgi staining method. I discuss the applications of these methods in studies of the development and organization of nervous systems by focusing primarily on the work from our lab in flies and mice.
Fly MARCM
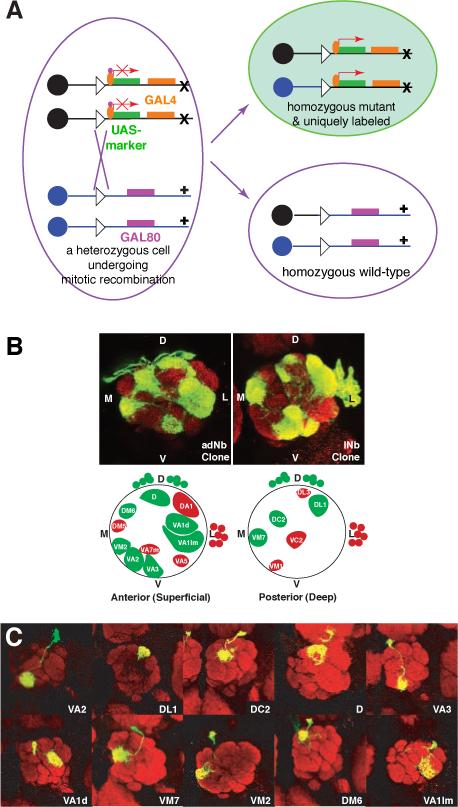
MARCM stands for Mosaic Analysis with a Repressible Cell Marker (Lee and Luo, 1999). The essence of MARCM is to couple cell division with the loss of a transcriptional repressor (Gal80) in one of the two daughter cells, thus allowing (Gal4/UAS driven) marker expression in one, but not the other, daughter cell, nor in any parental cells (Figure 1A). The loss of the transcriptional repressor in one of the daughter cells is achieved by site-specific recombinase FLP/FRT-mediated inter-chromosomal recombination prior to cell division (Golic and Lindquist, 1989; Xu and Rubin, 1993). The driver of the labeling event, the FLP recombinase, can be expressed as a transgene under the control of spatially specific or temporally inducible (such as a heatshock-inducible) promoters. To label single neuron of a specific type, all one needs to do is to activate the FLP recombinase in the last cell division that gives birth to the neuron of interest.
Fig. 1.

MARCM-based clonal analysis revealed relationship between lineage/birth order and wiring specificity of olfactory projection neurons. (A) Schematic of MARCM. After FLP/FRT site-specific mitotic recombination (cross between triangles), a heterozygous mother cell may give rise to two daughter cells, in which the chromosome arms distal to the FRT recombination site (triangle) become homozygous. GAL80 is ubiquitously expressed and efficiently suppresses GAL4-dependent expression of a UAS-marker gene. If GAL80, but not GAL4 or UAS-marker, is inserted on the chromosome arm carrying the wild-type (+) gene of interest, the daughter cell homozygous for the mutant gene (x) no longer contains GAL80. Therefore, the marker gene can be specifically turned on by GAL4 in homozygous mutant cells. Magenta rectangles and ovals indicate the GAL80 transgene and GAL80 protein respectively; Orange rectangles and ovals indicate the GAL4 transgene and GAL4 protein, respectively. Adapted from Lee and Luo (2001). (B) Anterodorsal and lateral neuroblast clones (adNb and lNb clones) contain PNs with stereotypical and complementary glomerular projections, as revealed by these single confocal sections of an anterodorsal (left) and a lateral (right) neuroblast clones taken at similar depths. Bottom panels show schematic of landmark glomeruli derived from anterodorsal (green) and lateral (red) neuroblasts in the anterior or posterior sections of the antennal lobe. D: dorsal; V: ventral; M: medial; L: lateral. Large circles indicate the antennal lobe. Glomeruli are structures inside the antennal lobe with specific names. Green and red circles outside and dorsal or lateral to the antennal lobes indicate adPN or lPN cell bodies, respectively. (C) Representative images of the 10 single cell MARCM clones of projection neuron induced at progressively later developmental stages, that project dendrites to 10 distinct glomeruli as indicated. Modified after Jefferis et al. (2001).
MARCM has several advantages over Golgi staining as a neuronal labeling method. First, one can engineer any marker to be expressed in single neurons. This marker can be GFP or any of its derivatives to visualize single neurons in live tissues, a membrane-tagged GFP to visualize fine branches of neuronal processes, physiological indicators to follow neuronal activation, or other transgenes to specifically visualize presynaptic terminals, postsynaptic specialization, the cytoskeleton, and so on (Lee and Luo, 1999; Watts et al., 2003). Second, one can control which types of neurons to be labeled by using specific promoters to drive the FLP recombinase or specific transcriptional activator (Gal4) lines. Since the introduction of the Gal4-UAS binary expression system (Brand and Perrimon, 1993), the fly community has accumulated thousands of lines in which Gal4 is expressed in specific subsets of cells in the fly. Third, if the labeled daughter cell undergoes further division, then all of its progeny are also labeled. Thus in addition to labeling single neurons, MARCM can be used to label groups of neurons that share the same lineage; this property has been used to reveal interesting relationships between neuronal lineage and wiring.
In addition to labeling neurons, MARCM can be used to delete endogenous genes specifically in labeled cells. This is because the same FLP/FRT mediated inter-chromosomal recombination event can be harvested to convert a heterozygous cell into a homozygous mutant cell (Figure 1A). MARCM can also be used to express any transgenes in wild-type or homozygous mutant cells. These features have been extensively used to study gene function in neuronal morphogenesis, neuronal circuit formation, as well as the development of non-neural tissues.
A complementary method to MARCM in flies that allows single neuron labeling and other applications mentioned above (except for deleting endogenous genes) is the Flip-out method (Basler and Struhl, 1994; Ito et al., 1997; Wong et al., 2002). In this method, FLP/FRT is again used to activate a marker or a transcription factor Gal4 by deleting the transcription stop between the two FRT sites, which separate the promoter and the marker or Gal4 open reading frame. A comparison of the pros and cons of MARCM and Flip-out has been previously discussed (Luo, 2004).
Three examples of MARCM application
Below I use studies mainly from my own laboratory on the organization and development of the olfactory circuit to illustrate three types of MARCM applications in neuroscience research.
Wiring specificity specified by lineage and birth order
From insects to mammals, the peripheral olfactory systems share a similar organizational principle. Each olfactory receptor neuron (ORN) typically expresses a single odorant receptor; ORNs expressing the same odorant receptor converge their axonal projections onto the same glomerulus (reviewed in Komiyama and Luo, 2006). Thus, olfactory information is organized as parallel channels represented by the activation of specific glomeruli in the insect antennal lobe/vertebrate olfactory bulb. This information is then relayed to higher olfactory centers by second order neurons—projection neurons (PNs) in insects and mitral/tufted cells in mammals—each of which sends it dendrites to a single glomerulus. Systematic MARCM-based clonal analysis (Jefferis et al., 2001) revealed that PNs from two different neuroblast lineages project dendrites to non-overlapping sets of glomeruli in the antennal lobe. As shown in the example on top and schematic in the bottom of Figure 1B, PNs derived from the anterodorsal neuroblast (adNb clone) or lateral neuroblast (lNb clone) only project their dendrites to stereotypical, interchalating but non-overlapping glomeruli (green and red glomeruli inside the antennal lobe, which is symbolized by the large circles in the schematic). Furthermore, MARCM labeled single PNs born at different time (as determined by heatshock timing using a heatshock promoter driving the FLPase transgene) project to different glomeruli, and PNs project to specific glomeruli according to their birth order (Figure 1C). Collectively, MARCM-based clonal analysis revealed that dendritic projections of PNs (and therefore the odors they represent in the adult) are predetermined by intrinsic genetic mechanisms and largely independent of interactions with their future presynaptic partner, the ORNs (Jefferis et al., 2001). Indeed, later developmental studies indicate that by the time pioneering ORN axons arrive at the developing antennal lobe, PN dendrites have already set up a coarse map (Jefferis et al., 2004).
Mapping odor representation in higher olfactory centers
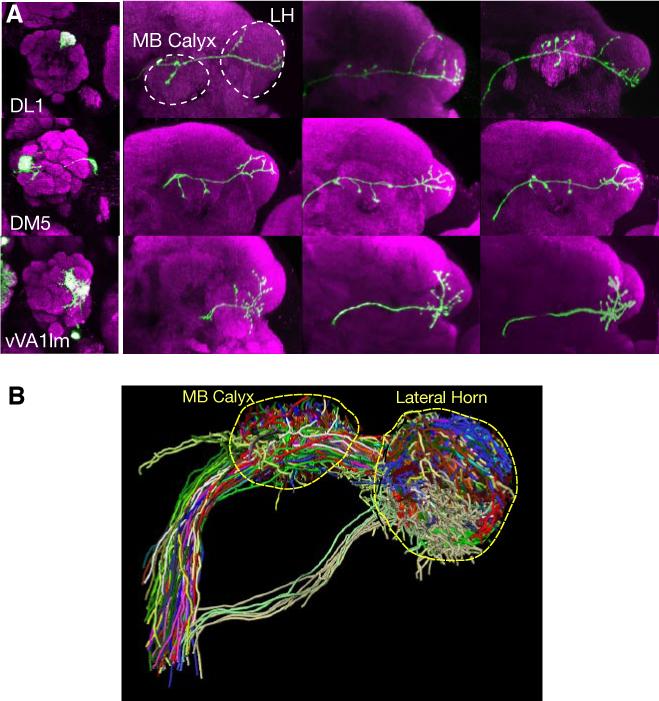
Systematic MARCM analysis generated hundreds of individually labeled PNs, each of which sends dendrites into a specific glomerulus in the antennal lobe and axons to the mushroom body and lateral horn—the higher olfactory centers in the fly brain. Analysis of such data allows the mapping of the transfer and transformation of olfactory information from the antennal lobe to higher brain centers. Earlier studies have indicated a high degree of stereotypy in PN axonal branching pattern and terminal arborization in the lateral horn (Marin et al., 2002) (Figure 2A). Axel and colleagues made similar observations from analysis of singly labeled PNs using the Flip-out method (Wong et al., 2002). Recently, such singly labeled PNs have been combined with a non-linear image registration method to project the axonal projections and presynaptic terminals of PNs of different glomerular classes onto the lateral horn of a standard brain (Figure 2B; Jefferis et al., 2007). This has allowed quantitative analyses of the organization of olfactory input channels in the higher olfactory centers, providing new biological insights (Jefferis et al., 2007).
Fig. 2.

Analysis of MARCM-labeled single olfactory projection neurons revealed organization of higher olfactory centers with respect to input channels. (A) Representative images of PN axon arborization in the mushroom body and lateral horn from 3 individual animals are shown (right) for three different classes of PNs. PNs are classified based on glomeruli of the targeted dendrites as indicated (left). MB: mushroom body; LH: lateral horn. Modified after Marin et al. (2002). (B) MARCM labeled single cells are projected onto a standard brain after image registration (Jefferis et al., 2007). Shown are 28 classes of PNs (each labeled by a different color), with at least 2 example neurons shown per class.
Genetic analysis of olfactory circuit assembly
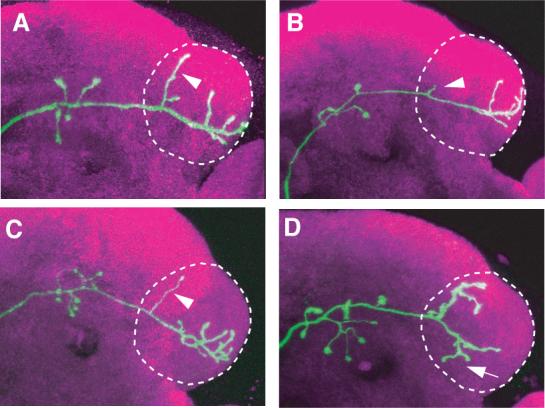
The ability of MARCM to delete endogenous genes and express transgenes in individually labeled neurons has allowed genetic analysis of the mechanisms by which wiring specificity of the olfactory circuit is established. Functions of various transcription factors and cell-surface receptors in regulating PN dendritic targeting have been reported (Komiyama et al., 2003; Zhu and Luo, 2004; Zhu et al., 2006; Komiyama and Luo, 2007; Komiyama et al., 2007). Genes affecting aspects of ORN axon targeting have also been analyzed with the help of MARCM by us (Komiyama et al., 2004; Sweeney et al., 2007) and others (e.g. Hummel et al., 2003; Hummel and Zipursky, 2004). In addition to establishing wiring specificity in the antennal lobe, PNs also need to coordinate their dendritic targeting in the antennal lobe with their stereotypic axonal arborization in higher brain centers (Marin et al., 2002; Wong et al., 2002; Jefferis et al., 2007). MARCM has allowed us to study genes that regulate both of these two processes (see example in Figure 3; Komiyama et al., 2003).
Fig. 3.

MARCM-based mutant analysis using loss-of-function mutants, misexpression, or both revealed regulation of axon terminal arborization of olfactory projection neurons by POU domain transcription factor Acj6. The axon arborization pattern of DL1 single cell clones in (A) wild type, (B) acj6−/−, (C) rescue: acj6−/−+ UAS-Acj6, and (D) acj6−/− + UAS-Dfr are shown. The characteristic dorsal branch is substantially shorter in the acj6−/− clone; this is rescued by acj6 transgene expression (arrowheads). Expression of a different POU domain transcription factor Drifter (dfr) in DL1 gives rise to a novel axon terminal arborization pattern (arrow in D). Modified after Komiyama et al. (2003).
Mouse MADM
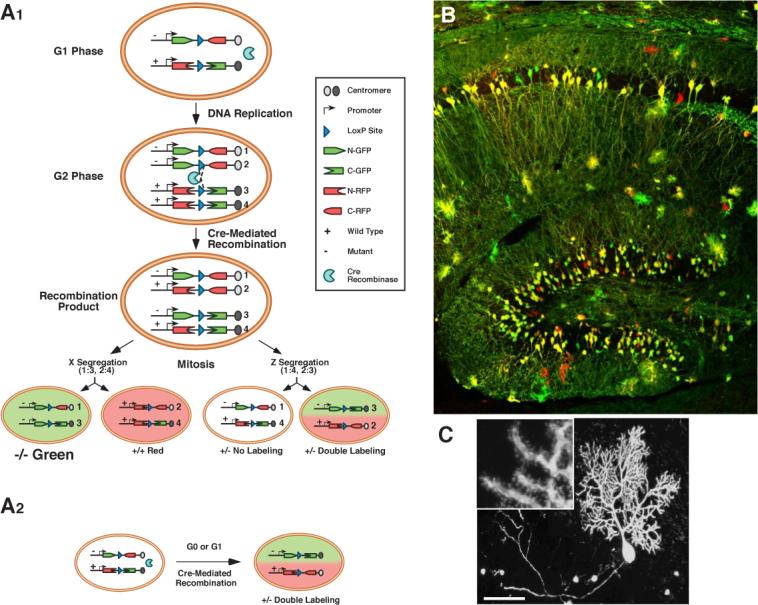
MADM stands for Mosaic Analysis with Double Markers (Zong et al., 2005). The principles of MADM in mice are analogous to fly MARCM: a site-specific recombinase is used to catalyze inter-chromosomal recombination that creates sparsely labeled neurons, which can additionally be made homozygous mutant for a gene of interest. Instead of using FLP/FRT to drive recombination, the Cre/LoxP system is used, being the most widely used recombinase system in the mouse with many available transgenic Cre lines. The design of MADM is simpler than MARCM (Figure 4A). Before recombination, no functional marker is expressed. After Cre-mediated recombination, one or both functional markers (green and red) are reconstituted depending on the recombination and segregation types (Figure 4A). Labeled green, red or yellow (double-labeled) cells can be generated (Figure 4B). The type, density and timing of neuronal labeling can be controlled by utilizing different ubiquitous or tissue-specific Cre drivers, as well as tamoxifen-inducible Cre drivers (Zong et al., 2005).
Fig. 4.

MADM schematic and examples. (A) G2 recombination followed by X segregation (two recombinant sister chromatids segregate into two different daughter cells) generates singly labeled cells that alter genotype if the original cell is heterozygous for a mutation of interest (A1, left). G2 recombination followed by Z segregation (two recombinant sister chromatids segregate into the same daughter cell; A1, right), G1 or postmitotic recombination (A2), generates either colorless or double-colored cells without altering the genotype. (B-C) Confocal images of MADM clones of the hippocampus (B) and a Purkinje cell with high magnification inset showing dendritic spines (C), both from young adult mice. A and C are modified after Zong et al. (2005).
Analogous to MARCM, MADM can also be used to delete endogenous genes specifically in labeled cells. Here it is essential to use two independent markers to distinguish the recombination and segregation types, and hence the genotypes. Assume that we start from a heterozygous genotype—a mutation of interest has been recombined onto the chromosome that has been engineered with a MADM transgene in between the gene of interest and the centromere of the chromosome. Only the single red and single green cells, but not the yellow cells, have altered genotypes (Figure 4A). The two markers ensure the distinction of homozygous mutant cells from heterozygous or homozygous wild-type cells. Additionally, homozygous mutant and homozygous wild-type cells are generated at the same time and are labeled with different colors, thereby creating internal controls for phenotypic analysis.
Prior to MADM, a number of genetic methods have been developed to label single neurons in mice (reviewed in Luo, 2004; Young and Feng, 2004). Most notably, chance insertions of Thy1 promoter-driven GFP variant (Thy1-XFP) transgenic mice allow visualization of neurons with different labeling densities, with certain sparse transgenic lines labeling single neurons of different types (Feng et al., 2000; De Paola et al., 2003). This has been used extensively to make many interesting discoveries such as synapse competition in developing neuromuscular junctions and dendritic spine stability in adult cerebral cortex in vivo (reviewed in Young and Feng, 2004).
MADM applications (so far)
Since MADM has been developed only recently, I provide below two examples of its applications. As is the case of MARCM, if a progenitor is labeled by MADM, then all of its progeny are labeled. Thus MADM can also be used as a lineage-tracing tool. Using this property, we have made an unexpected finding about the relationship between the lineage and axon position of cerebellar granule cells in the mouse brain. Utilizing a tamoxifen-inducible Cre to control the timing of clone induction, we found that granule cell progenitors have restricted fate at a very early developmental stage (1−3 weeks prior to exiting mitosis). Granule cells derived from a single progenitor at embryonic day 14 (before the progenitor exits the rhombic lip) have restricted axonal projections to specific sublayers of the molecular layer of the cerebellar cortex, even though their cell bodies are randomly scattered in the granule cell layer (Zong et al., 2005). We are currently investigating the underlying mechanisms that lead to this developmental phenomenon.
As a proof of principle of mutant analysis, we have analyzed the function of cyclin-dependent kinase inhibitor p27Kip1 (p27) in regulating cell cycle in vivo using MADM (Muzumdar et al., 2007). By comparing small clones of homozygous p27 mutant and wild-type cells in the same animal, we show that sporadic loss of p27 results in clonal expansion far greater than what is predicted from whole animal homozygous mutant. These studies also show that p27 regulates the timing of cell cycle exit for both cerebellar granule cells and hepatocytes. We expect that MADM will be utilized to analyze the function of many other mouse genes. As a prerequisite, one needs to create MADM-engineered transgenes on other mouse chromosomes. We are currently working towards this goal.
Concluding remarks
The Golgi staining method has served neuroscientists for well over a century. It allowed Ramon y Cajal to systematically describe the organizational principles of the nervous systems that laid down the foundation for modern neuroscience. It is still inspiring neuroscientists to create modern equivalents and extensions of this method to enable new discoveries.
Acknowledgement
I thank all members of my lab, past and present, for their contributions to the experiments discussed here. I thank Chris Potter for help with the figures, and Chris Potter, Bosiljka Tasic and Ya-Hui Chou for comments on the manuscript. For generous support of our research, I thank the National Institutes of Health, the McKnight foundation and the Howard Hughes Medical Institute.
Footnotes
Publisher's Disclaimer: This is a PDF file of an unedited manuscript that has been accepted for publication. As a service to our customers we are providing this early version of the manuscript. The manuscript will undergo copyediting, typesetting, and review of the resulting proof before it is published in its final citable form. Please note that during the production process errors may be discovered which could affect the content, and all legal disclaimers that apply to the journal pertain.
References
- Basler K, Struhl G. Compartment boundaries and the control of Drosophila limb pattern by hedgehog protein. Nature. 1994;368:208–214. doi: 10.1038/368208a0. [DOI] [PubMed] [Google Scholar]
- Brand AH, Perrimon N. Targeted gene expression as a means of altering cell fates and generating dominant phenotypes. Development. 1993;118:401–415. doi: 10.1242/dev.118.2.401. [DOI] [PubMed] [Google Scholar]
- Cajal SR. Histology of the nervous system of man and vertebrates. Oxford University Press, Inc.; Oxford: 1911. 1995 translation. [Google Scholar]
- De Paola V, Arber S, Caroni P. AMPA receptors regulate dynamic equilibrium of presynaptic terminals in mature hippocampal networks. Nat Neurosci. 2003;6:491–500. doi: 10.1038/nn1046. [DOI] [PubMed] [Google Scholar]
- Feng G, Mellor RH, Bernstein M, Keller-Peck C, Nguyen QT, Wallace M, Nerbonne JM, Lichtman JW, Sanes JR. Imaging neuronal subsets in transgenic mice expressing multiple spectral variants of GFP. Neuron. 2000;28:41–51. doi: 10.1016/s0896-6273(00)00084-2. [DOI] [PubMed] [Google Scholar]
- Golgi C. Sulla struttura della sostanza grigia del cervello. Gazetta medica lombarda IV. 1873.
- Golic KG, Lindquist S. The FLP recombinase of yeast catalyzes site-specific recombination in the Drosophila genome. Cell. 1989;59:499–509. doi: 10.1016/0092-8674(89)90033-0. [DOI] [PubMed] [Google Scholar]
- Hummel T, Vasconcelos ML, Clemens JC, Fishilevich Y, Vosshall LB, Zipursky SL. Axonal targeting of olfactory receptor neurons in Drosophila is controlled by Dscam. Neuron. 2003;37:221–231. doi: 10.1016/s0896-6273(02)01183-2. [DOI] [PubMed] [Google Scholar]
- Hummel T, Zipursky SL. Afferent induction of olfactory glomeruli requires N-cadherin. Neuron. 2004;42:77–88. doi: 10.1016/s0896-6273(04)00158-8. [DOI] [PubMed] [Google Scholar]
- Ito K, Awano W, Suzuki K, Hiromi Y, Yamamoto D. The Drosophila mushroom body is a quadruple structure of clonal units each of which contains a virtually identical set of neurons and glial cells. Development. 1997;124:761–771. doi: 10.1242/dev.124.4.761. [DOI] [PubMed] [Google Scholar]
- Jefferis GS, Vyas RM, Berdnik D, Ramaekers A, Stocker RF, Tanaka NK, Ito K, Luo L. Developmental origin of wiring specificity in the olfactory system of Drosophila. Development. 2004;131:117–130. doi: 10.1242/dev.00896. [DOI] [PubMed] [Google Scholar]
- Jefferis GSXE, Marin EC, Stocker RF, Luo L. Target neuron prespecification in the olfactory map of Drosophila. Nature. 2001;414:204–208. doi: 10.1038/35102574. [DOI] [PubMed] [Google Scholar]
- Jefferis GSXE, Potter CJ, Chan AM, Marin EC, Rohlfing T, Maurer CR, Luo L. Comprehensive maps of Drosophila higher olfactory centers: spatially segregated fruit and pheromone representation. Cell. 2007 doi: 10.1016/j.cell.2007.01.040. in press. [DOI] [PMC free article] [PubMed] [Google Scholar]
- Komiyama T, Carlson JR, Luo L. Olfactory receptor neuron axon targeting: intrinsic transcriptional control and hierarchical interactions. Nat Neurosci. 2004;7:819–825. doi: 10.1038/nn1284. [DOI] [PubMed] [Google Scholar]
- Komiyama T, Johnson WA, Luo L, Jefferis GS. From lineage to wiring specificity: POU domain transcription factors control precise connections of Drosophila olfactory projection neurons. Cell. 2003;112:157–167. doi: 10.1016/s0092-8674(03)00030-8. [DOI] [PubMed] [Google Scholar]
- Komiyama T, Luo L. Development of wiring specificity in the olfactory system. Curr Opin Neurobiol. 2006;16:67–73. doi: 10.1016/j.conb.2005.12.002. [DOI] [PubMed] [Google Scholar]
- Komiyama T, Luo L. Intrinsic control of precise dendritic targeting by an ensemble of transcription factors. Curr Biol in press. 2007 doi: 10.1016/j.cub.2006.11.067. [DOI] [PubMed] [Google Scholar]
- Komiyama T, Sweeney L, Schuldiner O, Garcia KC, Luo L. Dendritic targeting of olfactory projection neurons directed by cell-autonomous action of a Semaphorin-1a gradient. Cell. 2007;128:399–410. doi: 10.1016/j.cell.2006.12.028. [DOI] [PubMed] [Google Scholar]
- Lee T, Luo L. Mosaic analysis with a repressible cell marker for studies of gene function in neuronal morphogenesis. Neuron. 1999;22:451–461. doi: 10.1016/s0896-6273(00)80701-1. [DOI] [PubMed] [Google Scholar]
- Lee T, Luo L. Mosaic analysis with a repressible cell marker (MARCM) for Drosophila neural development. Trends Neurosci. 2001;24:251–254. doi: 10.1016/s0166-2236(00)01791-4. [DOI] [PubMed] [Google Scholar]
- Luo L. Single neuron labeling using genetic methods. In: Yuste R, Konnerth A, editors. Imaging Neurons: a Cold Spring Harbor Manual. Cold Spring Harbor Press; 2004. [Google Scholar]
- Marin EC, Jefferis GSXE, Komiyama T, Zhu H, Luo L. Representation of the glomerular olfactory map in the Drosophila brain. Cell. 2002;109:243–255. doi: 10.1016/s0092-8674(02)00700-6. [DOI] [PubMed] [Google Scholar]
- Muzumdar MD, Luo L, Zong H. Modeling sporadic loss of heterozygosity in mice using Mosaic Analysis with Double Markers (MADM). Proc Natl Acad Sci USA. 2007 doi: 10.1073/pnas.0606491104. in press. [DOI] [PMC free article] [PubMed] [Google Scholar]
- Swanson LW. The architecture of nervous systems. In: Squire LR, Bloom FE, McConnell SK, Roberts JL, Spitzer NC, Zigmond MJ, editors. Fundamental Neuroscience. Academic Press; 2003. [Google Scholar]
- Sweeney LB, Couto A, Chou Y-H, Berdnik D, Dickson BJ, Luo L, Komiyama T. Temporal target restriction of olfactory receptor neurons by Semaphorin-1a/PlexinA mediated axon-axon interactions. Neuron. 2007;53:185–200. doi: 10.1016/j.neuron.2006.12.022. [DOI] [PubMed] [Google Scholar]
- Watts RJ, Hoopfer ED, Luo L. Axon pruning during Drosophila metamorphosis: evidence for local degeneration and requirement of the ubiquitin-proteasome system. Neuron. 2003;38:871–885. doi: 10.1016/s0896-6273(03)00295-2. [DOI] [PubMed] [Google Scholar]
- Wong AM, Wang JW, Axel R. Spatial representation of the glomerular map in the Drosophila protocerebrum. Cell. 2002;109:229–241. doi: 10.1016/s0092-8674(02)00707-9. [DOI] [PubMed] [Google Scholar]
- Xu T, Rubin GM. Analysis of genetic mosaics in developing and adult Drosophila tissues. Development. 1993;117:1223–1237. doi: 10.1242/dev.117.4.1223. [DOI] [PubMed] [Google Scholar]
- Young P, Feng G. Labeling neurons in vivo for morphological and functional studies. Curr Opin Neurobiol. 2004;14:642–646. doi: 10.1016/j.conb.2004.08.007. [DOI] [PubMed] [Google Scholar]
- Zhu H, Hummel T, Clemens JC, Berdnik D, Zipursky SL, Luo L. Dendritic patterning by Dscam and synaptic partner matching in the Drosophila antennal lobe. Nat Neurosci. 2006;9:349–355. doi: 10.1038/nn1652. [DOI] [PubMed] [Google Scholar]
- Zhu H, Luo L. Diverse functions of N-cadherin in dendritic and axonal terminal arborization of olfactory projection neurons. Neuron. 2004;42:63–75. doi: 10.1016/s0896-6273(04)00142-4. [DOI] [PubMed] [Google Scholar]
- Zong H, Espinosa JS, Su HH, Muzumdar MD, Luo L. Mosaic analysis with double markers in mice. Cell. 2005;121:479–492. doi: 10.1016/j.cell.2005.02.012. [DOI] [PubMed] [Google Scholar]


