Abstract
Recently it has become possible to study interactions between proteins at the level of single molecules. This requires collecting data from an extremely small volume, small enough to contain one molecule—typically of the order of attoliters (10−18 L). Collection of data from such a small volume with sufficiently high signal-to-noise ratio requires that the rate of photon detection per molecule be high. This calls for a large illuminating light flux, which in turn leads to rapid photobleaching of the fluorophores that are labeling the proteins. To decrease photobleaching, we measured fluorescence from a sample placed on coverslips coated with silver island films (SIF). SIF reduce photobleaching because they enhance fluorescence brightness and significantly decrease fluorescence lifetime. Increase in the brightness effectively decreases photobleaching because illumination can be attenuated to obtain the same fluorescence intensity. Decrease of lifetime decreases photobleaching because short lifetime minimizes the probability of oxygen attack while the fluorophore is in the excited state. The decrease of photobleaching was demonstrated in skeletal muscle. Myofibrils were labeled lightly with rhodamine–phalloidin, placed on coverslips coated with SIF, illuminated by total internal reflection, and observed through a confocal aperture. We show that SIF causes the intensity of phalloidin fluorescence to increase 4- to 5- fold and its fluorescence lifetime to decrease on average 23-fold. As a consequence, the rate of photobleaching of four or five molecules of actin of a myofibril on Olympus coverslips coated with SIF decreased at least 30-fold in comparison with photobleaching on an uncoated coverslip. Significant decrease of photobleaching makes the measurement of signal from a single cross-bridge of contracting muscle feasible.
Keywords: Photobleaching, Silver island films, Microscopy
Recently it has become possible to study single protein molecules in a cell. This avoids problems associated with averaging responses from an assembly of molecules with different kinetics and problems associated with diluting of proteins in vitro. The difficulties of studying large assemblies of molecules are well illustrated by the problem of muscle contraction. Contraction results from the interactions of myosin cross-bridges with actin. Myosin cross-bridges act asynchronously, i.e., at any time during muscle contraction each one is in a different part of the mechanochemical cycle. Therefore measurement taken from an assembly of cross-bridges at any time during contraction is an average value, likely to obscure details of cross-bridge kinetics. Furthermore, it is desirable to detect signal from a working muscle, because contractile proteins may behave differently in solution and in whole muscle, where protein crowding may influence protein solubility and conformation [1]. Moreover, in muscle, actin and myosin are arranged in regular arrays of thin and thick filaments where the kinetics of their interactions depends on their relative position [2].
To be able to obtain information from the individual molecules in muscle, it is necessary to collect data from an extremely small volume, small enough to contain a single molecule. The concentration of contractile proteins in muscle is in the range of hundreds of μM [3], so the volume must be of the order of attoliters (10−18 L). To collect data from such a small volume with sufficiently high signal-to-noise (S/N)1 ratio requires that the rate of photon detection per molecule be high, which necessitates illuminating the muscle with an intense laser beam. This in turn leads to the rapid photobleaching of the fluorophores labeling the contractile proteins. Unlike the photobleaching of fluorophores in solution or in membranes, where bleached-out molecules are replenished by diffusion [4], photobleaching of immobile fluorophores is particularly severe. Adding oxygen scavenging reagents to the sample medium [5] alleviates the problem somewhat, but does not eliminate it [6].
Here we show a way to significantly decrease photobleaching. It is based on the fact that silver island films (SIF) increase brightness of fluorescence and significantly decrease fluorophore fluorescence lifetime. The factors that contribute to the overall brightness are the quantum yield of a fluorophore, the strength of the local electromagnetic field, and the quenching. In conventional fluorescence, the changes in quantum yield (Q) or fluorescence lifetime (τ) always occur by modulation of the nonradiative rate constant (knr), be it by solvent relaxation, nonradiative decay, quenching by the solvent, or transfer of the energy to an acceptor. The radiative rate constant Γ remains constant. Thus an increase of quantum yield
always results from a decrease of the rate of nonradiative decay knr [7]. Similarly, a decrease in knr always causes an increase of fluorescence lifetime:
In contrast, the proximity of fluorophores to metallic particles provides an opportunity to modify radiative rate Γ [8]. For example, suppose that the metallic particles result in γ-fold increase in the radiative decay rate to Γmod = γΓ. The fluorescence becomes brighter because quantum yield now becomes Q = γΓ/(γΓ + knr), i.e., it becomes closer to the maximum value of 1. But in contrast to the conventional case, the fluorescence lifetime is decreased, because it now becomes τ = 1/(γΓ + knr).
The most important consequence of the increase of brightness and the decrease of lifetime is decrease of photobleaching. Increase of brightness effectively decreases photobleaching because, to collect a given number of photons, the sample can now be illuminated with a weaker laser beam. An additional benefit of the weaker excitation power is a lower level of the emissive background. Decrease in fluorescence lifetime has the effect of decreasing photobleaching because bleaching occurs when a fluorophore is in the excited state. The decrease of lifetime minimizes the probability of attack by oxygen during the time that the molecule is in the exited state.
In the present work we measured signal from actin filaments labeled with fluorescent phalloidin. Phalloidin attaches to actin rigidly and rotates in synchrony with an interacting cross-bridge [9]. Studying actin rotation has the advantages in that labeling does not affect enzymatic properties of muscle [10,11] and that phalloidin initially labels the overlap zone [12–14], i.e., only actin protomers that are located in the region where interactions with myosin occurs are studied. Finally, by saturating all actins with a mixture of labeled and unlabeled phalloidins, the final concentration of label can be strictly controlled. The most impressive results were obtained using sapphire and Olympus coverslips: A sarcomere of skeletal muscle myofibril was illuminated by the evanescent field produced at a sapphire/water interface by light undergoing total internal reflection (TIR). The fluorescence was observed by the high-aperture (NA = 1.65) objective through a confocal aperture. The sapphire/water interface was formed by the coverslip/sample. The incident light was introduced through the objective by a technique called prismless TIR [15]. The depth-of-focus was equal to the evanescent field depth formed by the high-aperture objective (~65 nm). The lateral dimensions of the detection volume were defined by the size of the confocal aperture inserted in the conjugated image plane. The detection volume of our confocal TIR (CTIR) was ~12 attoliters. In the present experiments the concentration of phalloidin was 10 nM; 12 attoL volume contained therefore ~5 molecules of actin. We show here that SIF decreased photobleaching of these molecules on Olympus coverslips by a factor of at least 30, making it feasible to measure the signal from a single cross-bridge within a sarcomere.
CTIR technique has been described before [16–20]. An application utilizing CTIR and fluorescence correlation spectroscopy (FCS) has recently been described [20,21]. The effect of metallic surfaces on fluorescence emission of a dye was first reported by Drexhage [22]. The early studies of these effects [23,24] were followed by studies of the two-photon excitation near metallic particles [25,26] and colloids [27]. The increase of fluorescence brightness near silver islands made it possible to measure the kinetics of DNA hybridization [28]. The increase of photostability of Cy3-and Cy5- labeled DNA has been observed [29]. An important characteristic of SIF-induced fluorescence is that the Forster characteristic energy transfer distance is significantly increased [30,31], which opens a possibility of measuring energy transfer between fluorophores bound to DNA [32].
Materials and methods
Chemicals and solutions
Fluorescein–phalloidin, unlabeled phalloidin, phosphocreatine, creatine kinase, glucose oxidase, and catalase were from Sigma (St Louis, MI). Rhodamine–phalloidin was from Molecular Probes (Eugene, OR).
Preparation of myofibrils
Rabbit psoas muscle was first prewashed with cold EDTA-rigor solution (50 mM KCl, 2 mM EDTA, 10 mM DTT, 10 mM Tris–HCl, pH 7.6) for 0.5 h, followed by Ca-rigor solution (50 mM KCl, 2 mM MgCl2, 0.1 mM CaCl2, 10 mM DTT, 10 mM Tris–HCl, pH 7.6). Myofibrils were made from muscle as previously described [6].
Labeling and preparation of myofibrils
Unless otherwise indicated, myofibrils on glass cover-slips (1 mg/mL) were labeled for 5 min with 0.01 μM fluorescent phalloidin + 9.99 μM unlabeled phalloidin. When indicated, they were labeled for 5 min with 0.1 μM fluorescent phalloidin + 9.9 μM unlabeled phalloidin. After labeling, myofibrils were washed by centrifugation on a desktop centrifuge at 3000 rpm for 2 min followed by resuspension in rigor solution. The 15 μL of myofibrillar suspension was placed on uncoated or coated coverslips, covered with glass coverslip (to avoid drying), and washed with 3–4 volumes of rigor solution containing phosphocreatine, creatine kinase, glucose oxidase and catalase to remove oxygen and maintain, where needed, ATP concentration [5].
Coverslips
Glass coverslips No.#1 were from Fisher. Sapphire coverslips were purchased from MPA Crystal Corp. (San Francisco, CA). Olympus coverslips, specially designed for TIRF experiments using NA = 1.65 objective, were made from high-refractive-index material. Olympus would not reveal its composition.
Preparation of silver island films
Coverslips were incubated with Poly-L-lysine solution (Sigma 0.1%) for 1 h and rinsed thoroughly with water. The 500 mg AgNO3 (99% Aldrich) was dissolved in 60 mL water and 5% NaOH was added untill brown precipitate formed. Next 30% NH4OH was added to dissolve the precipitate and then the solution was cooled in ice for 3 min. 15 mL of glucose was added to this solution and the coverslips were inserted in it. The solution was then heated for 2 min followed by cooling at room temperature for 3 min. Coverslips were removed when the solution turned cloudy.
Fig. 1A shows the image of a glass coverslip coated with silver islands. The average diameter of the SIFs in X-Y plane was 272 ± 28 nm (mean ± SD). The average height of the SIF’s was 45 nm. Fig. 1B is an image of myofibrils in Ca-rigor solution on glass coated with silver islands. Fig. 1C is a control image of myofibrils on glass. We speculate that the area of a sarcomere seen projecting above the surface of the coverslip is the O-band, because it is strengthened by the presence of phalloidin.
Fig. 1.
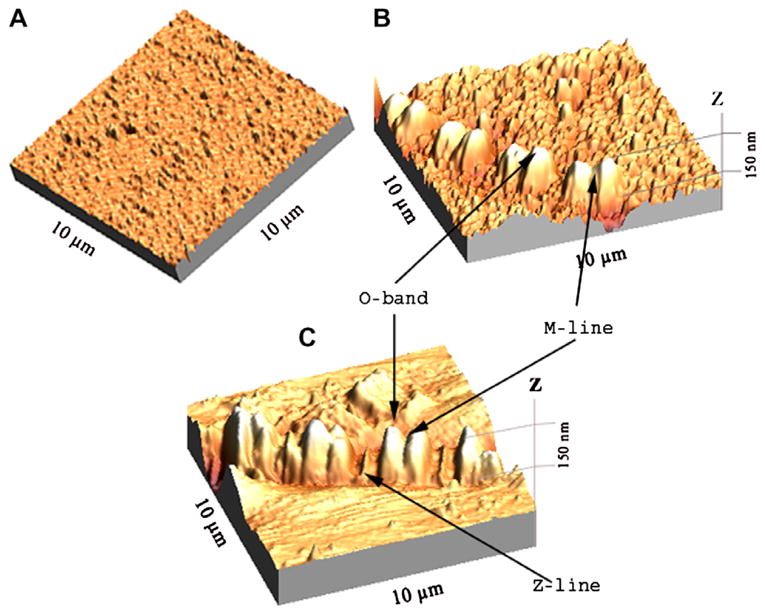
AFM image of glass coated with SIF (A), myofibrils on glass coverslips coated with SIF (B), and myofibrils on glass coverslips (C).
Data analysis
Images were analyzed by ImageJ program (NIH).
AFM
Imaging was performed on the AFM Explorer (ThermoMicroscopes/Veeco Instruments Inc.) in contact scanning mode with a Non-Conductive Silicon Nitride Probe (Veeco Instruments Inc.). Images were acquired at a 2- to 5- μm/s scan rate with a resolution of 300 pixels-per-line. Images were then processed with WSxM Version 4.0 software for three dimensional structure and analyzed with the Veeco SPMLab Version 6.0.2 software for Z, X, and Y distance quantification.
Bulk fluorescence measurements
The sample was positioned in the sample compartment of the Varian Eclipse Spectrofluorometer (Varian, Inc.) in the front-face configuration. The excitation was at 530-nm, and on the observation we used a 540-nm long wave pass filter. Under these conditions, there was no detectable signal from either a bare glass slide or a SIF reference slide.
Measuring fluorescence lifetimes
Fluorescence lifetimes were measured by a time-domain technique using the FluoTime 200 fluorometer (PicoQuant, Inc.). The sample was positioned in front-face configuration inside the fluorometer chamber. The excitation was by a 475-nm laser-pulsed diode, and the observation was through a monochromator at 575-nm with supporting 550 nm long wave pass filter. FWHM of pulse response function was 68 ps (measured by PicoQuant, Inc.). Time resolution was better than 10 ps. Less than 0.5% background was detected from the SIF slide. The intensity decays were analyzed in term of a multiexponential model using FluoFit software (PicoQuant, Inc.).
Microscopic measurements
The microscope was described earlier [6]. Briefly, the excitation light from an expanded DPSS laser beam (Compass 215 M, Coherent, Santa Clara, CA) enters the epiillumination port of the Olympus IX51 inverted microscope. TIRF illumination is provided by the commercial adapter (Olympus, Center Valley, PA). The expanded laser beam, focused at the back focal plane of the objective, is directed by the movable optical fiber adapter to the periphery of the objective where it refracts and propagates toward the interface at incidence angles greater than the critical angle. In the experiments using glass coverslips, the Olympus PlanApo 60×, 1.45 NA objective was used. In the experiments on sapphire and Olympus coverslips, Olympus Apo 100×, 1.65 NA objective was used. Excitation light totally internally reflects at the interface and produces an evanescent wave on the aqueous side of the interface [33]. Excitation light was s-polarized (perpendicular to the incidence plane) resulting in the same linear polarization of the evanescent field [34]. The evanescent field decays exponentially in the Z dimension with penetration depths of ~200 nm (for 1.45 objective) and ~65 nm (for 1.65 objective). Despite the higher refractive index of the muscle (~1.37), TIR occurs where the glass substrate meets the myofibril because the incident angles utilized are >70° (for 1.45 objective). The sample rests on a moveable piezo stage (Nano-H100, Mad City Labs, Madison, WI) controlled by a Nano-Drive. This provides sufficient resolution to place the region of interest in a position conjugate to the aperture. The fluorescent light is collected through the same objective and projected onto a tube lens, which focuses it at the conjugate image plane. A confocal aperture or an optical fiber (whose core acts as a confocal aperture) is inserted at this plane. The aperture was 50 or 4 μm in diameter for NA 1.45 and 1.65 objectives, respectively. An Avalanche Photodiode (APD, Perkin-Elmer SPCM-AQR-15-FC) collects light emerging from the aperture.
Results
Increase of brightness
Myofibrils were placed on glass coverslips or SIF coated glass coverslips and illuminated with a 5-mW laser beam at 532 nm. SIF coating of the coverslip results in the enhancement of fluorescence (Fig. 2). The fluorescence was recorded with Nikon Coolpix 995 camera through a 540-nm long wave pass glass filter. The average intensity of fluorescence was 4.5 times greater on SIF than on glass. In parallel, the emission spectra were recorded by placing the plane of the microscope slide at 45° angle with respect to the direction of the laser beam. As expected, no difference in the emission spectra was detected. This is consistent with earlier results using Texas red-labeled bovine serum albumin [35]. The intensity of fluorescence at 575 nm was enhanced 4 times. The difference from the value of 4.5 obtained by direct measurement is most likely due to the reflections associated with front-face illumination. Fig. 3 shows confocal images of the same myofibrils on glass (Fig. 3A) and SIF (Fig. 3B). The fluorescence originates from the overlap zones because phalloidin originally attaches to the ends of thin filaments of skeletal muscle [13]. Several hours are needed for the I-bands to label uniformly [12]. Since the present experiment was done ~15 min after labeling, the fluorescence originates mostly from the overlap zone (O-bands).
Fig. 2.
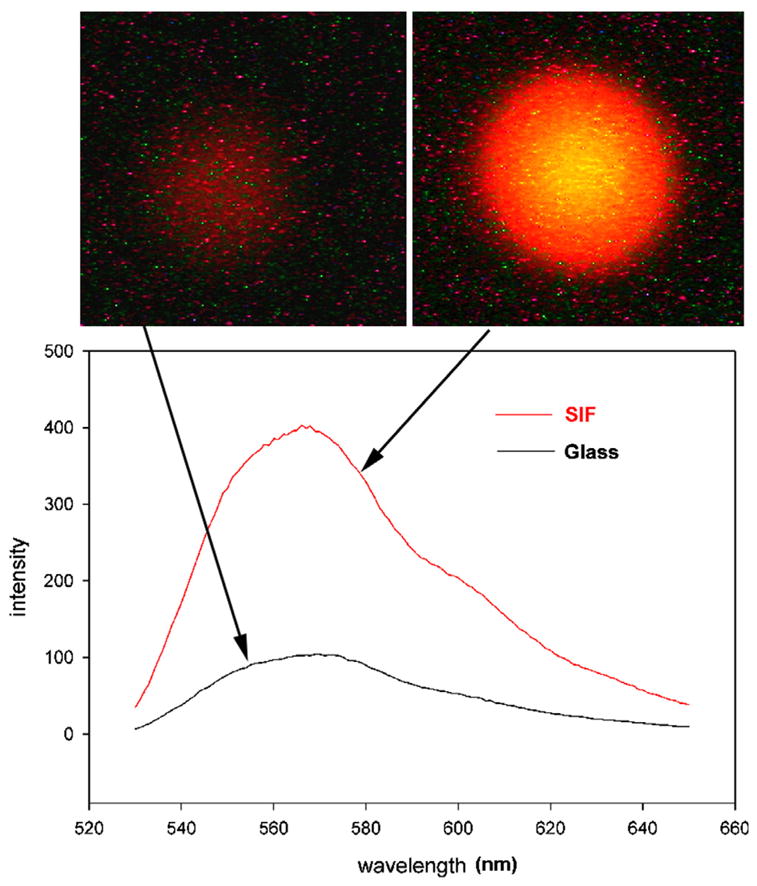
Enhancement of fluorescence by SIF. Myofibrils (1 mg/mL) labeled with 0.1 μM Rh-phalloidin were placed on a glass coverslip (top left) and on a coverslip coated with SIF (top right). The spectra were measured at a 45° angle in a Varian Eclipse spectrofluorometer. The vertical scale is in arbitrary units (a.u.). The spectrum of SIF in the absence of muscle is less than 10 a.u. at all wavelengths.
Fig. 3.
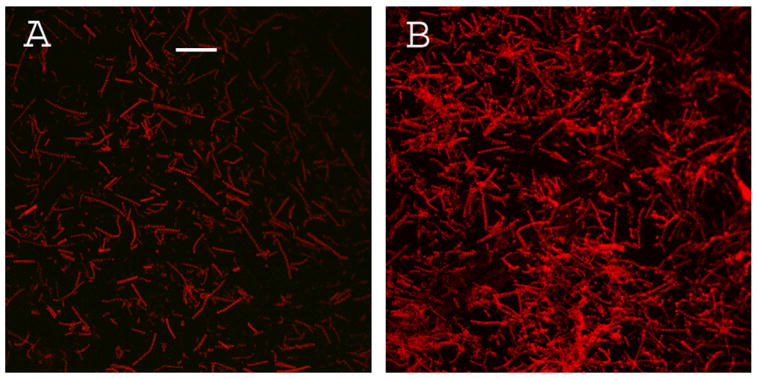
Confocal image of myofibrils contributing to the fluorescence of Fig. 1. (A) – myofibrils on glass coverslip; (B) – myofibrils on glass covered with SIF. Bar is 10 μm. Exposure is the same in each panel.
As shown in Figs. 3A and 3B the silver coating may lead to denser attachment of myofibrils compared to glass. However the overall brightness increase is due not exclusively to the density effect but also to increased brightness of individual fibrils. To demonstrate this, we compared brightness of the O-bands of the individual myofibrils. Fig. 4 is a representative gallery of images of myofibrils on glass (left column) and SIF coated glass (right column) using TIRF illumination. To prevent the images on SIF from being saturated, the gain of the camera was kept small and constant. The SIF decreased the quality of images due to refraction by silver particles, but it was sufficiently good to resolve striations. The average fluorescence intensity of the O-bands of myofibrils on glass was 56 (min = 20, max = 128). The average fluorescence intensity of the O-bands of myofibrils on glass covered with SIF was 224 (min = 51, max = 246), a four fold enhancement.
Fig. 4.
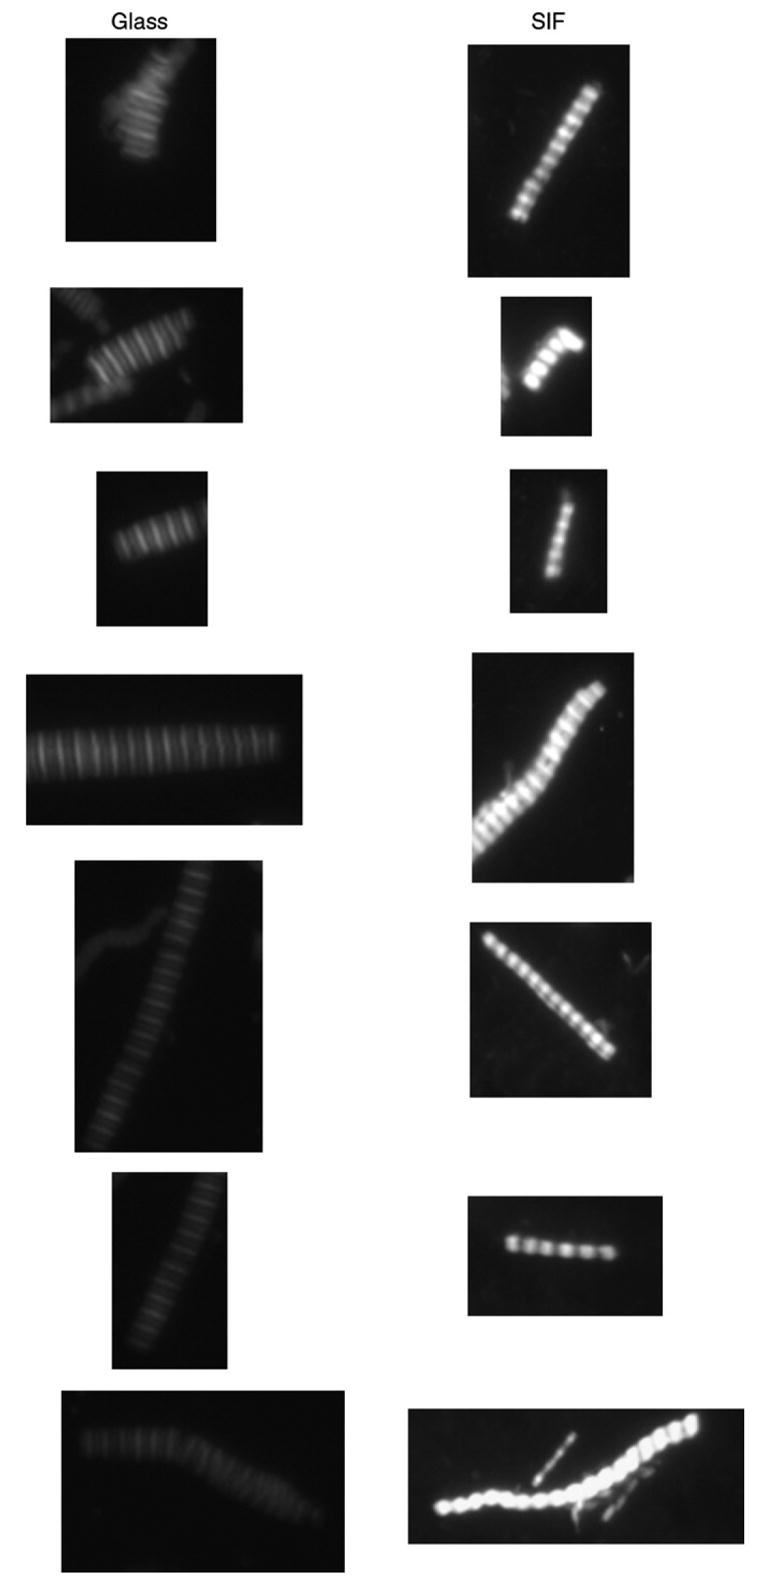
Enhancement of fluorescence by SIF using TIR fluorescence. Myofibrils were placed on glass coverslip (left column) or on glass coverslips coated with SIF and detected by TIRF. The representative images, from the faintest to the most intense, are shown. Exposure times and camera gain are the same for each panel.
Decrease of fluorescence lifetime
As mentioned before, the distinguishing feature of modification of radiative rate by the proximity of fluorophores to metallic surfaces is the fact that the fluorescence lifetime is decreased [8]. To determine whether the fluorescence lifetime of myofibrils indeed becomes smaller in the presence of SIF, we compared lifetime of myofibrils on the respective surfaces. Fig. 5 shows that SIF causes the fluorescence lifetime to significantly decrease. The decay of fluorescence of myofibrils on glass was best fitted by three exponentials with lifetimes τ1 = 3.607 ± 0.032, τ2 = 1.486 ± 0.025 and τ3 = 0.254 ± 0.014 ns with the relative contributions to the total intensity of 51.93, 38.35, and 9.72%, respectively. The exponentials decaying with the slow lifetimes (τ1 and τ2) contributed 90.28% of the total intensity. The remaining 9.72% was contributed by the fast decay (τ3). The exponentials decaying with slow and fast lifetimes contributed 51.27 and 48.73% of the total amplitude. The amplitude weighted average lifetime was 1.275 ns. The decay of fluorescence of myofibrils on SIF was best fitted by four exponentials with lifetimes τ1 = 3.612 ± 0.028, τ2 = 1.171 ± 0.027, τ3 = 0.128 ± 0.0043 and 0.018 ± 0.00024 ns with the relative contributions to the total intensity of 39.93, 18.62, 11.40, and 30.06%, respectively. In contrast to the decay of fluorescence on glass, the exponentials decaying with the slow lifetimes (τ1 and τ2) contributed only 58.55% of the total intensity. The remaining 41.45% was contributed by the fast decay (τ3 and τ4). The exponentials decaying with the slow and fast lifetimes contributed 1.51 and 98.49% of the total amplitude. The amplitude weighted average lifetime was 0.056 ns.
Fig. 5.
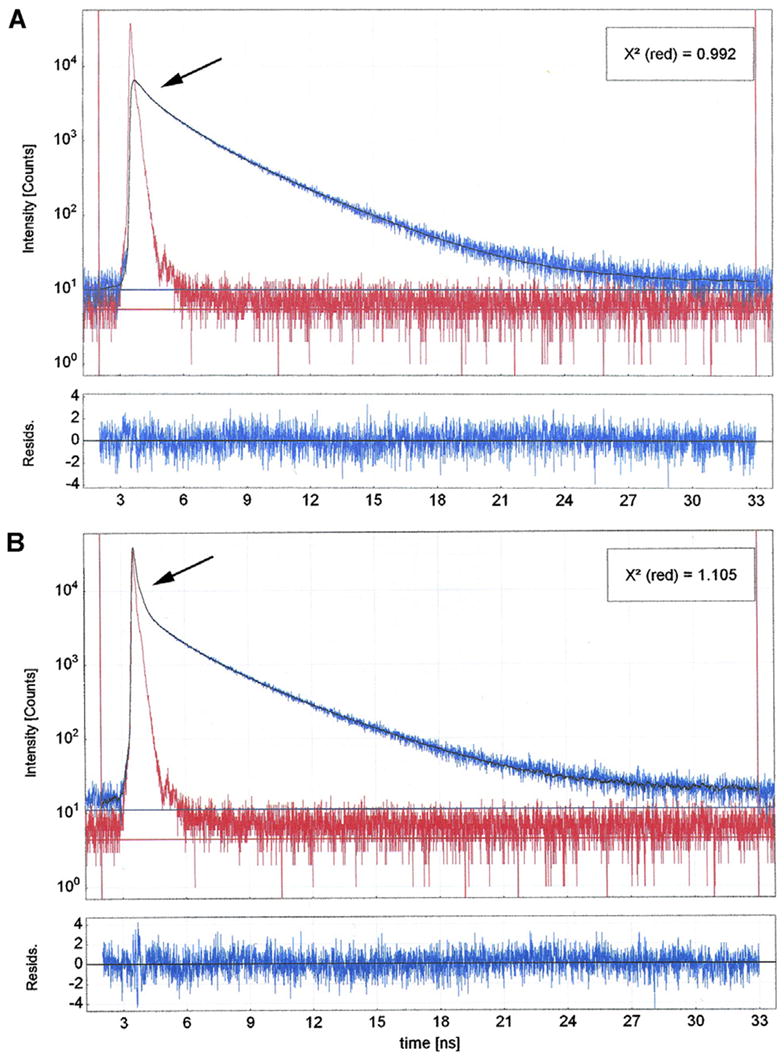
Comparison of lifetime signals from myofibrils on glass (A) and on SIF (B). The solid line in (A) is best fitted by three exponentials with lifetimes τ1 = 3.607, τ2 = 1.486; and τ3 = 0.254 ns and relative contributions to the total intensity of 51.93, 38.35, and 9.72%, respectively. The bottom panel is the residual to the fit to all 4129 data points analyzed. The solid line in (B) is best fitted by four exponentials with lifetimes τ1 = 3.612, τ2 = 1.171, τ3 = 0.128 and 0.018 ns and the relative contributions to the total intensity of 39.93, 18.62, 11.40, and 30.06%, respectively. The exponentials decaying with the slow lifetimes (τ1 and τ2) contributed 58.55% of the total intensity. The remaining 41.45% was contributed by the fast decay (τ3 and τ4). The bottom panel is the residual to the fit. All 4037 data points analyzed. The red signal is the excitation diode profile. The arrows point to a fast decay component.
Decrease of photobleaching
Both a decrease in τ and an increase in Q lead to a significant decrease of photobleaching. As noted before, decrease in τ diminishes bleaching because the shorter the excited state, the smaller the opportunity of free oxygen to damage the fluorophore, while the increase in Q diminishes bleaching because it allows a decrease of the exciting light intensity needed to maintain the same signal intensity. The overall decrease in photobleaching results from combination of these two factors and is shown in Fig. 6. The thickness of the evanescent wave (~200 nm) and the projection of the confocal aperture on the image plane (50 μm/60 magnification of the objective = ~0.9 μm) defined the confocal volume as 150–200 attoL. This is comparable to the volume of half-sarcomere. The glass and SIF signals decayed with the rates of 3.22 × 10⁻² and 1.65 × 10⁻² s−1, respectively. In 12 separate experiments, the average rate for myofibrils on glass and on glass coated with SIF was 0.0239 ± 0.0008 s and 0.0131 ± 0.0012 s−1 (mean ± SE; estimated by Mathematica 5.2) respectively, showing that photobleaching on glass is slowed by SIF on average 1.8-fold.
Fig. 6.
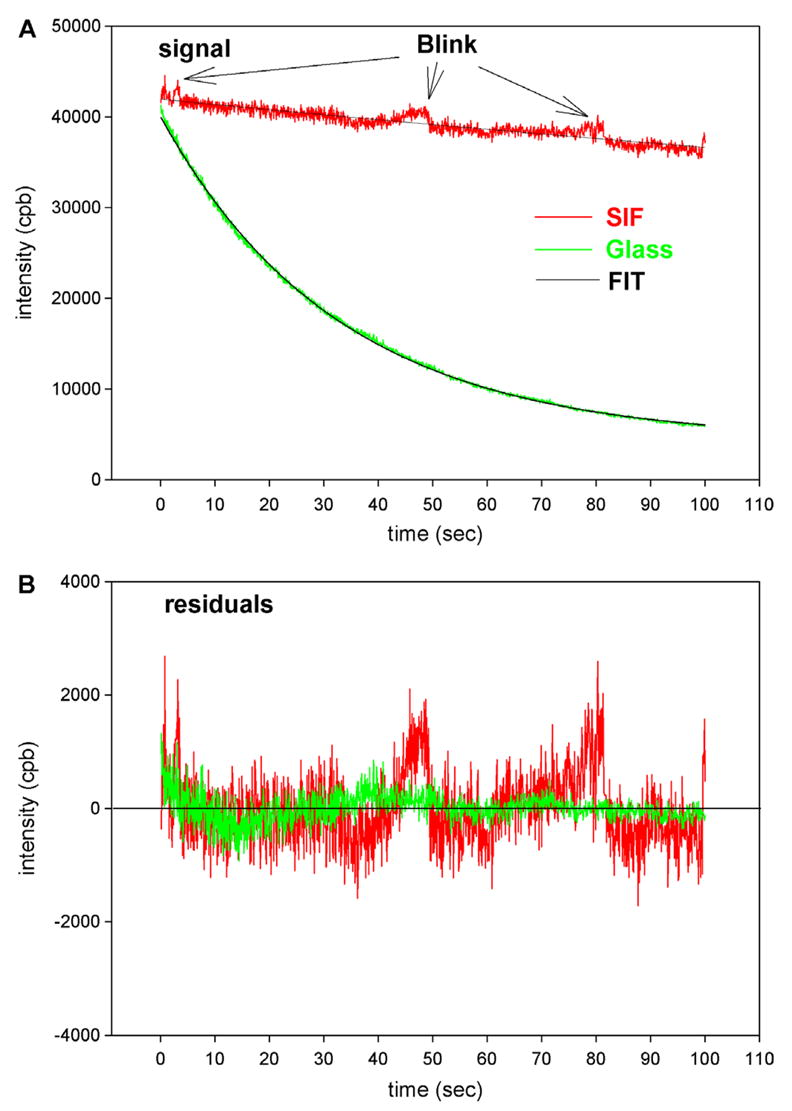
Comparison of the rate of photobleaching of the myofibrillar overlap zone on uncoated glass (green) and on the on glass coated with SIF (red). Myofibrils (1 mg/mL) were labeled with 0.01 μM Rh-phaloidin + 9.99 μm unlabeled phalloidin. The overlap zone of a myofibril was viewed in TIRF mode by SMD microscope through a 50 μm confocal aperture. The glass and SIF signals decayed with the rates of 3.22 × 10⁻² and 1.65 × 10⁻² s−1, respectively. The intensities at time = 0 were equalized by attenuating illumination of the myofibrils on SIF with 0.9 OD neutral density filter. Arrows point to the increase of fluorescence caused by blinking. NA = 1.45 objective. CPB is counts-per-100 ms bin. (For interpretation of the references to colour in this figure legend, the reader is referred to the web version of this article).
Particles of silver in SIF display curious “blinking,” even in the absence of the fluorophore [36,37]. Fortunately, blinking is rare. In the area defined by the projection of the 50-μm confocal aperture, we have detected on average only three or four events during 100 s.
Decrease of bleaching in single molecule detection experiments
In SMD measurement on muscle, we used a high-aperture (NA = 1.65) high-magnification objective and 4-μm confocal aperture. This decreases the depth of the detection volume (equal to the depth of the evanescent wave) to ~65 nm. The X-Y dimension of the detection volume is equal to the diameter of the confocal aperture divided by the magnification of the objective. With a 4-μm aperture and ×100 objective it is equal to the diffraction limit of NA 1.65 objective = ~0.25 μm [6] giving the detection volume of 12 × 10−18 L. Actin concentration in muscle (0.6 mM) implies that there are ~4500 actin protomers in this volume. The ratio of fluorescent phalloidin to nonfluorescent phalloidin was fixed at 1:1000, suggesting that the signal was contributed by about four or five actin molecules.
The high NA objective requires the use of high-refractive-index coverslips. We compared photobleaching on sapphire and on sapphire coated with SIF. The top panel of Fig. 7 illustrates how signal from a myofibril was measured. The O-band was positioned over the projection of the confocal aperture on the image plane by maneuvering the myofibril by X-Y piezo stage as described in [6]. The bottom panel compares photobleaching of the O-band of myofibrils on sapphire (green) and on sapphire coated with SIF (red) as seen through the confocal aperture illustrated in the top panel. The signal is weaker and more noise is present because 4–5 rather then hundreds of molecules were observed. It takes longer to obtain SIF signal than sapphire signal, because the SIF alters the TIRF angle and it takes a few minutes to find the proper SIF-TIRF angle. Photobleaching during this extra time is responsible for the fact that the SIF signal is not enhanced over sapphire signal. In six separate experiments, the average rate for myofibrils on sapphire and on sapphire coated with SIF was 0.0191 ± 0.0012 s and 0.0025 ± 0.0012 s−1 (mean ± SE), respectively, showing that photobleaching on sapphire is slowed down by SIF on average 7.5-fold.
Fig. 7.
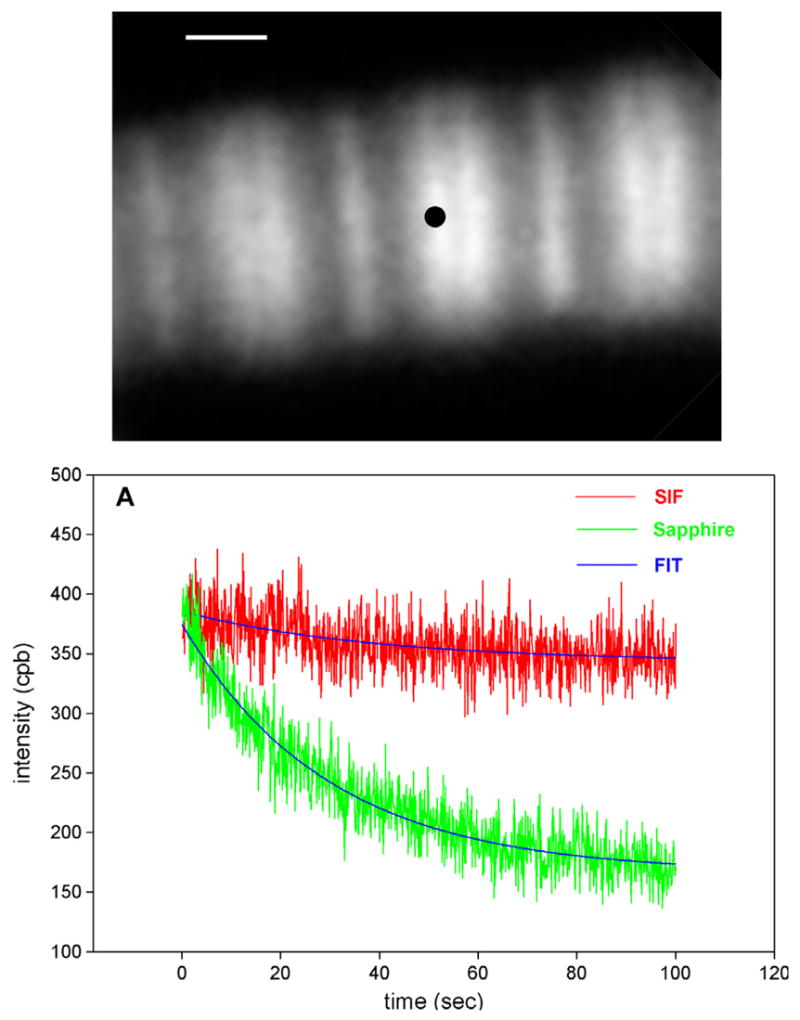
Comparison of the rate of photobleaching of the myofibrillar overlap zone on uncoated sapphire (green) and on sapphire coated with SIF (red). Myofibrils (1 mg/mL) were labeled with 0.01 μM Rh-phaloidin + 9.99 μm unlabeled phalloidin. The overlap zone of a myofibril was viewed in TIRF mode by SMD microscope through a 4-μm confocal aperture, whose projection (black dot) on the image plane is shown in the top panel. The bar is 1 μm. The three parameter exponential fits are in blue. NA = 1.65 objective. CPB is counts-per-100 ms bin. (For interpretation of the references to colour in this figure legend, the reader is referred to the web version of this article).
We observed that the suppression of bleaching was more effective on Olympus coverslips than on pure sapphire. Fig. 8A compares a typical time course of signal from the overlap zone of myofibrils on Olympus coverslip (green) and Olympus coverslip coated with SIF. Fig. 8B shows the same signals on an expanded time scale. In six separate experiments, the average rate for myofibrils on Olympus coverslips and on Olympus coverslips coated with SIF was 0.0432 ± 0.0052 s and 0.0013 ± 0.0009 s−1 (mean ± SE), respectively, showing that photobleaching on Olympus coverslips is slowed down by SIF by more than 30-fold. In two experiments, we observed no decay of SIF signal at all during 100 s.
Fig. 8.
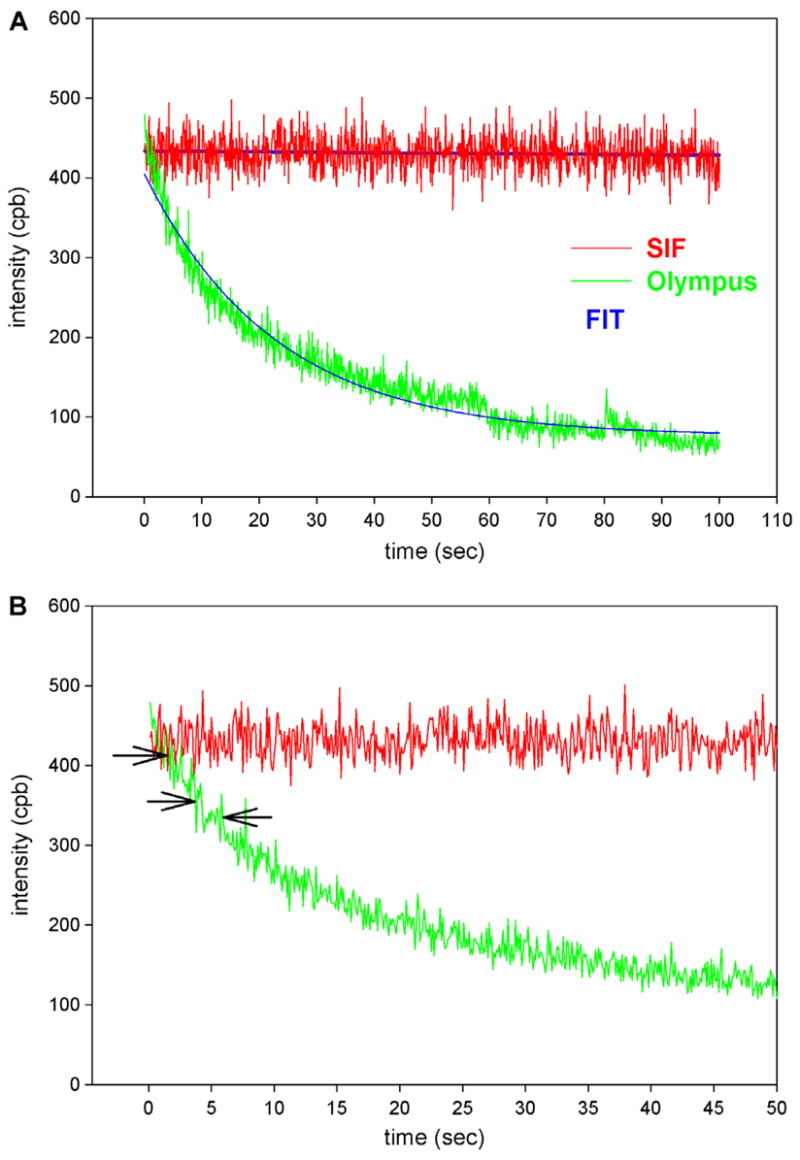
Comparison of the photobleaching of myofibrillar overlap zone on uncoated Olympus TIRF coverslips (green) and on Olympus TIRF coverslips coated with SIF (red). Arrows point to possible photobleaching events. (For interpretation of the references to colour in this figure legend, the reader is referred to the web version of this article).
Discussion
The observed increase of brightness can be caused by the (i) increase of rhodamine quantum yield, (ii) the decrease in self-quenching [38], or (iii) the enhancement of the local electromagnetic field [35].
Quantum yield
The quantum yield of rhodamine on SIF substrate cannot exceed 1. On glass it equals 0.7, so the maximum increase of quantum yield caused by SIF cannot exceed 43%. This increase must be caused by increase in the radiative rate, as evidenced by the fact that silver islands significantly decreased fluorescence lifetime: the amplitude weighted fluorescence lifetime of myofibrils on SIF decreased on average 22.7 fold in comparison with lifetime of myofibrils on glass. That SIF has dramatic effect on the lifetime is best illustrated by the relative contributions of slow and fast decays: The transition from glass to SIF decreased contribution to the total fluorescence intensity of the slow-decaying components by a third (from ~90 to ~59%). The same transition increased contribution of the fast-decaying components four times (from ~10 to ~41%). The effect on decay of fluorescence amplitude was even more dramatic The transition from glass to SIF decreased contribution to the total fluorescence amplitude of the slow-decaying components ~50-fold (from ~51 to ~1%). The same transition increased contribution of the fast-decaying components 2 fold (from ~49 to ~98%). There was no picosecond decay of fluorescence of myofibrils on glass, whereas it contributed nearly a third of the total intensity on SIF.
Quenching
It is obvious that self-quenching plays no role in our experiments, because rhodamine molecules are separated by a distance of at least 30 nm [3].
Enhancement of local field
The bulk of the increase must be due to the enhancement of the local field. This increase occurs despite the fact that silver islands may locally quench fluorescence at a close proximity (<5 nm) to the fluorophore [39]. The increase of brightness was not caused by the increase of the number of fluorophores bound to the silver film because this number was fixed by taking measurements only from the myofibrils.
The ability of SIF to decrease photobleaching should make SMD measurements on muscle possible. Photobleaching complicates measurements because interesting changes due to the mechanical activity of myosin cross-bridges are superimposed on changes due to bleaching. The fact that SIF decreased the rate of photobleaching on Olympus coverslips more than 30-fold will make SMD measurements of myofibrils on high refractive-index substrates particularly attractive. It is not clear to us why Olympus coverslips are better than sapphire slips. Olympus would not reveal the composition of their material.
We have shown earlier that surface plasmon coupled emission (SPCE) leads to the enhancement of excitation because of the increase in the local field at the metal–buffer interface [6]. The present work demonstrates that SIF leads to an enhancement of emission. Combination of SPCE and SIF should result in enhancement of both excitation and emission. Our preliminary results show that the SIF deposited on metallic mirrors can increase the fluorophore brightness by factor of 50 (American Chemical Society Meeting, March 2006, Atlanta, Georgia). Such experiments on myofibrils are now in progress.
Acknowledgments
This study was supported by 1AR048622 (NIAMS) (JB) and by CA 114460 (NCI) (IG).
Footnotes
Dedicated to Professor Avraham Oplatka on the occasion of his birthday.
Abbreviations used: SIF, silver island films; SMD, single molecule detection; TIRF, total internal reflection fluorescence; CTIR, confocal total internal reflection; SPCE, surface plasmon coupled emission; CPB, counts per bin; S1, myosin subfragment-1; S/N, signal-to-noise ratio; NA, numerical aperture of objective; FCS, fluorescence correlation spectroscopy; DTT, dithiothretol; AFM, atomic force microscopy.
References
- 1.Minton AP. Molecular crowding: analysis of effects of high concentrations of inert cosolutes on biochemical equilibria and rates in terms of volume exclusion. Methods Enzymol. 1998;295:127–149. doi: 10.1016/s0076-6879(98)95038-8. [DOI] [PubMed] [Google Scholar]
- 2.Eisenberg E, Hill TL, Chen Y. Cross-bridge model of muscle contraction. Quantitative analysis. Biophys J. 1980;29(2):195–227. doi: 10.1016/S0006-3495(80)85126-5. [DOI] [PMC free article] [PubMed] [Google Scholar]
- 3.Bagshaw CR. Muscle Contraction. Chapman & Hall; London: 1982. [Google Scholar]
- 4.Velez M, Axelrod D. Polarized fluorescence photobleaching recovery for measuring rotational diffusion in solutions and membranes. Biophys J. 1988;53(4):575–591. doi: 10.1016/S0006-3495(88)83137-0. [DOI] [PMC free article] [PubMed] [Google Scholar]
- 5.Harada Y, Sakurada K, Aoki T, Thomas DD, Yanagida T. Mechanochemical coupling in actomyosin energy transduction studied by in vitro movement assay. J Mol Biol. 1990;216:49–68. doi: 10.1016/S0022-2836(05)80060-9. [DOI] [PubMed] [Google Scholar]
- 6.Borejdo J, Gryczynski Z, Calander N, Muthu P, Gryczynski I. Application of Surface Plasmon Coupled Emission to Study of Muscle. Biophys J. 2006;91:2626–2635. doi: 10.1529/biophysj.106.088369. [DOI] [PMC free article] [PubMed] [Google Scholar]
- 7.Lakowicz JR. Principles of Fluorescence Spectroscopy. Plenum; New York & London: 1986. [Google Scholar]
- 8.Lakowicz JR, Malicka J, Gryczynski I, Gryczynski Z, Geddes CD. Radiative decay engineering: the role of photonc mode density in biotechnology. J Appl Phys D. 2003;36:R240–R249. doi: 10.1088/0022-3727/36/14/203. [DOI] [PMC free article] [PubMed] [Google Scholar]
- 9.Borejdo J, Shepard A, Dumka D, Akopova I, Talent J, Malka A, Burghardt TP. Changes in orientation of actin during contraction of muscle. Biophys J. 2004;86:2308–2317. doi: 10.1016/S0006-3495(04)74288-5. [DOI] [PMC free article] [PubMed] [Google Scholar]
- 10.Bukatina AE, Fuchs F, Watkins SC. A study on the mechanism of phalloidin-induced tension changes in skinned rabbit psoas muscle fibres. J Muscle Res Cell Motil. 1996;17(3):365–371. doi: 10.1007/BF00240934. [DOI] [PubMed] [Google Scholar]
- 11.Prochniewicz-Nakayama E, Yanagida T, Oosawa F. Studies on conformation of F-actin in muscle fibers in the relaxed state, rigor, and during contraction using fluorescent phalloidin. J Cell Biol. 1983;97:1663–1667. doi: 10.1083/jcb.97.6.1663. [DOI] [PMC free article] [PubMed] [Google Scholar]
- 12.Szczesna D, Lehrer SS. The binding of fluorescent phallotoxins to actin in myofibrils. J Muscle Res Cell Motil. 1993;14(6):594–597. doi: 10.1007/BF00141556. [DOI] [PubMed] [Google Scholar]
- 13.Ao X, Lehrer SS. Phalloidin unzips nebulin from thin filaments in skeletal myofibrils. J Cell Sci. 1995;108(Pt 11):3397–3403. doi: 10.1242/jcs.108.11.3397. [DOI] [PubMed] [Google Scholar]
- 14.Zhukarev V, Sanger JM, Sanger JW, Goldman YE, Shuman H. Distribution and orientation of rhodamine-phalloidin bound to thin filaments in skeletal and cardiac myofibrils. Cell Motil Cytoskeleton. 1997;37(4):363–377. doi: 10.1002/(SICI)1097-0169(1997)37:4<363::AID-CM7>3.0.CO;2-5. [DOI] [PubMed] [Google Scholar]
- 15.Axelrod D. Total internal reflection fluorescence microscopy in cell biology. Traffic. 2001;2:764–774. doi: 10.1034/j.1600-0854.2001.21104.x. [DOI] [PubMed] [Google Scholar]
- 16.Starr TE, Thompson NL. Local Diffusion and Concentration of IgG near Planar Membranes: Measurement by Total Internal Reflection with Fluorescence Correlation Spectroscopy. J Phys Chem B. 2002;106:2365–2371. [Google Scholar]
- 17.Ruckstuhl T, Seeger S. Attoliter detection volumes by confocal total-internal-reflection fluorescence microscopy. Optic Lett. 2004;29(6):569–571. doi: 10.1364/ol.29.000569. [DOI] [PubMed] [Google Scholar]
- 18.Ruckstuhl T. Sometimes less is more. Biophotonics. 2005:48–51. [Google Scholar]
- 19.Borejdo J, Talent J, Akopova I, Burghardt TP. Rotations of a few cross-bridges in muscle by confocal total internal reflection microscopy. Biochim Biophys Acta. 2006;1763:137–140. doi: 10.1016/j.bbamcr.2005.11.011. [DOI] [PubMed] [Google Scholar]
- 20.Borejdo J, Calander N, Gryczynski Z, Gryczynski I. Fluorescence correlation spectroscopy in surface plasmon coupled emission microscope. Optics Express. 2006;14(17):7878–7888. doi: 10.1364/oe.14.007878. [DOI] [PubMed] [Google Scholar]
- 21.Hassler K, Anhut T, Rigler R, Gosch M, Lasser T. High count rates with total internal reflection fluorescence correlation spectroscopy. Biophys J. 2005;88(1):L01–L03. doi: 10.1529/biophysj.104.053884. Epub 2004 Nov 05. [DOI] [PMC free article] [PubMed] [Google Scholar]
- 22.Drexhage KH. In: Progress in Optics. Wolfe E, editor. North Holland; Amsterdam: 1974. pp. 161–232. [Google Scholar]
- 23.Weitz DA, Garo3 S, Anson CD, Gramila TJ. Fluorescent lifetimes of molecules on silver-island films. Opt Lett. 1982;7:89–91. doi: 10.1364/ol.7.000089. [DOI] [PubMed] [Google Scholar]
- 24.Leitner A, Lippitch ME, Draxler S, Riegler M, Aussenegg FR. Fluorescence properties of dyes absorbed to silver islands, investigated by picosecond techniques. Appl Appl Phys B. 1985;36:105–109. [Google Scholar]
- 25.Gryczynski I, Malicka J, Shen Y, Gryczynski Z, Lakowicz JR. Multiphoton excitation of fluorescence near metallic particles: Enhanced and localized excitation. J Phys Chem B. 2002;106:2191–2195. doi: 10.1021/jp013013n. [DOI] [PMC free article] [PubMed] [Google Scholar]
- 26.Maliwal BP, Malicka J, Gryczynski I, Gryczynski Z, Lakowicz JR. Fluorescence properties of labeled proteins near silver colloid surfaces. Biopolymers. 2003;70(4):585–594. doi: 10.1002/bip.10501. [DOI] [PMC free article] [PubMed] [Google Scholar]
- 27.Geddes CD, Cao H, Gryczynski I, Gryczynski Z, Lakowicz JR. Metal-enhanced fluorescence (MEF) due to silver colloid on a planar surface: Potential applications of indocyanine green to in vivo imaging. J Phys Chem A. 2003;107:3443–3449. doi: 10.1021/jp022040q. [DOI] [PMC free article] [PubMed] [Google Scholar]
- 28.Malicka J, Gryczynski I, Lakowicz JR. DNA hybridization assays using metal-enhanced fluorescence. Biochem Biophys Res Commun. 2003;306(1):213–218. doi: 10.1016/S0006-291X(03)00935-5. [DOI] [PMC free article] [PubMed] [Google Scholar]
- 29.Malicka J, Gryczynski I, Fang J, Lakowicz JR. Photostability of Cy3 and Cy5-labeled DNA in the presence of metallic silver particles. J Fluoresc. 2002;12:439–447. doi: 10.1023/A:1021370111590. [DOI] [PMC free article] [PubMed] [Google Scholar]
- 30.Malicka J, Gryczynski I, Kusba J, Shen Y, Lakowicz JR. Effects of metallic silver particles on resonance energy transfer in labeled bovine serum albumin. Biochem Biophys Res Commun. 2002;294(4):886–892. doi: 10.1016/S0006-291X(02)00555-7. [DOI] [PMC free article] [PubMed] [Google Scholar]
- 31.Malicka J, Gryczynski I, Kusba J, Lakowicz JR, Shen Y. Effects of metallic silver island films on resonance energy transfer between N,N′-(dipropyl)-tetramethyl- indocarbocyanine (Cy3)- and N,N′-(dipropyl)-tetramethyl- indodicarbocyanine (Cy5)-labeled DNA. Effects of metallic silver particles on resonance energy transfer in labeled bovine serum albumin. Biopolymers. 2003;70(4):595–603. doi: 10.1002/bip.10507. [DOI] [PMC free article] [PubMed] [Google Scholar]
- 32.Lakowicz JR, Shen Y, D’Auria S, Malicka J, Fang J, Gryczynski Z, Gryczynski I. Radiative Decay Engineering. 2. Effects of Silver Island Films on Fluorescence Intensity, Lifetimes, and Resonance Energy Transfer. Anal Biochem. 2002;301:261–277. doi: 10.1006/abio.2001.5503. [DOI] [PMC free article] [PubMed] [Google Scholar]
- 33.Axelrod D. Total internal reflection fluorescence microscopy. Methods Cell Biol. 1989;30:245–270. doi: 10.1016/s0091-679x(08)60982-6. [DOI] [PubMed] [Google Scholar]
- 34.Burghardt TP, Thompson NL. Effect of planar dielectric interfaces on fluorescence emission and detection Evanescent excitation with high-aperture collection. Biophys J. 1984;46:729–737. doi: 10.1016/S0006-3495(84)84071-0. [DOI] [PMC free article] [PubMed] [Google Scholar]
- 35.Lukomska J, Malicka J, Gryczynski I, Lakowicz JR. Fluorescence enhancements on silver colloid coated surfaces. J Fluoresc. 2004;14(4):417–423. doi: 10.1023/b:jofl.0000031823.04926.75. [DOI] [PMC free article] [PubMed] [Google Scholar]
- 36.Peyser LA, Vinson AE, Bartko AP, Dickson RM. Photoactivated fluorescence from individual silver nanoclusters. Science. 2001;291(5501):103–106. doi: 10.1126/science.291.5501.103. [DOI] [PubMed] [Google Scholar]
- 37.Geddes CD, Parfenov A, Gryczynski I, Lakowicz JR. Luminescent Blinking from Silver Nanostructures. J Phys Che B. 2003;107:9989–9993. doi: 10.1021/jp030290g. [DOI] [PMC free article] [PubMed] [Google Scholar]
- 38.Lakowicz JR, Malicka J, D’Auria S, Gryczynski I. Release of the self-quenching of fluorescence near silver metallic surfaces. Anal Biochem. 2003;320(1):13–20. doi: 10.1016/S0003-2697(03)00351-8. [DOI] [PMC free article] [PubMed] [Google Scholar]
- 39.Malicka J, Gryczynski I, Gryczynski Z, Lakowicz JR. Effects of fluorophore-to-silver distance on the emission of cyanine-dye-labeled oligonucleotides. Anal Biochem. 2003;315(1):57–66. doi: 10.1016/S0003-2697(02)00702-9. [DOI] [PMC free article] [PubMed] [Google Scholar]


