Abstract
A rapid, reversible enhancement of synaptic transmission from a sensory neuron is reported and explained by impulses that reverse direction, or reflect, at axon branch points. In leech mechanosensory neurons, where one can detect reflection because it is possible simultaneously to study electrical activity in separate branches, action potentials reflected from branch points within the central nervous system under physiological conditions. Synapses adjacent to these branch points were activated twice in rapid succession, first by an impulse arriving from the periphery and then by its reflection. This fast double-firing facilitated synaptic transmission, increasing it to more than twice its normal level. Reflection occurred within a range of resting membrane potentials, and electrical activity produced by mechanical stimulation changed membrane potential so as to produce and cease reflection. A compartmental model was used to investigate how branch-point morphology and electrical activity contribute to produce reflection. The model shows that mechanisms that hyperpolarize the membrane so as to impair action potential propagation can increase the range of structures that can produce reflection. This suggests that reflection is more likely to occur in other structures where impulses fail, such as in axons and dendrites in the mammalian brain. In leech sensory neurons, reflection increased transmission from central synapses only in those axon branches that innervate the edges of the receptive field in the skin, thereby sharpening spatial contrast. Reflection thus allows a neuron to amplify synaptic transmission from a selected group of its branches in a way that can be regulated by electrical activity.
Changes in synaptic transmission are crucial to the function of many neurons. Most studies of synaptic plasticity concern changes that are located at the synapse, including long-term potentiation, long-term depression, and short-term synaptic depression (1). Transmission, however, can also be influenced within the axon before the synapse, and a neuron’s branching pattern can produce changes in transmission over time. Conduction of action potentials may fail at axon branch points, which can reduce synaptic transmission by decreasing the number of synaptic terminals activated (2–4). Branch points can also act as frequency filters, allowing separate branches of an axon to activate their synapses at different frequencies (5, 6).
Another way that a neuron’s branching pattern can affect impulse propagation is by delaying an impulse as it travels through a branch point. This delay can outlast the refractory period of the axon region entering the branch point, causing that region to fire a second time, thereby reflecting the impulse (7, 8). Reflection is related to action potential failure, or conduction block, in that it occurs when an action potential is near failure.
For this study, synaptic transmission was measured from leech mechanosensory neurons. Stimulating the soma of these neurons activates the entire set of presynaptic terminals, which was presumed to produce the maximal level of transmission for a single impulse (2). While recording from a postsynaptic cell, it was noticed that stimulating one region of the presynaptic neuron increased transmission to a level much higher than this presumed maximal level. This report describes the mechanism of this increase in transmission.
Electrical activity in leech sensory neurons is known to hyperpolarize the membrane and to produce conduction block (9). Previous theoretical work has concluded that reflection occurs for a range of branch-point morphologies (7, 8, 16). A compartmental model was used to examine whether this range increases when the effects of electrical activity are considered.
MATERIALS AND METHODS
Electrophysiology.
Mechanosensory neurons were stimulated in the minor receptive field in the skin, located anterior to the central, major receptive field as shown in Fig. 1A. Preparations consisted of a chain of two segmental ganglia with one ganglion attached to the skin by the dorsal peripheral nerve root. The bath contained leech saline, comprising: 115 mM NaCl, 4 mM KCl, 1.8 mM CaCl2, and 10 mM Tris maleate, pH 7.4 (20). Experiments were conducted at room temperature (20–22°C). To reduce spontaneous activity in other neurons during extracellular recording from touch (T) cells, the solution contained 20 mM MgCl2, replacing 20 mM NaCl. Intracellular recordings were made by using sharp microelectrodes (20–25 MΩ) filled with 4 M potassium acetate, and extracellular recordings were made by using a tungsten electrode with two hooks that drew the dorsal root into an oil-filled glass pipette. The T cell anterior minor receptive field was stimulated with a stylus on a piezoelectric wafer powered by a 1- to 2-msec pulse. By using a sharp stylus, the minor field of one T cell was stimulated without activating other T cells. This is possible because on a fine scale, the overlapping receptive fields of T cells are distinct (4, 10). The refractory period of the medial pressure (P) cell’s thin axon was measured by directly exciting the intersegmental nerve cord (connective) with a suction electrode immediately adjacent to the ganglion containing the soma. The shortest interval that separated two impulses arriving at the soma was taken as the refractory period. In some experiments, to prevent the Anterior Pagoda (AP) cell from firing in response to large synaptic potentials, continuous hyperpolarizing current was injected into the soma. Cutaneous mechanical stimuli were applied to P cells with a saline-filled glass pipette (outside diameter, 1 mm). Test electrical stimuli were applied through the same pipette and were triggered by a window discriminator that detected impulses arriving at the P cell soma. Values of n indicate number of preparations, not measurements.
Figure 1.
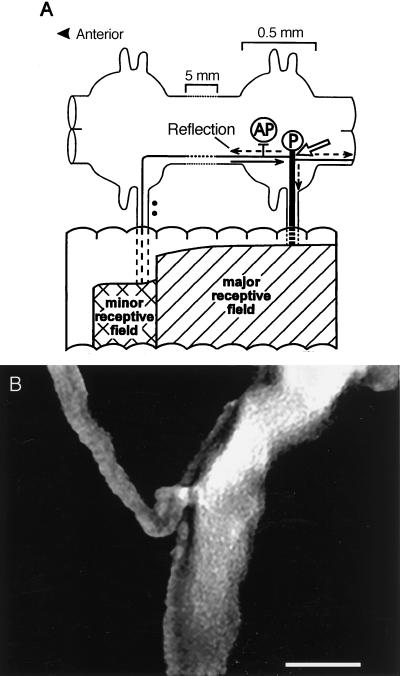
(A) Schematic diagram of a leech pressure (P) mechanosensory neuron including its cutaneous receptive field and its connection to the Anterior Pagoda (AP) cell. Impulses from the dorsal skin originating in either the minor or major receptive fields enter the central nervous system by way of the dorsal roots. The solid arrow indicates the direction of propagation of impulses from the anterior minor field. A reflected impulse travels in the directions indicated by the dashed arrows. Skin is incomplete and not to scale. (B) Confocal three-dimensional rendering of a P cell central branch point having the same orientation as A. (Bar = 10 μm.)
Confocal Microscopy.
Lucifer Yellow was injected into single P cells (14, 17). Images of cells were rendered by combining 25 optical sections recorded from a Noran laser-scanning confocal microscope by using a ×40 oil-immersion objective with a 1.4 numerical aperture, a 15-μm slit, and filters optimized for Lucifer Yellow.
Compartmental Modeling.
Using the simulator neuron (11), a cylindrical thick axon (10-μm diameter, 4.2-mm length) was connected to a soma (50 μm) (Fig. 6A). Anterior and posterior thin axons (4.24-mm length) were connected to the thick axon at points 100 and 160 μm from the soma, respectively. Eight secondary branches (0.8-μm diameter, 200-μm length) were connected to the anterior and posterior thin axons and separated by 60 μm. The integration time step (dt) was 50 μsec, axial resistivity was 200 Ωcm, and parameters were defined at 20°C. Membrane currents were determined as Iion = gion(V − Eion) for Na+, K+, Ca2+, and a leak current. EK was −68 mV and Eleak was −49 mV, whereas ECa and ENa were recalculated at each time step from the Nernst equation using [Na+]o = 110 mM, [Ca2+]o = 1.8 mM, and initial values of [Na+]i = 10 mM, [Ca2+]i = 0.1 μM. Conductances included: voltage-dependent Na+ and K+ conductances, gNa and gK, known to be primarily responsible for the P cell action potential (12); a high-voltage-activated (>≈−20 mV) Ca2+ conductance, gCa; a Ca2+-dependent K+ conductance, gK(Ca); and a nonspecific leak conductance, gleak. These conductances were calculated by using Hodgkin–Huxley-type equations with parameters determined from previously recorded voltage clamp data (12), as well as from activity-dependent changes in input resistance and membrane potential (9). Some additional adjustment of parameters was necessary to reproduce measured values of input resistance and membrane potential.
Figure 6.
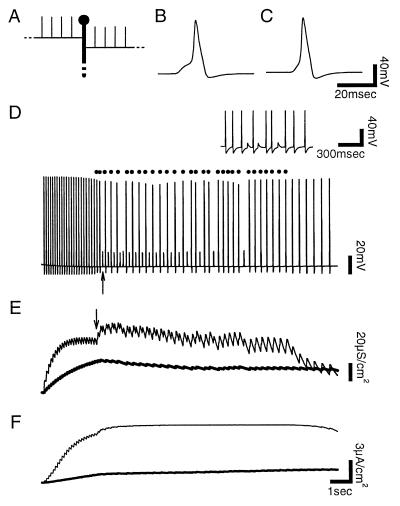
Compartmental model of activity-dependent reflection in a P cell. Voltage records were taken from the soma. Reflections were identified from the voltage record of the anterior thin axon (not shown). (A) Schematic diagram of the model in the region of the branch point. (B) Action potential that reflected. (C) Fully conducting action potential. (D) A train of impulses produced by pulses of current at the end of the anterior thin axon. Dots mark reflections, and the arrow marks the first instance of conduction block. (Inset) Actual experimental recording of intermittent conduction block in a P cell produced by mechanical stimulation. (E) Activity of gK(Ca) at the midpoint of the model’s anterior thin axon (thin line) and in the thick axon at the branch point (thick line). Arrow marks the first reflection. Reflections increased gK(Ca) at a greater rate in the thin axon by firing it twice. When an impulse blocked, gK(Ca) decreased in the thick axon. (F) Electrogenic Na+-K+ ATPase current in the anterior thin axon (thin line) and thick axon (thick line). The steady-state level of activity in the thin axon indicates saturation of the Na+-K+ ATPase.
Conductances were defined as gNa = ḡNam4h (12), ḡNa = 0.35S/cm2; gK = ḡKm2 (12), gK = 6 mS/cm2; gCa = ḡCam, ḡCa = 2 μS/cm2; gK(Ca) = ḡK(Ca)m; gK(Ca) = 0.8 mS/cm2; gleak = 0.5 mS/cm2. Steady-state values for activation state variables of gNa, gK, gCa, and gK(Ca) were defined as m∞ = αm(v)τm(v); τm(v) = 1/(αm(v)+βm(v)). Additionally, for the inactivation state variable of gNa, h∞ = αh(v)τh(v); τh(v) = 1/(αh(v)+βh(v)). State variables m and h were calculated as m = m + dm, h = h + dh, dm = (m∞ − m)(1 − exp(−dt/τm)), and dh = (h∞ − h)(1 − exp(−dt/τh)).
Forward and backward rate constants (α and β, respectively) were determined for gNa as αm(v) = 0.03(−(v + 28))/(exp(−(v + 28)/15) − 1), βm(v) = 2.7exp(−(v + 53)/18), αh(v) = 0.045exp(−(v + 58)/18), βh(v) = 0.72(exp(−(v + 23)/14) + 1); for gK as αm(v) = 0.024(−(v − 17))/(exp(−(v − 17)/8) − 1), βm(v) = 0.2exp(−(v + 48)/35); for gCa as αm(v) = 1.5(−(v − 20))/(exp(−(v − 20)/5) − 1), βm(v) = 1.5exp(−(v + 25)/10); and for gK(Ca) as αm(v) = 0.1[Ca2+]i/10 μM, βm(v) = 0.1.
[Na+] and [Ca2+] were uniform within each compartment, and ions did not diffuse between compartments. The Na+ current of the Na+-K+ ATPase was calculated as INaPump = INaPmax/(1 + exp(([Na+]ihalf − [Na+]i)/[Na+]is)) (13), INaPmax = 7 μA/cm2, [Na+]ihalf = 12 mM, [Na+]is = 1 mM. The electrogenic effect of the Na+-K+ ATPase was determined by IPump = INaPump/3. Ca2+ was removed with first-order kinetics according to ICaPump = ICaS([Ca2+]i − [Ca2+]rest)/1.5 μM, ICaS = 10 nA/cm2, [Ca2+]rest = 0.1 μM. Because this was a membrane current, the time course of removal depended on the surface-to-volume ratio of the compartment. Changes in temperature for gNa and gK at rest were calculated with a Q10 of 2.3.
Laser Axotomy.
When measuring the P → AP synaptic potential, it was necessary to eliminate the contribution from P and T cells in the anterior ganglion that also synapsed on the posterior AP cell. To this end, the peripheral axons of these two neurons were cut with a laser microbeam as described (14). The cells were pressure injected with 0.17 M 6-carboxyfluorescein, pH 7.4, and their peripheral axons were cut by laser irradiation.
Axon Diameter Measurements.
P cells were pressure injected with horseradish peroxidase (Sigma, type VI) through beveled microelectrodes and processed as described (2). Filled cells were viewed with Nomarski optics. Axon diameters were the average of four to six measurements taken along an axon at a separation of 10 μm.
RESULTS
In leech cutaneous mechanosensory neurons, one of which is schematically depicted in Fig. 1A, impulses originating in the thin axon at the edge of the receptive field (“minor field”) can fail to propagate beyond a central branch point (open arrow) within the ganglion. Propagation in the reverse direction, from thick axon to thin, does not fail (2–4, 15). Fig. 1B is a confocal rendering of this bifurcation. The diameter of the thick axon was 9.8 ± 3.7 μm (mean ± SD, n = 5) and of the thin axon was 2.1 ± 0.8 μm. The ratio of diameters was 4.6 ± 1.8. Fig. 1A depicts the connection between the P cell and the AP cell. P → AP presynaptic terminals are located primarily anterior to the central branch point (2).
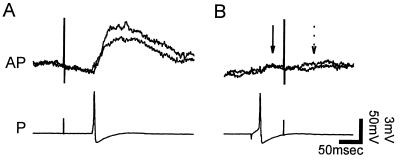
The P cell was stimulated in the anterior minor field, producing a large excitatory postsynaptic potential (EPSP) in the AP cell (Fig. 2A). When the soma of the P cell was stimulated directly, the EPSP was much smaller (Fig. 2B, solid arrow), even though impulses that initiate in the soma activate all presynaptic terminals (2). To confirm that EPSPs arose from the P cell and not from some other pathway activated by the stimulus, the impulse generated in the P cell soma was timed to collide with the impulse from the periphery. This eliminated the EPSP that would have been produced without the collision (Fig. 2B, dashed arrow). A single impulse originating in the minor field therefore can produce a synaptic effect much larger than a single impulse that reaches all of the presynaptic neuron’s synapses. For these conditions (at rest), stimuli to the anterior minor field produced EPSPs greater than twice as large as those produced by stimuli to the soma in three of seven P cells and was observed in the remaining four by changing membrane potential (see below).
Figure 2.
Stimulation of the P cell in the skin can produce greater transmission than stimulation of the soma. (A) Superimposed EPSPs of greater than 5 mV produced in the AP cell (Upper) when the P cell (Lower) anterior minor field was stimulated. (B) Stimulation of the P cell soma so as to produce a collision with a peripherally elicited P cell impulse. Stimulating the presynaptic cell’s soma produced an EPSP of approximately 1 mV (solid arrow). The collision in the same experiment confirmed that the EPSP in A was produced by the P cell, because the collision eliminated the large EPSP (dashed arrow).
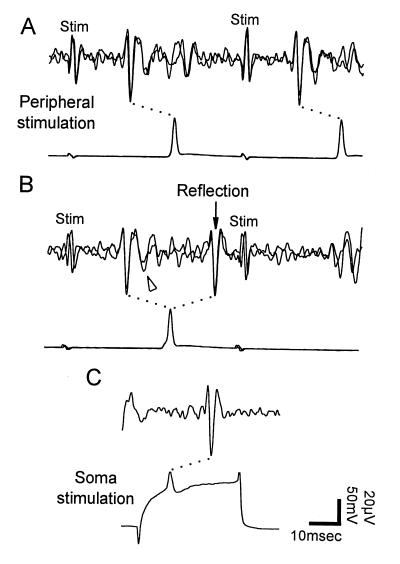
Reflection occurred at central branch points of mechanosensory neurons and could be observed directly in touch cells (T cells) (Fig. 3). The T cell’s thin axons that innervate its minor fields are suitable to record from extracellularly and are larger than those thin axons of P cells and nociceptive (N) cells, which are similar in their basic structure and axon branching. When the anterior minor field was stimulated twice, both impulses appeared in the extracellular recording from the peripheral nerve root and then in the intracellular recording from the soma (Fig. 3A). When an impulse reflected, it passed the root, arrived at the soma, and then returned past the root toward the skin. The reflected impulse collided with the second incoming impulse, preventing it from reaching the soma, as long as the second impulse was delivered within twice the time it took the first impulse to reach the soma (Fig. 3B). The pronounced initial rise, or “foot,” in the impulse seen in the intracellular recording always appeared during reflection and is characteristic of impulses propagating close to failure (18). This effect was more prominent when reflection occurred in P and N cells (see below). Collision of this second impulse from the skin with the reflected impulse was an independent test of reflection, provided that the second impulse indeed initiated. In these experiments, stimuli were well above threshold and the second impulse failed to reach the soma only when the first impulse reflected. The reflection traveled from the branch point to the periphery and should, therefore, have had nearly the same appearance in the root recording as an impulse initiated in the soma, as was the case (Fig. 3C).
Figure 3.
Reflection in a touch cell. Intracellular recordings (lower trace in each pair) were made from the T cell soma in the posterior ganglion. Extracellular recordings (upper traces) from the anterior dorsal root were made differentially between two hooks at the two points marked by dots in Fig. 1A, giving a different appearance to impulses propagating in opposite directions along an axon. The soma was hyperpolarized by current injection to produce reflection. Corresponding impulses in pairs of traces are joined by dotted lines. (A) When the first impulse did not reflect, both impulses followed stimulus artifacts in superimposed traces of the extracellular recording, then arrived at the soma as seen in the intracellular recording. (B) When the impulse reflected, it returned toward the skin (arrow). This impulse collided in the periphery with the second impulse arising in the skin, preventing it from reaching the root electrode or the soma. Impulses arriving from the periphery had a second phase that dropped below baseline (arrowhead). (C) In the root recording, an impulse elicited by intracellular stimulation resembled the reflected impulse in B.
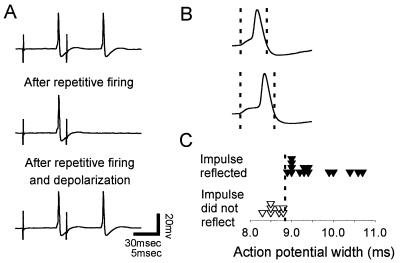
Reflection was typically intermittent in each T cell (n = 5). One explanation for this is that the range of membrane potentials capable of producing reflection was less than fluctuations of the membrane potential. In contrast, reflection in P cells occurred stably in every cell examined (n = 40). When the periphery was stimulated twice without reflection, both impulses arrived at the P soma, showing that the central branch point was fully conducting impulses (Fig. 4A Top). Repeated stimulation at 2–3 Hz for 5–15 sec produced a lasting hyperpolarization that caused reflection. The reflected impulse collided with the incoming second impulse, preventing it from reaching the soma (Fig. 4A Middle). Reflection was eliminated by depolarizing the soma by steady injection of current through the recording microelectrode, allowing the second impulse to reach the soma (Fig. 4A Bottom). This demonstrated that the absence of the second impulse was not a result of peripheral initiation failure, because a graded change of the soma membrane potential should not have affected whether the second impulse initiated in the minor field, which was electrotonically very distant (>10 length constants).
Figure 4.
Activity-dependent reflection in a pressure cell. (A Top) The skin was stimulated electrically twice with a suction electrode, and both impulses reached the soma. (Middle) After repetitive peripheral stimulation, which hyperpolarized the cell, the first impulse arrived with a delay, seen as an initial foot in the action potential, and then reflected. (Bottom) Depolarization of the soma moved the central branch point back into the fully conducting state, allowing the second impulse to reach the soma. (B Upper) Action potential width of an impulse that did not reflect. (Lower) This interval was longer in a reflected impulse. (C) If the width of the impulse was longer than a critical duration, it reflected.
Action potential width measured from the soma indicated whether an impulse reflected. Width was measured as the interval between the points where the impulse first rose from and then crossed the baseline, and indicated when propagation at the central branch point was delayed (Fig. 4B). Action potential width was manipulated by changing the membrane potential, either by steadily injecting current into the soma or by firing the cell to hyperpolarize it. When the width was longer than a critical duration, the impulse reflected (Fig. 4C), as seen by the failure of the second of two impulses to reach the soma. This critical duration of 9.0 ± 0.4 msec (mean ± SEM, n = 6) should depend on the refractory period of the thin axon in the central nervous system, which was 8.2 ± 0.7 msec (n = 3). In contrast, peripheral stimulation produced interpulse intervals no less than 40 msec (data not shown).
In a separate set of experiments to determine the state of P cells at rest at the beginning of an experiment, 45% reflected (5 of 11), 36% fully conducted (4 of 11), and 18% blocked (2 of 11). Once P cells blocked, reflection could be elicited by depolarizing current.
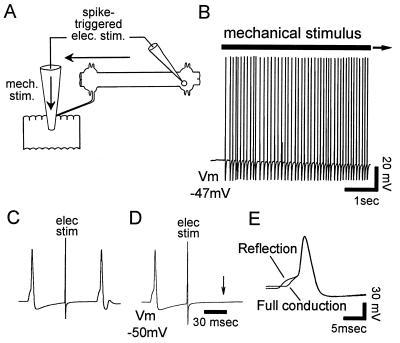
To confirm that physiological firing rates could produce the onset and cessation of reflection, the state of the branch point was measured while mechanically stimulating the skin (Fig. 5). Mechanical stimulation of the P cell minor field by using a glass pipette produced an initial firing rate of 12 ± 1 Hz (mean ± SEM) that then decayed over time. In four of five preparations, the decrease in firing rate could be approximated by a single exponential with a time constant of 21 ± 15 sec, ranging from 2 to 65 sec.
Figure 5.
Mechanical stimulation produces reflection. (A) Schematic diagram of experimental setup. Mechanical stimulation was produced by a glass pipette lowered onto the skin. Impulses arriving at the soma triggered a test electrical stimulus delivered through the same saline-filled pipette. (B) Mechanical stimulation produced a train of impulses. (C) Eight seconds after the onset of the stimulus, the trigger was engaged. The test impulse reached the soma, indicating that no reflection occurred. (D) Twelve seconds after stimulus onset, the trigger was engaged a second time. This time, the test impulse did not reach the soma, showing that the earlier mechanically elicited impulse had reflected. (E) Superimposed recordings of an impulse that reflected, and the first impulse in the train, which did not reflect.
To test whether a given mechanically elicited impulse reflected, when the impulse arrived at the soma, an electrical stimulus to the skin was triggered automatically through the same pipette, used as an electrode. When the mechanically elicited impulse under consideration did not reflect, the electrically elicited test impulse reached the soma (Fig. 5B), whereas when the impulse reflected, the test impulse did not reach soma (Fig. 5C). When the branch point was fully conducting at the beginning of an experiment, mechanical stimulation could move the branch point into the state of reflection (n = 4). Stimulation also could produce conduction block (Fig. 6D Inset). This demonstrates that a mechanical stimulus could turn reflection both on and off.
Previous theoretical results have indicated that reflection can occur at a branch point if the change in axon diameter falls within a certain range. To test whether the size of this range would increase when the effects of electrical activity were considered, a compartmental model of the P cell was used to vary the morphology of the central branch points while keeping membrane mechanisms constant (Fig. 6). Fig. 6A shows a schematic diagram of the model in the region of the branch point. Compartments were cylindrical with diameters within measured ranges for P cells. The thick axon was 10 μm in diameter, whereas the diameter of the thin axons could be varied. Impulses that reflected (Fig. 6B) were wider than fully conducting impulses (Fig. 6C).
The Na+-K+ ATPase and a Ca2+-dependent K+ conductance (gK(Ca)) are activity-dependent processes known to hyperpolarize the membrane and produce conduction block in P cells (9). These mechanisms were added to reproduce the effects of electrical activity.
Fig. 6D shows an example of activity in a model cell initiated in the anterior thin axon. The cell began in the state of full conduction and was stimulated at an initial rate of 10 Hz that then decayed exponentially with a time constant of 10 sec. This hyperpolarized the soma (Fig. 6D) as was observed experimentally (Fig. 5B). As expected, the Na+-K+ ATPase current and the gK(Ca) increased faster in the thin axons than in the thick axon owing to increased Na+ and Ca2+ accumulation in the thin axons (Fig. 6 E and F). During activity these mechanisms decreased excitability in the region of the branch point, producing activity-dependent reflection (Fig. 6D, dots). The model then produced intermittent conduction block, as was seen experimentally (Fig. 6D).
In the model at rest, the range of thin branch diameters capable of reflection was 1.44–1.49 μm. This fell within the range of measured thin axon diameters (2.1 ± 0.8 μm). Electrical activity was then generated by using the experimentally measured values of mean initial firing rate and exponential decay time constant (12 Hz and 21 sec). The range of thin axon diameters that produced reflection during activity or at rest was 1.44–2.27 μm, more than 16 times its value at rest. The Na+-K+ ATPase alone extended the range 9-fold.
Although one might conclude from theoretical studies of branch points at rest (16) that reflection occurs only for a narrow range of conditions, when the effects of electrical activity are accounted for, this range increases greatly. The Na+-K+ ATPase is ubiquitous, and gK(Ca) is present in many systems. The range of branch point morphologies that can produce reflection may, therefore, be considerably larger than previously thought.
Interestingly, when the temperature of the model was increased from 20°C to 37°C, the range of diameters that produced reflection at rest was more than eight times as large (1.44–1.49 μm at 20°C, 2.81–3.24 μm at 37°C). In contrast, at 10°C this range decreased to only 20% as large as at 20°C (1.15–1.16 μm). This suggests that at warmer temperatures, not only will reflection occur when the thin axon is closer in diameter to the thick axon, the range of diameters that produces reflection may be larger.
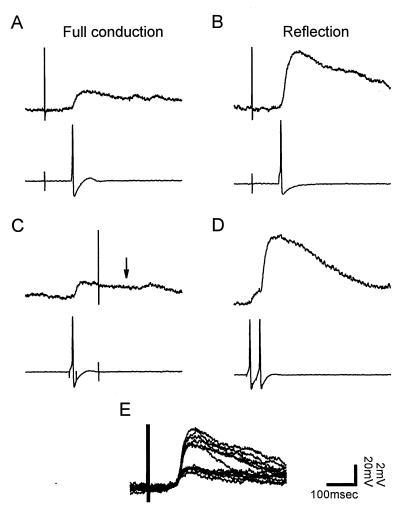
The effect of reflection on synaptic transmission was measured by recording presynaptically from the P cell and postsynaptically from the AP cell. Fig. 7 shows the EPSP produced in the AP cell when the anterior minor field of a P cell was stimulated. Compared with the EPSP in the AP cell when the P cell central branch point was fully conducting (Fig. 7A), reflection in the P cell produced an EPSP that was, on average, 3.00 ± 0.76 times as large (mean ± SEM, n = 5) (Fig. 7 B and E). To determine whether the branch point was reflecting, pairs of stimuli were applied to the skin between traces displayed in Fig. 7 (data not shown), as in Figs. 3 and 4.
Figure 7.
Reflection enhances synaptic transmission from the P cell to the AP cell. (A) The EPSP produced in the AP cell (Upper) upon stimulation of the P cell anterior minor field when the central bifurcation was fully conducting. (B) Hyperpolarizing current of −0.4 nA was injected into the P cell soma to elicit reflection, increasing the EPSP. (C) Collision of the peripheral impulse by an impulse initiated previously in the P cell soma. (D) Closely spaced paired impulses initiated in the P cell soma facilitated the AP cell EPSP. (E) Superimposed traces of EPSPs from both reflecting (6.6 ± 0.4 mV, mean ± SEM) and conducting (2.5 ± 0.1 mV) impulses. When current was reduced from −0.4 nA to −0.3 nA, returning the bifurcation to the fully conducting state, the EPSP dropped to within the distribution of smaller EPSPs from conducting impulses, showing that steady current itself did not alter transmission.
The magnitude of the EPSP during reflection was similar to the facilitation from a paired pulse initiated in the soma (Fig. 7D). In contrast, an impulse initiated in the soma (Fig. 7C) produced an EPSP similar to that when the central branch point was fully conducting. A collision, used to confirm that the EPSPs in the AP cell arose from the P cell, eliminated the EPSP that would have been produced at the time indicated by the arrow in Fig. 7D. Thus, transmission was increased by reflection because the incoming impulse reflected and activated the same synapses in rapid succession, producing substantial facilitation.
DISCUSSION
These results describe a mechanism by which the membrane geometry of axon branch points can increase synaptic transmission, thus expanding the ways that a neuron’s branching pattern can influence its output properties. The central branch points of P cells examined here can both reduce synaptic transmission when conduction blocks (2, 3) and increase transmission when reflection occurs.
Reflection and its effects are likely to go undetected or to be mistaken for other mechanisms. Intermittent step increases in transmission are commonly interpreted to be caused by an additional, separate pathway to the postsynaptic cell, such as an interneuron or an additional axon excited directly by the stimulus. This is particularly true when the method used to produce synaptic transmission is the commonly used technique of extracellular stimulation of axon bundles or the sensory periphery (18, 19). Such a step change in transmission can be caused, however, by a single cell as a result of reflection.
When reflection occurs in the leech, the anterior minor receptive field can produce a synaptic effect much greater than that of the major receptive field. This increase in transmission can sharpen contrast across the borders of the minor field.
P cells increase their firing rate with increasing stimulus intensity (20). An increase in firing frequency will cause synaptic transmission to change from normal size in the state of full conduction, to enhanced greatly in the reflecting state, to reduced in the blocked state. A decrease in frequency from a high firing rate can produce the reverse effect. Therefore, reflection can enhance contrast between neighboring frequencies by abruptly changing the strength of transmission in response to a slight change in frequency and by causing increased transmission at intermediate frequencies.
The P cell’s posterior branch targets a different set of postsynaptic neurons (2, 17) and also produced reflection (data not shown). Anterior and posterior reflection thus will increase transmission onto different postsynaptic cells.
At a bifurcation, even when branches become smaller, they can present a sufficient electrical load to produce conduction block or reflection (21). Branching patterns of this type include axonal terminal arbors and dendritic arbors. Conduction block occurs in axons in the mammalian central nervous system, including in the hippocampus (22, 23, 25). Action potentials propagating in dendrites of hippocampal pyramidal neurons fail in an activity-dependent manner (18, 19, 24), and these impulses also can possess a foot, or second inflection point, seen in impulses propagating near failure (18). The impedance mismatch necessary for reflection at a branch point is less than that necessary for conduction block. Consequently, branch points at which conduction blocks during activity might also produce reflection, depending on characteristics of the action potential such as the refractory period.
Dendritic impulses have been implicated in the induction of long-term potentiation in the hippocampus and synaptic modification in the neocortex (19, 26). Dendritic reflection could selectively double the number of impulses in a subset of the dendritic arbor.
In mitral cells of the mammalian olfactory bulb, impulses that initiate in dendrites can fail as they propagate to the soma (27). The soma presents a large increase in diameter, as is present in leech mechanosensory neurons. Paired recordings at the soma and in the dendrites indicate that when an impulse is delayed as it enters the soma from the dendrite, the firing of the soma can produce a second, later depolarization back in the dendrite (27). Dendrites in mitral cells also are known to make dendrodendritic synapses and release a neurotransmitter (28).
Theoretical models predict that dendritic morphology can influence the firing pattern of neocortical neurons (29). The synaptic effects reported here also depend on membrane structure. Electrical activity in neurons has been shown to alter the morphology of individual branches (30, 31). In this way, a neuron might influence its properties of integration and transmission.
Acknowledgments
I thank K. J. Muller for support and guidance, J. N. Barrett, R. Bookman, W. Nonner, and R. Rotundo for helpful discussions, and J. Bixby, R. Kramer, and R. Rotundo for comments on the manuscript. I acknowledge the Methods in Computational Neuroscience course at Marine Biological Laboratory in Woods Hole, MA, for instruction in neuron. This work was supported by National Institutes of Health Grant R01NS34927 and by a Howard Hughes Medical Institute Predoctoral Fellowship in Biological Sciences.
Footnotes
This paper was submitted directly (Track II) to the Proceedings Office.
Abbreviations: AP, Anterior Pagoda; gK(Ca), Ca2+-dependent K+ conductance; P cell, pressure cell; T cell, touch cell; EPSP, excitatory postsynaptic potential.
References
- 1.Bear M F, Malenka R C. Curr Op Neurobiol. 1994;4:389–399. doi: 10.1016/0959-4388(94)90101-5. [DOI] [PubMed] [Google Scholar]
- 2.Gu X. J Physiol (London) 1991;441:755–778. doi: 10.1113/jphysiol.1991.sp018777. [DOI] [PMC free article] [PubMed] [Google Scholar]
- 3.Macagno E R, Muller K J, Pitman R M. J Physiol (London) 1987;387:649–664. doi: 10.1113/jphysiol.1987.sp016593. [DOI] [PMC free article] [PubMed] [Google Scholar]
- 4.Muller K J, Scott S A. J Physiol (London) 1981;311:565–583. doi: 10.1113/jphysiol.1981.sp013605. [DOI] [PMC free article] [PubMed] [Google Scholar]
- 5.Chung S, Raymond S A, Lettvin J Y. Brain Behav Evol. 1970;3:72–101. doi: 10.1159/000125464. [DOI] [PubMed] [Google Scholar]
- 6.Grossman Y, Parnas I, Spira M E. J Physiol (London) 1979;295:283–305. doi: 10.1113/jphysiol.1979.sp012969. [DOI] [PMC free article] [PubMed] [Google Scholar]
- 7.Ramón F, Joyner R W, Moore J W. Fed Proc. 1975;34:1357–1363. [PubMed] [Google Scholar]
- 8.Parnas I. In: The Neurosciences. Schmitt F O, Worden F G, editors. Cambridge, MA: MIT Press; 1979. pp. 499–512. [Google Scholar]
- 9.Jansen J K S, Nicholls J G. J Physiol (London) 1973;229:635–665. doi: 10.1113/jphysiol.1973.sp010158. [DOI] [PMC free article] [PubMed] [Google Scholar]
- 10.Blackshaw S E. J Physiol (London) 1981;320:219–228. doi: 10.1113/jphysiol.1981.sp013945. [DOI] [PMC free article] [PubMed] [Google Scholar]
- 11.Hines M. In: Neural Systems: Analysis and Modeling. Eeckman F H, editor. Boston, MA: Kluwer; 1993. pp. 127–136. [Google Scholar]
- 12.Johansen J, Kleinhaus A L. Comp Biochem Physiol. 1990;97A:577–582. doi: 10.1016/0300-9629(90)90131-b. [DOI] [PubMed] [Google Scholar]
- 13.Angstadt J D, Friesen W O. J Neurophysiol. 1991;66:1858–1873. doi: 10.1152/jn.1991.66.6.1858. [DOI] [PubMed] [Google Scholar]
- 14.Gu X, Macagno E R, Muller K J. J Neurobiol. 1989;20:422–434. doi: 10.1002/neu.480200512. [DOI] [PubMed] [Google Scholar]
- 15.Mar A, Drapeau P. J Neurosci. 1996;16:4335–4343. doi: 10.1523/JNEUROSCI.16-14-04335.1996. [DOI] [PMC free article] [PubMed] [Google Scholar]
- 16.Ermentrout G B, Rinzel J. SIAM J Appl Math. 1996;56:1107–1128. [Google Scholar]
- 17.Gu X, Muller K J, Young S R. J Physiol (London) 1991;441:733–754. doi: 10.1113/jphysiol.1991.sp018776. [DOI] [PMC free article] [PubMed] [Google Scholar]
- 18.Spruston N, Schiller Y, Stuart G, Sakmann B. Science. 1995;268:297–300. doi: 10.1126/science.7716524. [DOI] [PubMed] [Google Scholar]
- 19.Johnston D, Magee J C. Science. 1997;275:209–213. doi: 10.1126/science.275.5297.209. [DOI] [PubMed] [Google Scholar]
- 20.Nicholls J G, Baylor D A. J Neurophysiol. 1968;31:740–756. doi: 10.1152/jn.1968.31.5.740. [DOI] [PubMed] [Google Scholar]
- 21.Rinzel J. Ann N Y Acad Sci. 1990;591:51–61. doi: 10.1111/j.1749-6632.1990.tb15080.x. [DOI] [PubMed] [Google Scholar]
- 22.Barron D H, Matthews H C. J Physiol (London) 1935;85:73–103. doi: 10.1113/jphysiol.1935.sp003303. [DOI] [PMC free article] [PubMed] [Google Scholar]
- 23.Dyball R E J, Grossmann R, Leng G, Shibuki K. J Physiol (London) 1988;401:241–256. doi: 10.1113/jphysiol.1988.sp017160. [DOI] [PMC free article] [PubMed] [Google Scholar]
- 24.Tsubokawa H, Ross W N. J Neurophysiol. 1996;76:2896–2906. doi: 10.1152/jn.1996.76.5.2896. [DOI] [PubMed] [Google Scholar]
- 25.Debanne D, Guérineau N C, Gähwiler B H, Thompson S M. Nature (London) 1997;389:286–289. doi: 10.1038/38502. [DOI] [PubMed] [Google Scholar]
- 26.Markram H, Lubke J, Frotscher M, Sakmann B. Science. 1997;275:213–215. doi: 10.1126/science.275.5297.213. [DOI] [PubMed] [Google Scholar]
- 27.Chen W R, Midtgaard J, Shephard G M. Science. 1997;278:463–467. doi: 10.1126/science.278.5337.463. [DOI] [PubMed] [Google Scholar]
- 28.Getchell T V, Shepherd G M. J Physiol (London) 1975;251:523–548. doi: 10.1113/jphysiol.1975.sp011106. [DOI] [PMC free article] [PubMed] [Google Scholar]
- 29.Mainen Z F, Sejnowski T J. Nature (London) 1996;382:363–366. doi: 10.1038/382363a0. [DOI] [PubMed] [Google Scholar]
- 30.Fields R D, Neale E A, Nelson P G. J Neurosci. 1990;10:2950–2964. doi: 10.1523/JNEUROSCI.10-09-02950.1990. [DOI] [PMC free article] [PubMed] [Google Scholar]
- 31.Grumbacher-Reinert S, Nicholls J. J Exp Biol. 1992;167:1–14. doi: 10.1242/jeb.167.1.1. [DOI] [PubMed] [Google Scholar]


