

Abstract
The low affinity neurotrophin receptor p75NTR is a multifunctional receptor with important roles in neurotrophin signaling, axon outgrowth, and oligodendroglia and neuron survival. It is transcriptionally regulated with spatial and temporal precision during nervous system development, injury and regeneration. Very little is known about how p75NTR expression is dynamically regulated but it is likely to influence how p75NTR signals in particular cellular contexts. Here, we identify the early growth response (Egr) transcriptional regulators, Egr1 and Egr3, as direct modulators of p75NTR gene expression. Egr1 and Egr3 bind and transactivate the p75NTR promoter in vitro and in vivo, using distinct response elements on the p75NTR promoter. Consistent with these results, p75NTR expression is greatly diminished in muscle spindle stretch receptors and in peripheral nerve Schwann cells in Egr gene deficient mice. Taken together, the results elucidate a novel mechanism whereby Egr proteins can directly modulate p75NTR expression and signaling in vivo.
Keywords: low affinity neurotrophin receptor, development, Egr, transcriptional regulation
Introduction
The low affinity neurotrophin receptor (p75NTR) is a member of the tumor necrosis factor (TNF) superfamily of transmembrane glycoprotein receptors with important roles in regulating axon growth and neuron/oligodendrocyte survival during nervous system development and repair (Barker, 2004; Nykjaer et al., 2005; Reichardt, 2006). For example, p75NTR binds neurotrophins with relatively low affinity (Chao, 1994; Chao and Hempstead, 1995), but when it is coexpressed with tropomyosin-related kinase (Trk) transmembrane tyrosine kinase receptors it substantially increases the affinity and specificity of the neurotrophins NGF, BDNF/NT-4 and NT-3 for TrkA, TrkB and TrkC respectively, to mediate neuron survival and differentiation through p75NTR/Trk signaling (Benedetti et al., 1993; Davies et al., 1993). Similarly, p75NTR can complex with Sortilin, a member of the Vps10p-domain receptor family, and bind pro-neurotrophin ligands such as pro-NGF to facilitate oligodendrocyte and neuron apoptosis in vitro and in vivo (Beattie et al., 2002; Harrington et al., 2004; Nykjaer et al., 2004). Through yet additional coreceptor interactions, p75NTR can complex with NogoR and Lingo-1 receptors to bind myelin based growth inhibitors such as Nogo, myelin associated glycoprotein (MAG) and myelin oligodendrocyte glycoprotein (MOG) that modulate RhoA GTPase signaling and the axon cytoskeleton during development and regeneration (Mi et al., 2004; Wang et al., 2002; Wong et al., 2002; Yamashita et al., 1999).
The mechanisms by which p75NTR mediates such diverse cellular responses are not well understood but may be partially explained by the cellular and developmental context in which it is expressed. p75NTR expression is transcriptionally regulated by a variety of stimuli including growth factor signaling (such as NGF) during development (Kuruvilla et al., 2004; Ma et al., 1992), by central and peripheral nervous system injury (Beattie et al., 2002; Kokaia et al., 1998; Rende et al., 1993), and by disease processes such as ischemia, epilepsy, Alzheimer’s disease and amyotrophic lateral sclerosis (Kokaia et al., 1998; Lowry et al., 2001; Mufson and Kordower, 1992; Roux et al., 1999) to name a few. Thus, depending upon the particular co-receptors that are also expressed and/or regulated in a cellular/disease context, modulation of p75NTR expression could be expected to influence how particular cells respond to normal or abnormal stimuli. Despite the fact that well-coordinated regulation of p75NTR expression is likely to have an important role in diversifying its signaling functions, very little is known about how it is regulated and what particular transcriptional mechanisms may influence its expression.
Early growth response (Egr) proteins are inducible transcriptional regulators that have an important role in regulating gene expression in response to a variety of extracellular stimuli that influence cellular growth, differentiation, response to injury and reaction to chronic nervous system diseases (for review see (Beckmann and Wilce, 1997; O’Donovan et al., 1999)). Egr proteins (Egr1-4) are encoded by four separate genes that contain highly homologous DNA-binding domains. They bind to moderately well-conserved Egr response elements (ERE) in target gene promoters to modulate their expression by imprecisely defined mechanisms. Mice lacking functional Egr genes have a wide range of developmental abnormalities, including infertility (Lee et al., 1996; Tourtellotte et al., 1999; Tourtellotte et al., 2000), hindbrain morphogenesis defects (Schneider-Maunoury et al., 1993; Swiatek and Gridley, 1993), impaired peripheral nerve myelination (Topilko et al., 1994), impaired muscle stretch receptor morphogenesis (Tourtellotte et al., 2001; Tourtellotte and Milbrandt, 1998), sympathetic nervous system abnormalities (Eldredge and Tourtellotte, 2004) and defects in learning and memory (Jones et al., 2001; Li et al., 2007). Despite the wide range of abnormalities in Egr gene deficient mice, only a small number of target genes directly regulated by Egr proteins in vivo have been identified.
The p75NTR promoter lacks consensus TATA and CAAT sequences, but contains multiple GC-rich motifs, suggesting functional roles for transcriptional regulators which bind GC-rich sequences, such as Egr transcription factors (Poukka et al., 1996). Egr proteins are rapidly induced by stimuli that also induce p75NTR expression, and enforced expression of Egr1 (Nikam et al., 1995) and Egr3 (Albert et al., 2005) upregulates p75NTR expression in vitro. Considering the high degree of association between the expression of Egr proteins and p75NTR in developmental and reactive states such as nervous system injury and repair, these results suggest that Egr proteins may have an important role in regulating p75NTR expression. However, whether p75NTR is subject to direct regulation by Egr proteins, through which regulatory domains Egr proteins may bind and transactivate it, and whether Egr proteins regulate it in vivo have not been clearly defined. In this study, we show that Egr1 and Egr3 directly bind specific regulatory elements in the p75NTR promoter in vivo and are capable of inducing p75NTR gene expression. Moreover, in muscle spindle stretch receptors and peripheral nerves, where p75NTR expression has important functions in spindle morphogenesis and peripheral nerve myelination, respectively, p75NTR expression is deregulated in Egr gene-deficient mice. These results demonstrate a physiologically relevant role for Egr proteins in regulating p75NTR gene expression and define a highly dynamic regulatory mechanism for modulating p75NTR expression during development, injury and regeneration.
Results
Enforced expression of Egr1 or Egr3 induces p75NTR expression in multiple cell types
The p75NTR gene was identified as a potential target of Egr3 regulation from a microarray analysis intended to characterize the target genes regulated by Egr3 during muscle stretch receptor development (Albert et al., 2005). The microarray result was confirmed by comparing p75NTR expression in primary murine myotubes infected with adenoviruses expressing either wild type (Egr3) or a transcriptionally inactive c-terminal truncation of Egr3 (Egr3Tr). p75NTR expression was upregulated 14.2-fold by wild type Egr3 relative to Egr3Tr in primary myotubes (Fig. 1A). Egr3 protein is robustly expressed in the nuclei of both intrafusal muscle fibers and spindle capsules that are derived from perineurial fibroblasts during muscle spindle development (Maier, 1997; Tourtellotte and Milbrandt, 1998). Therefore, we also investigated whether p75NTR expression was upregulated in mouse embryonic fibroblasts (MEFs) by enforced expression of Egr3. In MEFs, p75NTR expression was induced 240-fold by wild type Egr3 when compared to Egr3Tr (Fig. 1B). Since p75NTR also has an important role in Schwann cell biology (Cosgaya et al., 2002) and it has been reported that Egr1 modulates p75NTR expression in Schwann cells (Nikam et al., 1995), we tested whether Egr1 and/or Egr3 can regulate p75NTR in spontaneously immortalized rat Schwann cells (iSCs). Enforced expression of either Egr1 or Egr3 upregulated p75NTR expression by 5.1-fold and 17-fold, respectively (Fig. 1C). Thus, enforced Egr1 and/or Egr3 protein levels can upregulate p75NTR expression in a variety of cellular contexts.
Figure 1.

Egr1 and Egr3 induce p75NTR expression through species conserved Egr response elements (EREs) in its promoter. p75NTR expression is significantly upregulated by Egr3 (A) 14.2-fold in primary mouse myotubes, (B) 240-fold in mouse embryonic fibroblasts (MEFs) and (C) 5.1-fold by Egr1 and 17-fold by Egr3 in immortalized rat Schwann cells (iSCs). p75NTR expression in cells infected with either Egr1 or Egr3 expressing adenovirus is normalized to expression in cells infected with either Egr3Tr or EGFP expressing adenovirus as indicated. (results represent mean ± standard deviation of three independent experiments, * = p < 0.05, Students t test). (D) Alignment of a portion of the p75NTR 5′ regulatory sequence in mouse, rat and human relative to the transcription start site (arrow) and translation start codon (ATG) shows two highly conserved potential EREs designated E1 upstream of the transcription start site (−56 to −48) and E2 within the 5′ untranslated region (5′UTR) of the first exon (+127 to +136).
Egr1 and Egr3 bind the proximal p75NTR promoter
The alignment of mouse, rat and human p75NTR promoters revealed multiple conserved GC-rich motifs (Fig. 1D), suggesting potential regulatory roles for proteins that bind GC-rich sequences, such as Sp1, WT1, and Egr transcriptional regulators. Egr1 has been shown to bind to a region of the p75NTR promoter which we designated as E1 at −56 to −48 relative to the transcription start site in the mouse (Fig. 1D) and to transactivate p75NTR expression in Schwann cells after axon injury (Nikam et al., 1995). Sequence analysis (AliBaba 2.1, AgeLab, Germany) also revealed a second potential Egr protein binding site in the 5′ UTR which we designated E2 located at +127 to +136 in the 5′UTR of the mouse p75NTR gene relative to the transcription start site (Fig. 1D). Whether Egr1 and/or Egr3 directly regulate p75NTR expression and through which binding sites they may confer transcriptional activation has not been examined in detail. If Egr1 and/or Egr3 directly regulate p75NTR expression they should bind to the locus regulatory sequences. Chromatin immunoprecipitation (ChIP) combined with end-point (35-cycle) PCR and qPCR was used to determine whether Egr1 and/or Egr3 directly bind to DNA near the p75NTR locus in vivo. Genomic DNA bound by Egr3 was recovered by ChIP and analyzed by PCR from MEFs infected with Egr3 expressing adenovirus. Egr3 protein was bound in vivo near the p75NTR transcription start site (Fig. 2A, Pr1/Pr2) but not to regions of the promoter 1.5–1.8kb upstream of the transcription start site (Fig. 2A, Pr3/Pr4). The end-point PCR results were confirmed by qPCR which showed a significant (10.2-fold) enrichment of Egr3 bound to proximal, but not distal, regions of the p75NTR promoter (Fig. 2A). To examine whether Egr1 and/or Egr3 were bound to p75NTR regulatory sequences in the context of endogenous (rather than supra-physiologic) levels of Egr protein, we examined immortalized rat Schwann cells (iSCs) that express p75NTR (Bolin et al., 1992), Egr1 and Egr3 (Fig. 2B, inset) in serum containing media. ChIP-PCR showed that Egr1 and Egr3 were bound to p75NTR proximal (Fig. 2B, Pr1′/Pr2′), but not distal (Fig. 2B, Pr3′/Pr4′), to the transcription start site. The end-point PCR results were again confirmed by qPCR which showed a significant 4-fold enrichment of Egr1 protein and a 2.8-fold enrichment of Egr3 protein bound to regions proximal, but not distal, to the p75NTR transcription start site. Thus, both Egr1 and Egr3 can bind to regions of the p75NTR promoter near the transcription start site in vivo.
Figure 2.

Both Egr1 and Egr3 bind to the p75NTR promoter in vivo. (A) ChIP performed on nuclear lysates from primary mouse embryonic fibroblasts (MEFs) infected with Egr3 expressing adenovirus demonstrates that Egr3 directly binds to p75NTR in vivo. Immunoprecipitation using Egr3 specific anti-serum (α3), shows that Egr3 directly binds to a region proximal (Pr1–Pr2), but not distal (Pr3–Pr4) to the putative E1 and E2 response elements in p75NTR. (B) Immortalized rat Schwann cells (iSCs) express endogenous Egr1 and Egr3 (inset) in serum containing growth medium. The ubiquitous histone deacetylase 1 (HDAC1) nuclear protein is also shown as a reference. Immunoprecipitation using either Egr1 (α1) or Egr3 (α3) specific anti-serum, but not non-specific IgG, shows that both Egr1 and Egr3 bind proximal (Pr1′–Pr2′) but not distal (Pr3′–Pr4′) to the putative E1 and E2 response elements. For both MEFs and iSCs, the enrichment of chromatin precipitated by α3 or α1 relative to IgG is assessed by endpoint (35-cycle) PCR (left) and qPCR (right). (primer locations are indicated relative to mouse and rat p75NTR transcriptional start sites, respectively, and qPCR results represent mean ± standard deviation of three independent experiments, * = p < 0.05, Student’s t test)
Egr1 and Egr3 preferentially transactivate the p75NTR promoter through different response elements
Egr transcription factors modulate target gene expression by binding to Egr response elements (EREs) in target gene promoters to facilitate gene transcription. Since Egr1 and Egr3 bind to the proximal p75NTR promoter in vivo, we generated luciferase reporter constructs to test whether they can transactivate it in vitro. Systematic promoter deletion and luciferase analysis demonstrated that Egr1 and/or Egr3 could transactivate the minimal promoter (−250 to +170 relative to the transcription start site in the mouse promoter) and that transactivation was impaired when regions containing E1 or E2 were deleted from the promoter region (data not shown). These results suggested that E1 and E2 may represent functional EREs to which Egr proteins were bound on the p75NTR promoter. Since the ChIP assays could not precisely define where Egr proteins were bound on the p75NTR promoter, we next examined whether Egr1 and/or Egr3 could bind E1 and/or E2 in vitro using EMSA and iSC nuclear lysates which contain endogenous Egr1 and Egr3 protein (Fig. 2B, inset). Egr1, Egr3, and the transcription factor Sp1 were bound to E1 in vitro (Fig. 3A, lane 1–6). Interestingly, Egr1 and Egr3 appeared to have a lower affinity for E2 when a comparable amount of iSC nuclear lysate and probe activity were used in the binding assays with E1 and E2 (Fig. 3A, compare lanes 1–6 to lanes 7–11). Whereas Egr1, Egr3, and Sp1 contained within the iSC nuclear lysates clearly bound to E1 (Fig. 3A, lane 1), very little binding to E2 was observed (Fig. 3A, lane 7). However, when Egr1 and Egr3 protein levels were substantially augmented by adenovirus enforced expression, Egr1 (Fig. 3A, lane 8) and Egr3 (Fig. 3A, lane 10) were bound to E2. The identity of the E1 and E2 binding proteins were confirmed by supershifting the complexes with specific Egr1 (Fig. 3A, lanes 4 and 9) and Egr3 (Fig. 3A, lanes 6 and 11) antibodies. The supershift complexes were relatively unstable and formed fain complexes but the antibodies clearly disrupted the formation of the protein-DNA complexes. These results suggest that E2 represents a relatively low affinity Egr protein binding site that is occupied when Egr1 and Egr3 proteins are substantially induced above basal levels.
Figure 3.

Egr1 and Egr3 bind to the E1 and E2 response elements in the p75NTR promoter in vitro. (A) E1 and E2 represent high- and low-affinity Egr binding sites in the p75NTR promoter, respectively. Egr1, Egr3 and the transcriptional regulator Sp1 are present within nuclear lysates from iSCs grown in serum containing media and all of them bind to E1 (lane 1). Sp1 (lane2), Egr1 (lane 4), and Egr3 (lane 6) are identified within the shifted complexes bound to E1 by the formation of relatively unstable supershift complexes (arrows with asterisk) and concomitant disruption of the protein-DNA complex by antibodies that specifically bind to the respective proteins. The Egr1 containing complex is obscured by the intense Sp1 complex that runs with similar mobility (lanes 3 and 4). When E2 is used as a probe, the endogenous levels of Egr1 and Egr3 in iSCs grown in serum do not form detectable complexes with the probe (lane 7). However, when the levels of Egr1 protein are elevated by infection with Egr1 expressing adenovirus, a faint complex is formed (lane 8) which is shifted away by an Egr1 specific antibody (lane 9). Similarly, when iSCs are infected with Egr3 expressing adenovirus, a prominent complex with Egr3 is formed (lane 10) that is shifted away by the addition of Egr3 specific antibody (lane 11). (B) Egr1 protein present in nuclear lysates from Egr1-expressing adenovirus infected immortalized rat Schwann cells (iSC-Ad Egr1) or Egr3 protein present in Egr3-expressing adenovirus infected immortalized rat Schwann cells (iSC-Ad Egr3) bind to a double stranded E1 oligo but not an E1m oligo which has a mutation within the core Egr binding domain (gray). (C) Similarly, Egr1 and Egr3 bind to E2 but not E2m which also contains a mutation that disrupts Egr protein binding.
We next tested whether E1 and E2 represent functional EREs using site-directed mutagenesis to generate mutations that abrogate Egr1 and Egr3 binding in E1 (E1m; Fig. 3B), E2 (E2m; Fig. 3C), or both E1 and E2 (E1m + E2m). Luciferase promoter constructs with intact or mutated E1 and/or E2 were cotransfected with constructs that expressed Egr1 or Egr3 (see methods). Relative to the minimal p75NTR luciferase promoter construct (Fig. 4, construct 1), which was significantly activated by both Egr1 and Egr3, E1m resulted in a significant decrease in Egr1-, but not Egr3-mediated transactivation (Fig. 4, construct 2). By contrast, E2m resulted in a significant decrease in Egr3-transactivation and a moderate super-activation by Egr1 (Fig. 4, construct 3). As expected, E1m and E2m resulted in significant reduction of both Egr1- and Egr3-mediated transactivation (Fig. 4, construct 4). These results indicate that Egr1 preferentially transactivates p75NTR through E1 and Egr3 preferentially transactivates through E2.
Figure 4.

Egr1 and Egr3 transactivate p75NTR through distinct E1 and E2 response elements, respectively. Mutations that specifically disrupt Egr1 and Egr3 binding to E1 (Fig. 4B) and E2 (Fig. 4C) were introduced into construct 1. While either Egr1 or Egr3 markedly transactivate the minimal p75NTR promoter (construct 1), transactivation by Egr1, but not Egr3, is significantly reduced when E1 is mutated (construct 2). Interestingly, while transactivation by Egr1 is slightly superactivated when E2 is mutated, transactivation by Egr3 is significantly reduced (construct 3). When both E1 and E2 are mutated (construct 4), transactivation by either Egr1 or Egr3 is significantly impaired. (RLU = relative light units representing values normalized for transfection efficiency; results represent mean ± standard deviation of three independent transfection experiments; * = p < 0.05; Student’s t test compared to construct 1)
Egr3 modulates p75NTR expression in muscle spindle stretch receptors in vivo
Egr1 and Egr3 directly transactivate p75NTR through distinct EREs in vitro, but whether Egr1 and/or Egr3 modulate p75NTR expression in vivo is not known. Egr3 is strongly expressed in developing muscle spindle stretch receptors where it is required for their normal development (Tourtellotte et al., 2001; Tourtellotte and Milbrandt, 1998). Similarly, p75NTR has an important role in modulating neurotrophin-3 (NT-3) signaling which is also required for normal spindle development (Fan et al., 1999). Thus, we asked whether Egr3 may have a role in modulating p75NTR expression in spindles. Interestingly, we found that Egr3 (Fig. 5A, arrowheads) and p75NTR (Fig. 5A′, adjacent section, arrowheads) were robustly and specifically co-expressed in all skeletal muscle spindle stretch receptors. Egr3 and p75NTR was expressed by both spindle capsule cells and intrafusal muscle fibers (Fig. 4A and A′, inset). These results were confirmed by immunofluorescence which showed that both Egr3 and p75NTR protein were highly co-localized in spindle capsule cells and intrafusal muscle fibers (Fig. 5B, arrowhead) but not in skeletal muscle endomyseum, where only p75NTR protein was present (Fig. 5B, arrow and Fig. 5C). p75NTR expression in spindles is not regulated by Egr1 since Egr1 was not expressed in spindle stretch receptors or skeletal muscle (Fig. 5D). Thus, spindle stretch receptors appear to be an excellent model system to examine whether Egr3 modulates p75NTR expression in vivo. To this end, the immunofluorescence intensity of p75NTR protein was measured in WT and Egr3-deficient spindles which were identified in skeletal muscle by their parvalbumin (Pv)-positive sensory axon innervation (Fig. 6A, B, D, E, arrowheads and see (Tourtellotte and Milbrandt, 1998)). In E16.5 Egr3-deficient spindles, p75NTR protein was significantly reduced by 58% in E16.5 spindles (Fig. 6C) and by 69% in P0 spindles (Fig. 6F) relative to WT spindles.
Figure 5.
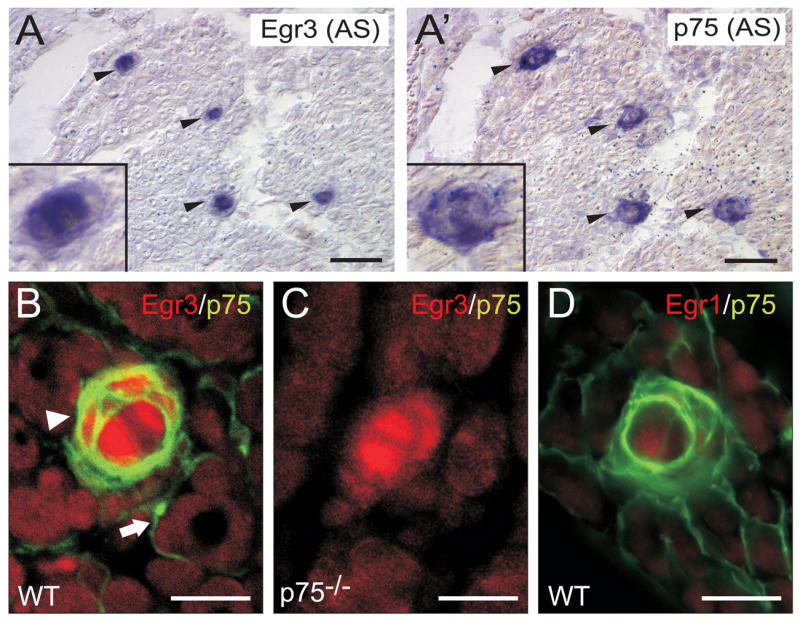
Egr3 expression is colocalized with p75NTR expression in muscle spindles. In situ hybridization on adjacent wild type (WT) newborn skeletal muscle sections demonstrates strong (A) Egr3 and (A′) p75NTR expression specifically in muscle spindles (arrowheads). (B) Egr3 (red) and p75NTR (green) proteins are colocalized in intrafusal muscle fibers and spindle capsule cells of spindle stretch receptors (arrowhead), but only p75NTR protein is present in the muscle endomyseum (arrow). (C) The p75NTR antibody is highly specific, as there is complete loss of protein staining in spindles and the muscle endomyseum in p75NTR-deficient skeletal muscle. (D) Egr1 is not expressed by muscle spindles, consistent with the fact that Egr3, but not Egr1, is essential for regulating gene expression necessary for normal spindle stretch receptor morphogenesis. (scale bar = 20μm)
Figure 6.

p75NTR expression is deregulated in Egr3-deficient muscle spindle stretch receptors. (A) In E16.5 wild type (WT) and (D) P0 (newborn) skeletal muscle, p75NTR protein (green) is present in spindle stretch receptors (arrowhead) and muscle endomyseum. In Egr3-deficient (B) E16.5 and (E) P0 skeletal muscle, p75NTR protein is significantly decreased in spindle stretch receptors but not in muscle endomyseum. (C, F) Comparative quantitative fluorescence analysis shows that p75NTR protein is reduced by 58% in E16.5 spindles and by 69% in P0 Egr3-deficient spindles relative to wild type. Parvalbumin (Pv) immunohistochemistry is used to localize the Ia-sensory axons that innervate the spindle stretch receptors (red). (results represent mean ± standard deviation of fluorescence intensity measurements from 15–20 spindles in two separate animals from each genotype and age; * = p < 0.05; Student’s t test compared to wild type; scale bar = 20μm).
Egr1 and Egr3 exhibit functional redundancy in modulating p75NTR expression in sciatic nerves
Egr1, Egr3, and p75NTR are all expressed in rat iSCs grown in serum containing media. Our results indicate that enforced Egr1 or Egr3 expression can upregulate p75NTR expression and either Egr1 or Egr3 can activate p75NTR promoter activity in vitro. Since p75NTR has an essential role in regulating peripheral axon myelin thickness in vivo (Cosgaya et al., 2002) and since Egr1 has been previously shown to regulate p75NTR expression in Schwann cells in vitro (Nikam et al., 1995), we examined whether Egr1 and/or Egr3 could modulate p75NTR expression in Schwann cells in vivo. Egr1 (Fig. 7A, arrowheads) and Egr3 protein (Fig. 7B, arrowheads) were present in a subpopulation of Schwann cells in WT mouse sciatic nerves that also contained p75NTR protein. The extent to which Egr1 and Egr3 were co-localized in particular Schwann cells that expressed p75NTR could not be determined since antibodies for Egr1 and Egr3 generated in different species were not available. Nevertheless, both Egr1 and Egr3 were required for normal expression of p75NTR since p75NTR expression in Egr1−/− and Egr3−/− sciatic nerves was similar to wild type, but in nerves lacking both Egr1 and Egr3 (Egr 1/3 DKO), it was significantly decreased by 82.5% (Fig. 7C). Although Egr1 and Egr3 appeared to complement each other to maintain WT levels of p75NTR expression in Schwann cells, this was not due to a compensatory upregulation by either Egr1 or Egr3 expression (Fig. 7D). Accordingly, p75NTR protein was also decreased by 42% in Egr1/3 DKO sciatic nerves relative to WT (Fig. 7E, F) and importantly, the loss of Egr1 and Egr3 in sciatic nerves had no effect on Egr2 protein (Fig. 7E), a closely related Egr protein that is critical for regulating myelin associated genes that are essential for peripheral nerve myelination (Topilko et al., 1994).
Figure 7.

Functional complementation by Egr1 and Egr3 to regulate p75NTR expression in sciatic nerves in vivo. (A, B) Egr1 and Egr3 are expressed in many p75NTR expressing-Schwann cells in mouse sciatic nerves (Egr1/Egr3 (red), p75NTR (green), DAPI nuclear stain (blue)). (C) qPCR analysis of p75NTR expression in P21 mouse sciatic nerve demonstrates that expression is reduced by 82.5% in 1/3 DKO compared to WT, Egr1−/− or Egr3−/− nerves. p75NTR expression is not altered in Egr1 or Egr3 single knockout sciatic nerves compared to WT. (D) Although Egr1 and Egr3 apparently complement each other to regulate p75NTR expression, this is not due to upregulation of either Egr1 or Egr3 expression. There is no evidence of either Egr1 upregulation in Egr3−/− nerves or Egr3 upregulation in Egr1−/− nerves. (qPCR results from C and D represent mean ± standard deviation of GAPDH normalized p75NTR expression compared to WT levels from N=12 WT, N=5 Egr1−/−, N=7 Egr3−/−, and N=5 Egr 1/3 DKO sciatic nerves; * = p < 0.05; Student’s t test compared to the level of p75NTR expression in WT nerves) (E) p75NTR protein deregulation is confirmed in 1/3DKO mouse sciatic nerves compared to wild type. Moreover, in the absence of both Egr1 and Egr3, there is no change in the level of Egr2 protein, a closely related transcriptional regulator known to be essential for peripheral nerve myelination. (F) The results are confirmed by densitometry analysis which shows a 42% decrease in p75NTR protein levels in 1/3 DKO sciatic nerves compared to WT. (results represent mean ± standard deviation of p75NTR protein compared between WT (N=4) and 1/3 DKO (N=4) sciatic nerves; * = p < 0.05; Student’s t test; scale bar = 20μm).
Degregulation of p75NTR expression correlates with peripheral nerve myelination defects in 1/3 DKO mice
The peripheral nerve myelin sheath is a specialized membrane produced by Schwann cells that surrounds myelinated axons and is required for normal axon development and rapid saltatory conduction of action potentials. p75NTR is essential to establish normal myelin sheath thickness around axons during development since germline p75NTR-deficient mice have markedly thin (but not absent) peripheral axon myelin (Cosgaya et al., 2002). Similarly, p75NTR is also necessary for myelin sheath regeneration after nerve injury (Song et al., 2006), a situation where Egr1 is known to be markedly upregulated (Nikam et al., 1995). These previous results suggest that if decreased p75NTR expression in 1/3 DKO sciatic nerves is physiologically relevant, peripheral axon myelin thickness should be decreased. Indeed, compared to axons in WT sciatic nerves (Fig. 8A), axons in 1/3 DKO sciatic nerves appeared to have generally thinner myelin sheaths (Fig. 8B). Since myelin thickness positively correlates with axon diameter (Gillespie and Stein, 1983), we first examined whether there was any significant difference in myelinated axon diameter between WT and 1/3 DKO sciatic nerves. Morphometric analysis of axon diameter showed no significant difference in the axon diameter-frequency distribution between WT and 1/3 DKO sciatic nerves (Fig. 8C). By contrast, there was a highly significant left shift in the myelin thickness-frequency distribution of 1/3 DKO myelinated axons, indicating that there was a decrease in myelin thickness when axons of similar diameter were compared (Fig. 8D). These results were confirmed by plotting the axon g-ratio (the ratio of axon diameter to fiber diameter, Fig. 8E, inset) as a function of axon diameter. The results showed a significant increase in g-ratio (thinner axon associated myelin) across all axon diameters as indicated by the upward shift of the regression line in 1/3 DKO sciatic nerves (Fig. 8E, solid line) relative to WT sciatic nerves (Fig. 8E, dashed line). These results are consistent with decreased p75NTR expression in 1/3 DKO nerves that would be expected to lead to decreased myelin thickness in the absence of significant axon atrophy (Cosgaya et al., 2002).
Figure 8.

Diminished peripheral nerve myelination in Egr1/3 DKO mice. Compared to (A) WT axons, (B) 1/3 DKO peripheral axons have thinner myelin sheaths (P6 sciatic nerve shown). (C) While axon diameter is not significantly different between WT and 1/3 DKO sciatic nerves, there is (D) a significant decease in myelin thickness in 1/3 DKO nerves. (E) Morphometric analysis shows a quantitative decrease in myelin thickness (increased g-ratio) across all axon diameters. The least squares fit of the data (dashed and solid lines) show a significant increase in axon g-ratio in 1/3 DKO sciatic nerves compared to WT. (morphometry results of 1500–1800 axons analyzed from 3 animals of each genotype; * = p < 0.05; Student’s t test; scale bar = 10μm)
Discussion
Egr transcriptional regulators are well suited to dynamically modulate gene expression during development, injury and regeneration. Egr genes encode transiently expressed and relatively unstable transcriptional regulatory proteins that modulate target gene expression in a restricted temporal and spatial context. Here, we showed that the low affinity neurotrophin receptor p75NTR, a multi-functional receptor highly regulated during development, injury and regeneration, is directly regulated by Egr1 and Egr3. Moreover, since p75NTR signals primarily by associating with a variety of co-receptors to mediate different cellular responses, dynamic cell-specific regulation of this receptor represents a potentially important mechanism for controlling when, where, and how it signals in vivo.
Both Egr1 and Egr3 were capable of inducing p75NTR expression in vitro and we confirmed using ChIP and luciferase assays that both Egr1 and Egr3 directly bind and transactivate the p75NTR promoter. We identified two binding domains (E1 and E2) within p75NTR regulatory sequences that accounted for most of the Egr-mediated transactivation. While Egr1 and Egr3 were capable of binding to both sites, there was a clear difference in their ability to transactivate p75NTR through these sites. By generating point mutations in E1 that impaired Egr1 and Egr3 binding, we found that Egr1 preferentially transactivated through this site and that it was also important for a significant amount of the basal promoter activity. Interestingly, when point mutations were introduced to impair Egr1 and Egr3 binding to E2, we found that Egr3 preferentially transactivated through this site. Moreover, using gel shift (EMSA) assays, we found that there was a marked difference in the affinity of Egr1 and Egr3 to bind E1 and E2. Whereas E1 avidly bound Egr1, Egr3, and the basal transcription factor Sp1 (Philipsen and Suske, 1999) contained within the iSC nuclear lysates, binding to E2 using the same lysates was not detected. Nevertheless, E2 appeared to be a low-affinity Egr1/Egr3 binding site since only high levels of Egr1 and Egr3 protein resulted in detectable binding to E2. Thus, E1 appears to represent a high-affinity Egr1, Egr3, and Sp1 binding site that may be important for regulating basal p75NTR expression and Egr1-mediated expression. By contrast, the low-affinity E2 site, which was bound once Egr1 and Egr3 proteins were elevated and which was preferentially transactivated by Egr3, may represent a site through which induced Egr3 protein can preferentially modulate p75NTR expression. Egr proteins have highly conserved DNA binding domains that bind similar regions of DNA and therefore it has been widely presumed that they have highly redundant function for regulating particular target genes (O’Donovan et al., 1999). However, Egr proteins also contain divergent transactivation domains that may recruit differing co-regulators to the transcription complex. The DNA context of the Egr binding sites may also contribute to interactions with other DNA binding proteins. These details may explain how Egr1 and Egr3 can both bind E1 and E2 yet differentially transactivate through them. In addition, E1 and E2 appear to have very different affinities for Egr1 and Egr3 providing a novel level of regulatory control to modulate p75NTR transcription when cellular levels of Egr1 and/or Egr3 are induced by appropriate stimuli. The extent to which p75NTR expression is differentially regulated by Egr1 and Egr3 through E1 and E2, and under what physiologic circumstances they may have relevance, will have to be determined through additional molecular genetic in vivo analysis.
Regulation of p75NTR gene expression by Egr3 was confirmed in vivo by examining muscle stretch receptors in wild type and Egr3-deficient mice. Muscle spindle stretch receptor development depends upon Egr3 to regulate target genes that are essential for receptor morphogenesis (Albert et al., 2005; Tourtellotte et al., 2001; Tourtellotte and Milbrandt, 1998) and p75NTR expression is required to modulate neurotrophin NT-3/TrkC receptor signaling that is required for normal spindle formation (Fan et al., 1999). Thus, spindles represent a useful developmental system to study the in vivo relationship between Egr3 and p75NTR expression because other Egr transcription factors are not expressed by spindles. Egr3 and p75NTR expression were highly co-localized in muscle spindle intrafusal fibers and cells forming the spindle capsule. However, p75NTR protein was also observed in non-Egr3 expressing muscle endomyseal cells, demonstrating that p75NTR is also regulated by non-Egr mediated mechanisms. Nevertheless, in Egr3-deficient spindles p75NTR protein was quantitatively decreased to levels found in endomyseum, demonstrating a direct correlation between loss of Egr3 and deregulation of p75NTR expression. Taken together with the promoter analysis studies, these results confirm that p75NTR is a physiologic target of Egr3 and demonstrate that it is one of potentially many target genes regulated by Egr3 to facilitate muscle spindle morphogenesis (Albert et al., 2005).
Peripheral nerves also represent a physiologic system to examine the relationship between Egr1, Egr3, and p75NTR expression since all three molecules are expressed in Schwann cells. In Egr1/3 DKO sciatic nerves, p75NTR message and protein levels were significantly diminished. This did not occur in the context of loss of either Egr1 or Egr3 alone and neither molecule was upregulated in the absence of the other. These results are consistent with the p75NTR promoter analysis which showed that either Egr1 or Egr3 can transactivate the promoter and that when E1 and E2 are both mutated to impair Egr1 and Egr3 binding to the promoter, transactivation is significantly impaired. p75NTR has an important role in modulating myelin thickness during development suggesting that if p75NTR deregulation in Egr 1/3 DKO nerves is physiologically relevant, abnormally thin myelin sheaths should be observed similar to that which occurs in p75NTR-deficient mice (Cosgaya et al., 2002). Indeed, the thickness of compact myelin sheaths was significantly decreased in 1/3 DKO nerves despite absence of significant axon atrophy. Interestingly, Egr2 protein, an Egr protein that is essential for regulating myelin associated gene expression during early peripheral nerve myelination (Topilko et al., 1994), was not altered in 1/3 DKO nerves. Thus, decreased compact myelin thickness is consistent with diminished p75NTR expression in 1/3 DKO nerves and is not due to an impairment in myelination mediated by Egr2. Moreover, despite the fact that Egr2 was present at normal levels in 1/3 DKO sciatic nerves relative to wild type, it was not capable of compensating for the loss of Egr1 and Egr3 to regulate p75NTR. Taken together, these data show that, while Egr1 and Egr3 are clearly not the only regulators of p75NTR expression, they are highly inducible transcriptional regulators with an important physiologic role in modulating its expression.
Experimental Methods
Animals
Egr1-deficient and Egr3-deficient mice were generated and genotyped as previously described (Lee et al., 1996; Tourtellotte and Milbrandt, 1998). Egr1-deficient mice were backcrossed 10 generations to C57BL/6J mice and Egr3-deficient mice were backcrossed 6 generations to C57BL/6J mice. p75NTR exonIII-deficient mice were obtained from Jackson laboratories on a C57BL/6 genetic background (Lee et al., 1992) and genotyped by PCR using primers: 5′-TGTTACGTTCTCTGACGTGGTGAG-3′, 5′-TCAGCCCAGGGTGTGCACTC-3′, 5′-GGCCTACCCGCTTCCATTGCTCAG-3′. Littermate wild type and mutant mice were used as appropriate for comparison. All experimental procedures complied with protocols approved by Northwestern University Institutional Animal Care and Use Committee.
Cell Culture
Primary myoblasts were isolated and differentiated into myotubes for 10 days in vitro (DIV) as previously described (Albert et al., 2005). Primary mouse embryonic fibroblasts (MEFs) were isolated from E16.5 C57BL/6J mouse embryos. Briefly, E16.5 embryos were removed from the uterus of deeply anesthetized female mice. They were decapitated, eviscerated, minced and digested in 0.25% Trypsin/EDTA (Mediatech, Herndon, VA). After digestion in 0.25% Trypsin/EDTA at 37°C for 15 minutes (twice), cells were plated in Dulbecco’s minimum essential medium (DMEM, Mediatech, Herndon, VA) supplemented with 10% fetal bovine serum (Invitrogen, Carlsbad, CA), 1x MEM nonessential amino acids (Mediatech, Herndon, VA) and P/S (100U/ml of penicillin, 100ug/ml of streptomycin, Mediatech, Herndon, VA). The MEFs were split when they reached 60–70% confluence. All experiments were carried out with early passage (<6) MEFs. NIH3T3 mouse fibroblasts were purchased from American Type Culture Collection (ATCC, Manassas, VA) and maintained in DMEM supplemented with 10% calf serum (Invitrogen, Carlsbad, CA) and P/S at 37°C and 5% CO2. Spontaneously immortalized rat primary Schwann cells (iSCs; a generous gift from S. Cohn, University of Chicago) were maintained in DMEM containing 10% horse serum (Invitrogen, Carlsbad, CA) and P/S at 37°C and 7.5% CO2.
Adenovirus infection
The generation, characterization, amplification and titration of the enhanced green fluorescent protein (EGFP), Egr1, Egr3, and truncated Egr3 (Egr3Tr) expressing adenoviruses were described previously (Albert et al., 2005; Li et al., 2005). The adenoviruses alls express EGFP and rat Egr1, Egr3 or a truncated form of Egr3 (EgrTr) that lacks the n-terminal transactivation domain which renders it transcriptionally inactive. Primary myotubes, MEFs, or iSCs were infected with EGFP, Egr1, Egr3, or Egr3Tr expressing adenovirus with a multiplicity of infection of approximately 100 to obtain 100% infection efficiency with minimal identifiable toxicity. Since all adenoviruses also expressed EGFP, infection efficiency was monitored by EGFP fluorescence.
RNA preparation and quantitative real–time PCR (qPCR)
Total RNA was isolated from P21 sciatic nerves, adenovirus-infected primary myotubes, MEFs or iSCs using Trizol (Invitrogen, Carlsbad, CA). Total cellular RNA (0.5 to 1.0 μg) was reverse transcribed using random octomer priming and Powerscript reverse transcriptase according to the manufacturer’s specifications (BD Biosciences Clontech, Palo Alto, CA). qPCR using an SDS 5700 sequence detector (Applied Biosystems, Foster City, CA) and SYBR green (Molecular Probes, Eugene, OR) fluorescence chemistry was performed as previously described (Albert et al., 2005).
Chromatin immunoprecipitation (ChIP)
DNA binding proteins were cross-linked by treating cells with 1% formaldehyde for 10 minutes at room temperature. Chromatin was isolated and sheared into ~600bp fragments using sonication as previously described (Albert et al., 2005; Li et al., 2005). Chromatin immunoprecipitation (ChIP) was performed using 5μg of either rabbit anti-Egr1 (588) antibody, anti-Egr3 (C-14) antibody (Santa Cruz Biotechnology, Santa Cruz, CA) or normal rabbit IgG (Jackson Immunoresearch, West Grove, PA). To evaluate the relative enrichment of p75NTR promoter fragments bound to Egr proteins in the ChIP libraries, qPCR was performed using primers that amplified regions of the p75NTR promoter near the transcription start site (proximal) and ~1.5 kb 5′ to the transcription start site (distal). The samples were normalized to GAPDH to control for non-specific DNA bound by the antibodies. The fold enrichment of p75NTR promoter DNA represented in the Egr1 or Egr3 antibody-precipitated genomic DNA was compared relative to that found in IgG precipitated (non-specific) DNA. In addition, end-point PCR was performed by using the ChIP DNA as a template, 35 cycles of amplification, and agarose gel electrophoresis.
Primer sequences used in this study
Mouse/rat p75NTR mRNA (GenBank NM_033217.1, nt 990–1236): forward: 5′-CCCTCAAGGGTGATGGCAACCTCT-3′, reverse: 5′-TGTCAGCTCTCTGGATGCGTCGC-3′. Mouse/rat GAPDH mRNA (GenBank NM_001001303, nt 210–635): forward: 5′-ACGGCAAATTCAACGGCACAGTCA-3′, reverse: 5′-GCTTTCCAGAGGGGCCATCCACAG-3′. Mouse Egr1 mRNA (GenBank NM_007913.2, nt 2190–2590): forward: 5′-GCCTTCTCCAGCTGCTTCAT-3′, reverse: 5′-GAGCCTTTAAGTCCTGGGAGC-3′. Mouse Egr3 mRNA (GenBank NM_018781.1, nt163–563): forward: 5′-ATGGACATCGGTCTGACCAAC-3′, reverse: 5′-AAAAGATTGCTGTCCAAGGCC-3′. For ChIP, mouse p75NTR proximal promoter (UCSC mouse genome, nt +201–+506): Pr1: 5′-TGCTGCTG CTTCTAGGGGT-3′, Pr2: 5′-ACCCGTCGTAGTGCTCAA-3′. Mouse p75NTR distal promoter (UCSC mouse genome, nt −1845–−1520): Pr3: 5′-TATTTAAATTAATGCCACACTGTCG-3′, Pr4: 5′-AAACCTATCCTATGTAGCCAATAAA-3′. Rat p75NTR proximal promoter (UCSC rat genome, nt +43–+311): Pr1: 5′-CGCTGGAGCGCATCGCAGTTC-3′, Pr2: 5′-CGCCACCCGTTCCCAACA-3′. Rat p75NTR distal promoter (UCSC rat genome, nt −1705–−1383): Pr3: 5′-CTAGGAAATCACCTACTTGTGAGCA-3′, Pr4: 5′-CATCAAAACCTGGCACCCTTA-3′.
p75NTR promoter reporter constructs and luciferase assays
The parental p75NTR minimal promoter plasmid (−250 to +170) was generated by cloning a BamHI/NcoI fragment of mouse p75NTR genomic DNA into the pGL3 basic luciferase reporter vector (Promega, Madison, WI). The p75NTR (−124 to +170) and p75NTR (−9 to +170) constructs were generated by deletion of SacI/AvrII or NheI/NheI fragment from the parental plasmid, respectively. The p75NTR (−9 to +77) plasmid was generated by deletion of an XhoI/BssHII fragment from p75NTR from p75NTR (−9 to +170) and the p75NTR (−46 to +170) plasmid was generated by PCR using the parental p75NTR (−250 to +170) plasmid as a template and cloning the amplification product into pGL3. All plasmids were sequence verified. Site-directed mutagenesis of the parental p75NTR (−250 to +170) plasmid was performed with the QuikChange site-directed mutagenesis kit following the manufacturer’s specifications (Stratagene, La Jolla, CA). The Egr binding site reported previously (Nikam et al., 1995) was designated as E1 (nt −56 to nt −48, GAGGAGGCG) and the mutation which abrogates Egr protein binding (GAGGAAAAG) was generated and designated E1m. A second site, predicted by AliBaba 2.1 software (Grabe, 2002), was designated as E2 (nt +127 to nt +136, GCCGGAGGCG) and the mutation which also disrupts Egr protein binding to that site (GCCGGAAAAG) was generated and designated E2m. In addition, a luciferase reporter construct containing both mutations E1m and E2m was generated using site-directed mutagenesis and sequence verified.
Luciferase reporter assays were performed by co-transfecting 50ng of p75NTR promoter reporter plasmid, 5ng of pCMV-RL and 1μg of CMV-Egr1, CMV-Egr3, or pcDNA3 into NIH3T3 fibroblasts using Lipofectamine Plus reagent (Invitrogen, Carlsbad, CA). Twenty-four hours after transfection, lysates were processed for luciferase activity using the Dual Luciferase Assay Kit according to the manufacturer’s specifications (Promega, Madison, WI). Relative luciferase unit (RLU) values were generated by normalizing the firefly luciferase counts to Renilla luciferase counts generated from pCMV-RL. The reporter assays were repeated a minimum of three times.
In situ hybridization
In situ hybridization was performed using digoxigenin-labeled riboprobes and previously published standard protocols (Darby, 2000). In situ hybridization probes were generated as previously described (Albert et al., 2005). In all cases, a sense (S) riboprobe was used on parallel tissue sections to control for nonspecific hybridization and antisense (AS) riboprobes were used to examine gene-specific expression. The probes used in this study spanned the following gene coding sequences: Egr3 (GenBank NM_018781, nt 890 to nt 1389) and p75NTR (GenBank BC_038365, nt 253 to nt 767).
Immunohistochemistry
Deeply anesthetized mice were perfused through the heart with 4% paraformaldehyde/0.1 M phosphate buffer (pH=7.4). Hindlimbs and sciatic nerves were frozen in OCT compound (Sakura Finetek, Torrance, CA) after 6-hours post-fixation in perfusion buffer and a 24-hour equilibration in 30% sucrose/0.1 M phosphate buffer (pH=7.4). Serial 16-μm transverse sections were cut in a cryostat and incubated with primary and secondary antibodies that recognized Egr1 (C-19), Egr3 (H-180) (both diluted 1:1000, Santa Cruz Biotechnology, Santa Cruz, CA), p75NTR ECD (diluted 1:2,500, R&D Systems, Minneapolis, MN), and/or parvalbumin (R301, diluted 1:1000; a generous gift from K.G. Baimbridge, University of British Columbia). The primary antibodies were detected using Cy3 (Jackson Immunoresearch, West Grove, PA) or Alexa 488 (Invitrogen, Carlsbad, CA) fluorophore-conjugated secondary antibodies. The images were acquired with a digital camera (Spot RT-Slider, Diagnostic Instruments) attached to a model E600 Nikon microscope. The images were constructed into montages using Adobe Photoshop software without any further manipulation. For quantification, fluorescent images were captured with a Zeiss LS510 confocal microscope using identical aperture and photomultiplier tube voltage settings to ensure accurate comparison between images from wild type and Egr3−/− mice. The images were assembled into montages with Adobe Photoshop software and were not further manipulated so that fluorescent intensity measurements could be compared between samples using ImageJ software (NIH).
Electromobility shift assay (EMSA)
DNA binding proteins were extracted from MEFs or iSCs. The cells were washed once in cold PBS and resuspended in 400 μL of ice-cold lysis buffer (10 mM HEPES, pH 7.9, 1.5 mM MgCl2, 10 mM NaCl, 0.5 mM dithiothreitol, 1 mM Na3VO4, 10 mM NaF, 20 mM 2-phosphoglycerate, and Complete protease inhibitors (Roche, Alameda, CA). Dissociated cells were allowed to swell on ice for 15 min, after which 25 μL of 10% NP-40 was added, and the tubes were vortexed for 10 seconds. After centrifugation and removal of the supernatant, the nuclear pellet was resuspended in 100 μL ice-cold extraction buffer (20 mM HEPES, pH 7.9, 0.4 mM NaCl, 1 mM EDTA, 1 mMDTT, 1 mMNa3VO4, 10 mM NaF, 20 mM 2-phosphoglycerate, and Complete protease inhibitors for 20 min. Binding reactions using the nuclear protein extracts were performed at room temperature for 20 min with 10 μg of nuclear extract, 0.5 ng 32P-labeled oligonucleotide probe, 1 mg poly(dI-dC) in a binding buffer consisting of 10 mM Tris (pH 7.5), 26 mM KCl, 1 mM MgCl2, 0.5 mM ZnCl2, 1 mM EDTA, 5 mM DTT, and 5% (vol/vol) glycerol. For supershift experiments, 2 μg of anti-Sp1 (sc-59x), anti-Egr1 (sc-189x), or anti-Egr3 (sc-191x) polyclonal antibodies (Santa Cruz Biotechnology, Santa Cruz, CA) were added to the binding reactions and incubated for an additional 20 min. Electrophoresis was performed to separate the probe, protein-probe, and antibody-protein-probe complexes. Autoradiography of the dried gel was scanned by a phosphorimager (Biorad, Hercules, CA). The sense sequences of the probes used are as follows: E1: 5′-CGGGGAGGAGGCGGGGCTG-3′, E1m: 5′-CGGGGAGGAAAAGGGGCTG-3′, E2: 5′-GCTGTCGCCGGAGGCGAGCA-3′, E2m: 5′-GCTGTCGCCGGAAAAGAGCA-3′. All probes were 5′end labeled with T4-polynucleotide kinase using [γ-32P]ATP (Perkin Elmer, Boston, MA).
Western blotting
Sciatic nerves from P21 mice were homogenized in RIPA buffer (20 mM Tris, pH=7.7, 150 mM NaCl, 1% NP-40, 0.5% sodium deoxycholate, 0.1% SDS) supplemented with 10nM NaF and Complete protease inhibitors (Roche, Alameda, CA). Eighty micrograms of total cellular protein was resolved by SDS-PAGE and transferred to a nitrocellulose membrane. Blots were probed with antibodies as follows: anti-Egr1 (sc-110) (Santa Cruz Biotechnology, Santa Cruz, CA), anti-Egr3 (gift from Dr J.M. Baraban, Johns Hopkins University), anti-Egr2 (Covance Research Products, Cumberland, VA), anti-ERK (sc-1616) (Santa Cruz Biotechnology, Santa Cruz, CA), anti-HDAC1 (Sigma, St. Louis, MO) or anti-p75NTR ICD (Promega, Madison, WI), then incubated with a horseradish peroxidase-conjugated goat anti-rabbit secondary antibody (Jackson ImmunoResearch, West Grove, PA) and visualized using SuperSignal West Pico chemiluminescent substrate (Pierce, Rockford, IL). For quantification, protein density was analyzed using ImageJ software (NIH) on scanned images. Standard curves were used to ensure that the film band intensities were within the linear range of detection for accurate quantification as previously described (Li et al., 2007).
Histology and peripheral myelination analysis
Six day old, deeply anesthetized mice were perfused through the heart with 0.1M cacodylate buffer (pH=7.4), followed by perfusion with 2.5% gluteraldehyde/2% paraformaldehyde in 0.1M cacodylate buffer. Isolated sciatic nerves were postfixed in 1% osmic acid and embedded in Eponate 12 resin (EMS, Hatfield PA). One-micron transverse sections of nerves were collected, stained with toluidine blue, and examined by light microscopy at 100x magnification using oil immersion optics. For axon diameter and g-ratio calculations, four random non-overlapping regions were imaged from each nerve and every myelinated axon in the field was analyzed. Approximately 1500–1800 axons per genotype (500–600 axons per animal, and three animals per genotype) were analyzed. Calibrated images were analyzed using a DrawingSlateII digitizer (Calcomp, Columbia MD) and SigmaScan image analysis software (Systat, San Jose CA) to measure axon perimeter, axon ferret diameter, fiber perimeter and fiber ferret diameter. The g-ratio, a measure of the myelin thickness of an individual axon, was calculated by dividing the axon ferret diameter by the fiber ferret diameter. Myelin thickness was calculated as 1/2 the fiber ferret diameter minus the axon ferret diameter.
Acknowledgments
We thank L. Eldredge and J. Carter for helpful discussion and comments on the manuscript.
This study was supported by The National Institutes of Health (NS046468 and NS040748).
Footnotes
Publisher's Disclaimer: This is a PDF file of an unedited manuscript that has been accepted for publication. As a service to our customers we are providing this early version of the manuscript. The manuscript will undergo copyediting, typesetting, and review of the resulting proof before it is published in its final citable form. Please note that during the production process errors may be discovered which could affect the content, and all legal disclaimers that apply to the journal pertain.
References
- Albert Y, Whitehead J, Eldredge L, Carter J, Gao X, Tourtellotte WG. Transcriptional regulation of myotube fate specification and intrafusal muscle fiber morphogenesis. J Cell Biol. 2005;169:257–268. doi: 10.1083/jcb.200501156. [DOI] [PMC free article] [PubMed] [Google Scholar]
- Barker PA. p75NTR is positively promiscuous: novel partners and new insights. Neuron. 2004;42:529–533. doi: 10.1016/j.neuron.2004.04.001. [DOI] [PubMed] [Google Scholar]
- Beattie MS, Harrington AW, Lee R, Kim JY, Boyce SL, Longo FM, Bresnahan JC, Hempstead BL, Yoon SO. ProNGF induces p75-mediated death of oligodendrocytes following spinal cord injury. Neuron. 2002;36:375–386. doi: 10.1016/s0896-6273(02)01005-x. [DOI] [PMC free article] [PubMed] [Google Scholar]
- Beckmann AM, Wilce PA. Egr transcription factors in the nervous system. Neurochemistry international. 1997;31:477–510. doi: 10.1016/s0197-0186(96)00136-2. discussion 517–476. [DOI] [PubMed] [Google Scholar]
- Benedetti M, Levi A, Chao MV. Differential expression of nerve growth factor receptors leads to altered binding affinity and neurotrophin responsiveness. Proc Natl Acad Sci U S A. 1993;90:7859–7863. doi: 10.1073/pnas.90.16.7859. [DOI] [PMC free article] [PubMed] [Google Scholar]
- Bolin LM, Iismaa TP, Shooter EM. Isolation of activated adult Schwann cells and a spontaneously immortal Schwann cell clone. J Neurosci Res. 1992;33:231–238. doi: 10.1002/jnr.490330206. [DOI] [PubMed] [Google Scholar]
- Chao MV. The p75 neurotrophin receptor. Journal of neurobiology. 1994;25:1373–1385. doi: 10.1002/neu.480251106. [DOI] [PubMed] [Google Scholar]
- Chao MV, Hempstead BL. p75 and Trk: a two-receptor system. Trends Neurosci. 1995;18:321–326. [PubMed] [Google Scholar]
- Cosgaya JM, Chan JR, Shooter EM. The neurotrophin receptor p75NTR as a positive modulator of myelination. Science. 2002;298:1245–1248. doi: 10.1126/science.1076595. [DOI] [PubMed] [Google Scholar]
- Darby IA. In situ hybridization protocols. 2. Humana Press; Totowa, N.J: 2000. [Google Scholar]
- Davies AM, Lee KF, Jaenisch R. p75-deficient trigeminal sensory neurons have an altered response to NGF but not to other neurotrophins. Neuron. 1993;11:565–574. doi: 10.1016/0896-6273(93)90069-4. [DOI] [PubMed] [Google Scholar]
- Eldredge L, Tourtellotte WG. The role of early growth response (Egr) transcriptional factors in sympathetic nervous system development. Soc Neurosci Abstr. 2004;158.151:F144. [Google Scholar]
- Fan G, Jaenisch R, Kucera J. A role for p75 receptor in neurotrophin-3 functioning during the development of limb proprioception. Neuroscience. 1999;90:259–268. doi: 10.1016/s0306-4522(98)00432-1. [DOI] [PubMed] [Google Scholar]
- Gillespie MJ, Stein RB. The relationship between axon diameter, myelin thickness and conduction velocity during atrophy of mammalian peripheral nerves. Brain research. 1983;259:41–56. doi: 10.1016/0006-8993(83)91065-x. [DOI] [PubMed] [Google Scholar]
- Grabe N. AliBaba2: context specific identification of transcription factor binding sites. In silico biology. 2002;2:S1–15. [PubMed] [Google Scholar]
- Harrington AW, Leiner B, Blechschmitt C, Arevalo JC, Lee R, Morl K, Meyer M, Hempstead BL, Yoon SO, Giehl KM. Secreted proNGF is a pathophysiological death-inducing ligand after adult CNS injury. Proc Natl Acad Sci U S A. 2004;101:6226–6230. doi: 10.1073/pnas.0305755101. [DOI] [PMC free article] [PubMed] [Google Scholar]
- Jones MW, Errington ML, French PJ, Fine A, Bliss TV, Garel S, Charnay P, Bozon B, Laroche S, Davis S. A requirement for the immediate early gene Zif268 in the expression of late LTP and long-term memories. Nat Neurosci. 2001;4:289–296. doi: 10.1038/85138. [DOI] [PubMed] [Google Scholar]
- Kokaia Z, Andsberg G, Martinez-Serrano A, Lindvall O. Focal cerebral ischemia in rats induces expression of P75 neurotrophin receptor in resistant striatal cholinergic neurons. Neuroscience. 1998;84:1113–1125. doi: 10.1016/s0306-4522(97)00579-4. [DOI] [PubMed] [Google Scholar]
- Kuruvilla R, Zweifel LS, Glebova NO, Lonze BE, Valdez G, Ye H, Ginty DD. A neurotrophin signaling cascade coordinates sympathetic neuron development through differential control of TrkA trafficking and retrograde signaling. Cell. 2004;118:243–255. doi: 10.1016/j.cell.2004.06.021. [DOI] [PubMed] [Google Scholar]
- Lee KF, Li E, Huber LJ, Landis SC, Sharpe AH, Chao MV, Jaenisch R. Targeted mutation of the gene encoding the low affinity NGF receptor p75 leads to deficits in the peripheral sensory nervous system. Cell. 1992;69:737–749. doi: 10.1016/0092-8674(92)90286-l. [DOI] [PubMed] [Google Scholar]
- Lee SL, Sadovsky Y, Swirnoff AH, Polish JA, Goda P, Gavrilina G, Milbrandt J. Luteinizing hormone deficiency and female infertility in mice lacking the transcription factor NGFI-A (Egr-1) Science. 1996;273:1219–1221. doi: 10.1126/science.273.5279.1219. [DOI] [PubMed] [Google Scholar]
- Li L, Carter J, Gao X, Whitehead J, Tourtellotte WG. The Neuroplasticity-Associated Arc Gene Is a Direct Transcriptional Target of Early Growth Response (Egr) Transcription Factors. Mol Cell Biol. 2005;25:10286–10300. doi: 10.1128/MCB.25.23.10286-10300.2005. [DOI] [PMC free article] [PubMed] [Google Scholar]
- Li L, Yun SH, Keblesh J, Trommer BL, Xiong H, Radulovic J, Tourtellotte WG. Egr3, a synaptic activity regulated transcription factor that is essential for learning and memory. Mol Cell Neurosci. 2007;35:76–88. doi: 10.1016/j.mcn.2007.02.004. [DOI] [PMC free article] [PubMed] [Google Scholar]
- Lowry KS, Murray SS, McLean CA, Talman P, Mathers S, Lopes EC, Cheema SS. A potential role for the p75 low-affinity neurotrophin receptor in spinal motor neuron degeneration in murine and human amyotrophic lateral sclerosis. Amyotroph Lateral Scler Other Motor Neuron Disord. 2001;2:127–134. doi: 10.1080/146608201753275463. [DOI] [PubMed] [Google Scholar]
- Ma Y, Campenot RB, Miller FD. Concentration-dependent regulation of neuronal gene expression by nerve growth factor. J Cell Biol. 1992;117:135–141. doi: 10.1083/jcb.117.1.135. [DOI] [PMC free article] [PubMed] [Google Scholar]
- Maier A. Development and regeneration of muscle spindles in mammals and birds. Int J Dev Biol. 1997;41:1–17. [PubMed] [Google Scholar]
- Mi S, Lee X, Shao Z, Thill G, Ji B, Relton J, Levesque M, Allaire N, Perrin S, Sands B, Crowell T, Cate RL, McCoy JM, Pepinsky RB. LINGO-1 is a component of the Nogo-66 receptor/p75 signaling complex. Nat Neurosci. 2004;7:221–228. doi: 10.1038/nn1188. [DOI] [PubMed] [Google Scholar]
- Mufson EJ, Kordower JH. Cortical neurons express nerve growth factor receptors in advanced age and Alzheimer disease. Proc Natl Acad Sci U S A. 1992;89:569–573. doi: 10.1073/pnas.89.2.569. [DOI] [PMC free article] [PubMed] [Google Scholar]
- Nikam SS, Tennekoon GI, Christy BA, Yoshino JE, Rutkowski JL. The Zinc Finger Transcription Factor Zif268/Egr-1 Is Essential for Schwann Cell Expression of the p75 NGF Receptor. Molecular and Cellular Neuroscience. 1995;6:337–348. doi: 10.1006/mcne.1995.1026. [DOI] [PubMed] [Google Scholar]
- Nykjaer A, Lee R, Teng KK, Jansen P, Madsen P, Nielsen MS, Jacobsen C, Kliemannel M, Schwarz E, Willnow TE, Hempstead BL, Petersen CM. Sortilin is essential for proNGF-induced neuronal cell death. Nature. 2004;427:843–848. doi: 10.1038/nature02319. [DOI] [PubMed] [Google Scholar]
- Nykjaer A, Willnow TE, Petersen CM. p75NTR--live or let die. Curr Opin Neurobiol. 2005;15:49–57. doi: 10.1016/j.conb.2005.01.004. [DOI] [PubMed] [Google Scholar]
- O’Donovan KJ, Tourtellotte WG, Millbrandt J, Baraban JM. The EGR family of transcription-regulatory factors: progress at the interface of molecular and systems neuroscience. Trends Neurosci. 1999;22:167–173. doi: 10.1016/s0166-2236(98)01343-5. [DOI] [PubMed] [Google Scholar]
- Philipsen S, Suske G. A tale of three fingers: the family of mammalian Sp/XKLF transcription factors. Nucleic acids research. 1999;27:2991–3000. doi: 10.1093/nar/27.15.2991. [DOI] [PMC free article] [PubMed] [Google Scholar]
- Poukka H, Kallio PJ, Janne OA, Palvimo JJ. Regulation of the rat p75 neurotrophin receptor promoter by GC element binding proteins. Biochem Biophys Res Commun. 1996;229:565–570. doi: 10.1006/bbrc.1996.1844. [DOI] [PubMed] [Google Scholar]
- Reichardt LF. Neurotrophin-regulated signalling pathways. Philosophical transactions of the Royal Society of London. 2006;361:1545–1564. doi: 10.1098/rstb.2006.1894. [DOI] [PMC free article] [PubMed] [Google Scholar]
- Rende M, Provenzano C, Tonali P. Modulation of low-affinity nerve growth factor receptor in injured adult rat spinal cord motoneurons. The Journal of comparative neurology. 1993;338:560–574. doi: 10.1002/cne.903380406. [DOI] [PubMed] [Google Scholar]
- Roux PP, Colicos MA, Barker PA, Kennedy TE. p75 neurotrophin receptor expression is induced in apoptotic neurons after seizure. J Neurosci. 1999;19:6887–6896. doi: 10.1523/JNEUROSCI.19-16-06887.1999. [DOI] [PMC free article] [PubMed] [Google Scholar]
- Schneider-Maunoury S, Topilko P, Seitandou T, Levi G, Cohen-Tannoudji M, Pournin S, Babinet C, Charnay P. Disruption of Krox-20 results in alteration of rhombomeres 3 and 5 in the developing hindbrain. Cell. 1993;75:1199–1214. doi: 10.1016/0092-8674(93)90329-o. [DOI] [PubMed] [Google Scholar]
- Song XY, Zhou FH, Zhong JH, Wu LL, Zhou XF. Knockout of p75(NTR) impairs re-myelination of injured sciatic nerve in mice. J Neurochem. 2006;96:833–842. doi: 10.1111/j.1471-4159.2005.03564.x. [DOI] [PubMed] [Google Scholar]
- Swiatek PJ, Gridley T. Perinatal lethality and defects in hindbrain development in mice homozygous for a targeted mutation of the zinc finger gene Krox20. Genes & development. 1993;7:2071–2084. doi: 10.1101/gad.7.11.2071. [DOI] [PubMed] [Google Scholar]
- Topilko P, Schneider-Maunoury S, Levi G, Baron-Van Evercooren A, Chennoufi AB, Seitanidou T, Babinet C, Charnay P. Krox-20 controls myelination in the peripheral nervous system. Nature. 1994;371:796–799. doi: 10.1038/371796a0. [DOI] [PubMed] [Google Scholar]
- Tourtellotte WG, Keller-Peck C, Milbrandt J, Kucera J. The transcription factor Egr3 modulates sensory axon-myotube interactions during muscle spindle morphogenesis. Dev Biol. 2001;232:388–399. doi: 10.1006/dbio.2001.0202. [DOI] [PubMed] [Google Scholar]
- Tourtellotte WG, Milbrandt J. Sensory ataxia and muscle spindle agenesis in mice lacking the transcription factor Egr3. Nat Genet. 1998;20:87–91. doi: 10.1038/1757. [DOI] [PubMed] [Google Scholar]
- Tourtellotte WG, Nagarajan R, Auyeung A, Mueller C, Milbrandt J. Infertility associated with incomplete spermatogenic arrest and oligozoospermia in Egr4-deficient mice. Development. 1999;126:5061–5071. doi: 10.1242/dev.126.22.5061. [DOI] [PubMed] [Google Scholar]
- Tourtellotte WG, Nagarajan R, Bartke A, Milbrandt J. Functional compensation by Egr4 in Egr1-dependent luteinizing hormone regulation and Leydig cell steroidogenesis. Mol Cell Biol. 2000;20:5261–5268. doi: 10.1128/mcb.20.14.5261-5268.2000. [DOI] [PMC free article] [PubMed] [Google Scholar]
- Wang KC, Kim JA, Sivasankaran R, Segal R, He Z. P75 interacts with the Nogo receptor as a co-receptor for Nogo, MAG and OMgp. Nature. 2002;420:74–78. doi: 10.1038/nature01176. [DOI] [PubMed] [Google Scholar]
- Wong ST, Henley JR, Kanning KC, Huang KH, Bothwell M, Poo MM. A p75(NTR) and Nogo receptor complex mediates repulsive signaling by myelin-associated glycoprotein. Nat Neurosci. 2002;5:1302–1308. doi: 10.1038/nn975. [DOI] [PubMed] [Google Scholar]
- Yamashita T, Tucker KL, Barde YA. Neurotrophin binding to the p75 receptor modulates Rho activity and axonal outgrowth. Neuron. 1999;24:585–593. doi: 10.1016/s0896-6273(00)81114-9. [DOI] [PubMed] [Google Scholar]