Abstract
Using the docking of p-nitrocatechol sulfate to Yersinia protein tyrosine phosphatase YopH as an example, we showed that an approach based on mining minima followed by cluster and similarity analysis could generate useful insights into docking pathways. Our simulation treated both the ligand and the protein as flexible molecules so that the coupling between their motion could be properly accounted for. Our simulation identified three docking poses; the one with the lowest energy agreed well with experimental structure. The model also predicted the side-chain conformations of the amino acids lying in the binding pocket correctly with the exception of three residues that appeared to be stabilized by two structural water molecules in the crystal structure. The implicit solvent model employed in the simulation could not capture such effects well. We also found four major pathways leading to these docking poses after the ligand entered the mouth of the binding pocket. In addition, the sulfate group of p-nitrocatechol sulfate was found to be important both in binding the ligand to the pocket and in guiding the ligand to dock into the pocket. The coupling of the motion between the protein and the ligand also played an important role in facilitating ligand loading and unloading.
INTRODUCTION
Molecular docking has become a popular research area partly because of its relevance to computer-aided drug design. Earlier methods focused on docking rigid ligands to rigid receptors. With the rapid advance of high-performance computing technology and the development of new docking algorithms, it has become increasingly feasible to treat both the ligands and their receptors as flexible molecules during docking. Although most methods still do not account for the coupling between ligand and receptor motion (e.g., docking ligands to an ensemble of structures that were generated in the absence of the ligand), there were exceptions. For example, Mangoni et al. (1) directly docked a flexible ligand to a flexible protein during a molecular dynamics (MD) simulation in which the translational motion of the center of mass of the ligand was assigned a high temperature. On the other hand, Nakajima et al. (2) employed the multicanonical MD simulation method to dock a flexible peptide into the SH3 domain of Abl tyrosine kinase. These simulations, however, are still very computationally expensive. If one also wants to gain insights into the docking pathways in addition to obtaining correct docking poses, the simulations can be even more costly.
There are methods that can facilitate the simulation of ligand loading into or unloading from a protein. For example, the steered (3) and biased (4) MD approaches apply biases to steer a ligand to enter or release from a protein. However, these simulations are still expensive to do if one wants to carry out many runs to identify representative pathways and to estimate activation barriers and to perform long runs to minimize the artificial effects of the applied biases. It is therefore useful to explore alternative methods that utilize different approximations.
In this work, we took advantage of the well-known complicated energy landscape of large protein-ligand systems (5). The energy landscape is not smooth but contains many local minima. If one can mine the global minimum along with many of these local minima and utilize a method to properly connect them to form pathways, useful insights into the molecular mechanisms of docking can be gained.
In this study, we used simulated annealing (6) as a tool to help mine energy minima. We achieved this by running many short simulated annealing cycles instead of running one or only a few slow simulated annealing simulations. Each cycle only lasted for 8 ps. The temperature was near 0 K at the end of each cycle so that the resulting structure was near a local or global energy minimum. Many cycles generated many local minima. We could then connect these minima by performing clustering and similarity analysis to form pathways.
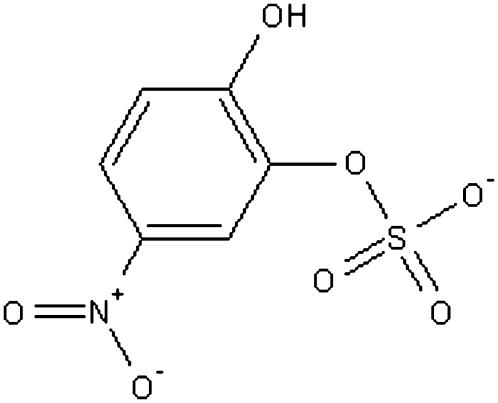
In this work, we tested this idea by applying it to study the docking of p-nitrocatechol sulfate (pNCS) to Yersinia protein tyrosine phosphatase YopH. This bacterial protein tyrosine phosphatase is responsible for causing human diseases ranging from gastrointestinal syndromes to bubonic plague (7–9). pNCS, whose structure is shown in Fig. 1, is a specific inhibitor of YopH and displays >10× selectivity toward YopH over a panel of mammalian protein tyrosine phosphatases (10). In addition to demonstrating that our method can identify the correct docking structure, we also show that it can generate useful insights into the docking pathways. Crude estimates of the activation barriers for ligand entry and release have also been estimated. In addition to elucidating the molecular mechanisms of docking, information gained from such a study might also be useful for drug design as it provides a semiquantitative means to compare the relative ease of different ligands to enter their target protein and the relative durations in which different drug candidates would stay in the binding pocket once they get there.
FIGURE 1.
Structure of pNCS.
METHODS
Mining minima by simulated annealing cycling
One way to mine many energy minima is to perform many short simulated annealing cycles in an MD simulation. We performed such a simulation as follows:
We assigned initial velocities at 500 K.
We allowed the system to evolve for 1 ps in the NVT ensemble. We used the Nosé-Hoover chain method (11) to maintain constant temperature.
At the end of each 1-ps simulation, we reduced the temperature by half.
When the temperature of the simulation was below 5 K, we looped back to step 1.
We continued the above loop until a prescribed simulation length was reached. Each short simulated annealing cycle covered the following temperatures: 500 K, 250 K, 125 K, 62.5 K, 31.2 K, 15.6 K, 7.8 K, and 3.9 K. The structure at the end of the 3.9 K run was near a local energy minimum. By performing many short simulated annealing cycles, one could identify many minima. The ones with the lowest energy corresponded to the correct docking pose, whereas the higher energy minima helped to construct approximate docking pathways.
We performed the simulated annealing cycling simulation by modifying the MMTSB toolkit (12) and by using the CHARMM package (13). Usually, each run contained four independent trajectories. We started these trajectories from the same structure and temperature but with different random number seed to initiate the atomic velocities. Different runs could also start from different initial structures.
System setup
We took the initial coordinates of YopH from the Protein Data Bank (PDB), PDB id 1PA9. This structure contained a bound pNCS ligand (10). We constructed the coordinates of four missing residues (Ser-389, Ala-390, Val-391, and Ala-392) by using their coordinates form another structure (PDB id 1YTW) (14) after superposing them by Visual Molecular Dynamics (15). The four hydrogens of the pNCS ligand were added by Open Babel (http://openbabel.sourceforge.net), and the partial charges of the ligand atoms were obtained by performing Hartree-Fock calculations using the 6-31G* basis set, the Gaussian03 package (16), and the Merz-Kollman scheme (17) for deriving atomic partial charges from electrostatic potential. We started the simulated annealing cycling simulations by putting the ligand pNCS at or near the surface of the protein. At each location, we used two ligand orientations that were flipped relative to each other. Thus, four different ligand structures were used to start the simulations.
Before each MD simulation, we performed 500 steps of steepest descent minimization of the pNCS-YopH complex to remove bad contacts. During the energy minimization, the α-carbons were held fixed. For each starting position and orientation of the ligand, we carried out five runs, each containing four simulated annealing cycling simulations. Therefore, we had 20 trajectories for each starting structure and 80 trajectories total for four different starting locations/orientations of the ligand. Each trajectory lasted 1 ns. Therefore, the aggregate simulation time was 80 ns for the whole set of ligand-docking simulations. We used a time step of 1 fs in these simulations, and we collected structures every 1 ps for analysis.
We conducted the MD simulations using the CHARMM param27 force field (18). In the docking simulations, we used a simple but inexpensive distance-dependent dielectric model with ɛ(r) = 4r where r is the distance between two atoms. However, we also rescored the docking poses by the more sophisticated implicit solvent generalized Born molecular volume (GBMV) model (19–21). During the simulations, we used a nonbonded cutoff distance of 14 Å, a switching function for the electrostatic interactions that began at 10 Å and ended at 12 Å, and a shifting function for the Lennard-Jones potential. In rescoring the docking pose with the GBMV model, we used the GBMV1 parameters of Chocholoušová and Feig (21). The corresponding cutoff distances were 12 Å, 8 Å, and 10 Å, respectively.
To examine whether the ligands were docked correctly, we used two measures. One was the distance (Rpath) between the center of the ligand pNCS and that of nine residues (Phe-229, Ile-232, Asp-356, Gln-357, Arg-404, Ala-405, Val-407, Arg-409, and Gln-446) around the binding pocket. For the four starting structures, this distance was 6.7 Å, 7.6 Å, 11.4 Å, or 12.5 Å. We also used the distance Rpath to monitor the docking of the ligand to the binding pocket of the protein and as one degree of freedom to define the reaction coordinate in the construction of docking pathways. The second measure was the root mean-square deviation (RMSD) between the docking structure and the crystal structure of the ligand, after superposition of the coordinates of the α-carbons of the protein.
We allowed the protein to move in the docking simulations but with an appropriate constraint to prevent the protein conformation from deviating too far away from the crystal structure. This was because we used a relatively simple distance-dependent dielectric model for the protein and current force field models are still approximate; we did not want to generate conformations that were too far away from reality. We achieved this by applying the restraint  where D was the RMSD of a dynamics snapshot from the crystal structure (an option in CHARMM). Only the α-carbons were used in calculating the RMSD so that the side chains and other backbone atoms were completely free to move. With this constraint, individual residues could still experience large structural variations, as much as ∼7 Å from the crystal structure, during the docking simulations.
On a dual core dual processor cluster node with 2.8 GHz Intel Xeon EM64T processors, it took ∼104 h for each simulated annealing cycling run containing four trajectories.
Constructing docking pathways by cluster analysis
We constructed docking pathways by clustering similar structures and connecting representative structures between clusters. First we classified the structures near local minima (structures below 10 K) according to Rpath, using a bin size of 0.2 Å. Structures within each bin were then clustered using a self-organizing neural net approach (12,22–24) that has been incorporated into CHARMM and accessible from the MMTSB toolkit. This algorithm optimizes cluster assignment by minimizing the distance between members and their centroid structure within each cluster and by requiring this distance to be within a user-predefined cluster radius. One does not need to specify the number of clusters, as the algorithm determines the optimal number that satisfies the above criteria. In this work, the distance between two ligand structures was measured by the RMSD between their Cartesian coordinates after their protein structures were superimposed with the crystal structure. We set the cluster radius to be 3 Å.
After clustering, we extracted the centroid structures from each bin. We then connected centroid structures between bins as described below in the section Ligand-docking pathways to deduce docking pathways. The structures closest to their corresponding centroid structures were used to visualize the structural change along the docking pathways. We also constructed an energy profile along the reaction coordinate by using the averaged binding energy of all cluster members at a given value of the reaction coordinate.
RESULTS AND DISCUSSIONS
Can this model predict the correct docking pose?
All four sets of simulations (each containing five runs with four trajectories each) starting from one of the four initial ligand structures described above had some trajectories that identified the correct docking pose. The best docking structures for the simulations starting from four different initial structures had RMSDs of 0.19 Å, 0.75 Å, 0.24 Å, and 0.73 Å from the crystal structure. Table 1 shows the trajectories that reached the binding pocket. Here, we considered the ligand to be reaching the binding pocket if Rpath < 2 Å. If it docked correctly, it also satisfied the condition that RMSD < 2 Å. From the table, one can see that 20 out of 80 trajectories correctly located the experimental docking structure. Forty-seven trajectories reached the binding pocket. We further used these 47 trajectories to construct docking pathways as discussed in the section Ligand-docking pathways below.
TABLE 1.
Number of trajectories reaching the binding pocket
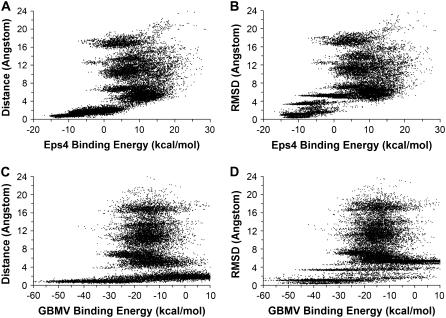
To examine whether one could pick out the correctly docked structure based on energy alone, we plotted thebinding energy versus Rpath or RMSD (Fig. 2). As previous work has shown, including the energy of the protein would introduce data that were too noisy for such an analysis (25). Therefore, we defined the binding energy as the total energy of the complex minus that of the isolated protein. This was done for both the ɛ(r) = 4r and the GBMV (21) models. In the figure, we only included data points for structures near local minima, i.e., structures obtained below 10 K. From the RMSD plots, one can clearly see that the structures having the lowest energies were correct docking structures for both energy models. The more sophisticated GBMV model gave somewhat better results. The lowest energy structure in the ɛ(r) = 4r model had an RMSD of 1.66 Å from the x-ray structure and the corresponding structure for the GBMV model had an RMSD of 1.34 Å. This gave us some confidence that the energy models used here were adequate to yield semiquantitative insights into protein-ligand docking for this system.
FIGURE 2.
Correlation plots between Rpath or RMSD and binding energy. (A) and (B) Distance-dependent dielectric model (ɛ(r) = 4r). (C) and (D) Rescored with GBMV model.
Ligand-docking pathways
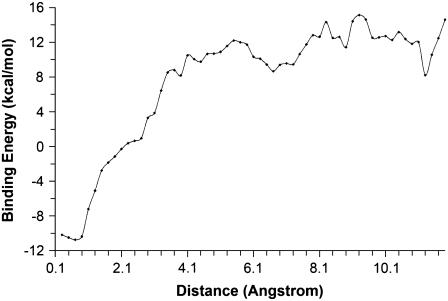
To construct the docking pathways, we first took 11,750 structures sampled below 10 K from the 47 trajectories mentioned before. These structures represented those near global or local energy minima. All the structures were superimposed with the x-ray structure using the α-carbons of the protein. We then calculated Rpath and grouped the structures into bins with a width of 0.2 Å. The averaged binding energy for structures within each bin was then calculated and plotted against Rpath (Fig. 3). This resembles a potential-of-mean-force calculation; it is much more approximate but significantly cheaper to obtain to give preliminary insights into the energy profile along the reaction coordinate defined by the single variable Rpath. From Fig. 3, one can see that the energy barrier for ligand entry was only ∼4 kcal/mol whereas the energy barrier for ligand release was significantly larger at ∼23 kcal/mol.
FIGURE 3.
Energy profile along Rpath.
Using only one variable, Rpath, to define the reaction coordinate does not yield much insight into the structural adjustment of the ligand that was required for successful docking. To gain further insight, we used all the degrees of freedom of the ligand as well. To obtain the reaction coordinate in terms of all these degrees of freedom, we performed cluster analysis on structures within bins and then connected representative structures (chosen to be the centroid structures) in each bin with its adjacent bins. In this analysis, we allowed for the possibility of multiple pathways. For example, if the structures in some of the bins were better grouped into several clusters rather than one, multiple pathways were feasible at these locations. To determine which centroid structure in one bin should be connected to which centroid structure in adjacent bins, we performed similarity analysis. The similarity measure was simply the RMSD between centroid structures in adjacent bins. Table 2 gives two examples of such an analysis. From the first example, one can see that clusters 1, 2, and 3 in the 1.1 Å bin were connected to clusters 1, 2, and 3 in the 1.3 Å bin, respectively. In the second example, cluster 1 in the 9.3 Å bin was connected to cluster 5 in the 9.5 Å bin. On the other hand, it was sometimes difficult to make connections only between adjacent groups. In such cases, we also considered connections with next-next and next-next-next-nearest neighbors.
TABLE 2.
Examples of connecting clusters to form pathways
| First example (full data) | Second example (partial data) | ||
|---|---|---|---|
| 1.1 Å bin | 1.3 Å bin | 9.3 Å bin | 9.5 Å bin |
| Cluster 1 | 1*: 0.31† | Cluster 1 | 1: 14.71 |
| 2: 5.03 | 2: 4.08 | ||
| 3: 4.40 | 3: 11.07 | ||
| Cluster 2 | 1: 5.13 | 4: 7.03 | |
| 2: 0.47 | 5: 1.12 | ||
| 3: 2.90 | 6: 9.40 | ||
| Cluster 3 | 1: 4.40 | 7: 13.35 | |
| 2: 2.84 | 8: 8.86 | ||
| 3: 0.38 | 9: 14.47 | ||
Denotes cluster 1 in the 1.3 Å bin.
Indicates the RMSD between the centroid structure of cluster 1 in the 1.1 Å bin and that in the 1.3 Å bin was 0.31 Å.
Bold indicates that this cluster was connected to the cluster on its adjacent bin on the left to form a portion of a pathway.
The following summarize the criteria used to construct the entire connections:
Neighboring centroid structures were connected when their RMSD was <2.0 Å.
If neighboring centroid structures could not be connected, next-next neighbors were considered. They were connected if their RMSD was <2.5 Å.
If connections could not be made with criteria 1 and 2, next-next-next neighbors were considered. Two centroid structures were connected if their RMSD was <3.0 Å.
If two next-nearest-neighbor centroid structures had a smaller RMSD than two nearest-neighbor centroid structures, the next-nearest-neighbor structures were connected.
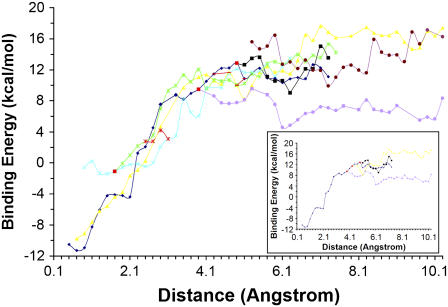
Fig. 4 shows several major pathways derived from this analysis. The small Rpath regions demonstrated that there were three pathways leading to the binding pocket. One pathway resulted from the merging of two pathways at large values of Rpath. However, only the pathway colored blue led to the correct docking pose. The cluster containing this structure in the 0.7 Å bin had its centroid structure only 0.67 Å away from the crystal structure. The other two pathways yielded two incorrect docking structures. Note that the pathways could not cross each other except at the point colored red or between points connected by red lines. Thus, for the incorrectly docked structures to reach the correctly docked structures, they needed to move out to a larger value of Rpath, at which it could switch to the pathway leading to the correct docking pose. For example, the incorrect docking pose in the 0.7 Å bin for the pathway colored yellow could move out to 4.7 Å, followed the red line to cross to the pathway labeled blue so that it could travel to the correct docking structure. From Fig. 4, one can also see that the pathways labeled green and cyan led to the same incorrectly docked structure because they converged into one pathway when Rpath was below ∼1.7 Å. This incorrect docking structure had a much more unfavorable binding energy (−0.59 kcal/mol) in comparison to the correct docking pose (−11.27 kcal/mol). The pathway labeled yellow led to another incorrectly docked structure. However, this structure had a much more favorable binding energy, only a little more unfavorable (−9.75 kcal/mol) than that of the correctly docked structure.
FIGURE 4.
Major docking pathways for the docking of pNCS to YopH. Each line (yellow, blue, cyan, green, brown, purple, and black) represents a docking pathway. Note that two pathways could not cross each other except at the point colored red or between points connected by red lines.
Beginning from the smallest value of Rpath, the correct docking pathway did not separate into branches until it reached 3.9 Å. The inset of the figure showed these branches more clearly after removing the other pathways from the figure. By following the structural change along these pathways, we knew that the branch line colored blue was associated with the ligand initially placed near the surface; the black line was analogous except with the ligand flipped. The yellow line was associated with the two structures of the ligand, flipped relative to each other, that were initially placed at the surface of the protein. The purple line was a pathway resulting from the failure of the ligand to enter the binding pocket and drifted away from the protein surface. From these pathways, one can see that there are multiple pathways leading from the surface of the protein to the entrance of the binding pocket. On the other hand, there was only one pathway that led to successful docking after the ligand entered the pocket.
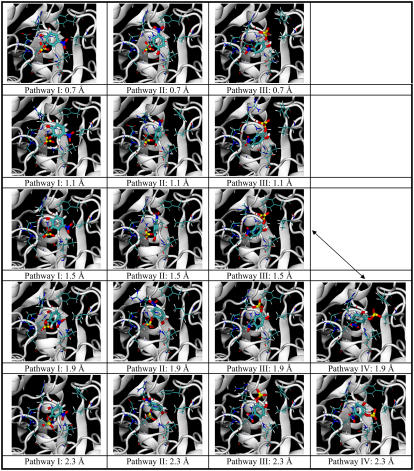
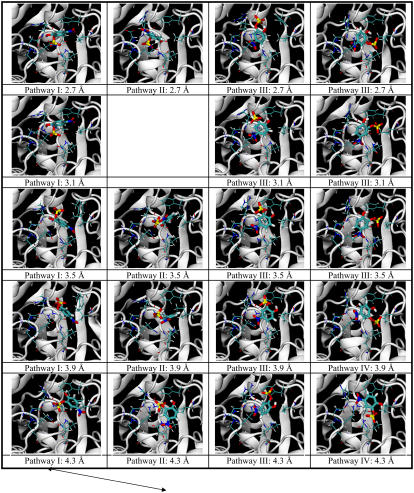
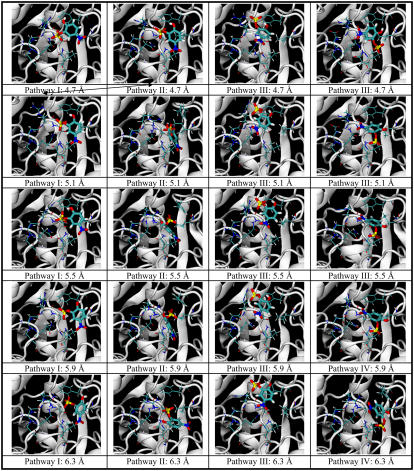
Fig. 5 demonstrates the structural change associated with the docking pathways. Each structure was a representative structure of a cluster that was closest to the centroid of the cluster. Four major pathways leading from the binding pocket to the surface of the protein are shown (Rpath from 0.7 Å to 6.3 Å). Each pathway is shown as a column in the figure. The structures at the smallest values of Rpath illustrate the correct docking pose and the two incorrect ones described above. Pathway I (column 1) led to the correct docking pose, and the energy profile was shown by the blue line in Fig. 3. Pathways II, III, and IV (columns 2, 3, and 4 in the figure) correspond to the yellow, cyan, and green lines in Fig. 4, respectively. The incorrectly docking structure in Pathway II was closer to the correct docking structure than that from Pathway III (and IV). Its aromatic ring and sulfate group were located almost the same way as the correct docking structure, except that the ring was flipped such that its nitro and hydroxyl substituents were in opposite sides of the ring in comparison to the correct docking structure. As shown in the energy plot in Fig. 4, these two docking poses had very similar energy, probably because the sulfate group provided the dominant contributions to binding with relatively minor assistance from the nitro and hydroxyl groups. On the other hand, the incorrectly docked structure from Pathway III was very different from those of Pathways I and II. The nitro group now occupied the same location as the sulfate group adopted by the above two structures. From the energy plot of Fig. 4, this structure bound much less favorably to the protein than the other two structures. This is probably because the nitro group did not interact as favorably as the sulfate group with this portion of the protein.
FIGURE 5.
Structural change along four major docking pathways to three different docking poses for 0.7 Å ≤ Rpath ≤ 6.3 Å. pNCS and nine residues (Phe-229, Ile-232, Asp-356, Gln-357, Arg-404, Ala-405, Val-407, Arg-409, and Gln-446) in or near the binding pocket are shown. Pathway I (column 1) leads to the correct docking pose (corresponding to the blue line in Fig. 4). Pathways II, III, and IV (columns 2, 3, and 4) correspond to the yellow, cyan, and green lines in Fig. 3, respectively. The arrows indicate crossing between pathways.
The strong interactions between the sulfate group and the protein also appeared to play an important role in determining how the ligand enters or leaves the binding pocket. By analyzing these pathways, the sulfate group was always the last part of pNCS to leave the pocket during unbinding. On the other hand, the sulfate group always entered the binding pocket first during binding. Two of our starting ligand structures at or near the protein surface were intentionally flipped such that the sulfate group pointed away from the binding pocket. But our simulation showed that the ligand had to flip around first before it could enter the binding pocket with the sulfate group heading the way.
Fig. 5 also shows the side-chain movement of nine residues (Phe-229, Ile-232, Asp-356, Gln-357, Arg-404, Ala-405, Val-407, Arg-409, and Gln-446) lying in or near the binding pocket. These residues were all involved in interacting with the ligand at one point or another. Table 3 shows the short-ranged interactions between the ligand and the protein along the correct docking pathways (from yellow to blue in the inset of Fig. 4). One can see that the sulfate group was interacting with the protein all the way from the surface of the protein to the binding pocket. This is consistent with our earlier discussions that the sulfate group led the ligand in docking into the protein. However, the residues that it interacted with changed as it moved into the binding pocket. At 6.7 Å, it interacted with Arg-230 and Gln-446. At 5.5 Å, Arg-404 took the place of Arg-230 although Gln-446 was still involved. At 4.3 Å, Gln-357 also entered the picture. However, at 3.5 Å, only Arg-404 maintained contact with the sulfate. At 2.7 Å, Gln-446 and Gln-357 regained their interactions and Cys-403 and Ala-405 also became involved. The ligand had the largest number of short-ranged interactions at 0.7 Å, where the ligand reached the binding pocket. Arg-409, in particular, formed many interactions with the sulfate group. The backbone of Gly-406, Val-407, and Gly-408 also participated in binding the ligand. The fact that the ligand formed many more interactions when it was at the binding pocket (Rpath = 0.7 Å) than when it was along the docking pathway and that most of the interactions were formed with the sulfate group again reinforces the notion that the sulfate group provided the dominant binding and steering force. The only interaction that did not involve the sulfate group was the one between the Arg-404 side chain and the hydroxyl group of pNCS. The hydroxyl group might also play a minor role in leading the ligand to the docking site. Table 3 shows that it interacted with Asp-356 and Arg-404 at 2.7 Å, also with Gln-357 at 3.5 Å, and with Gln-357 and Gln-446 only at 5.5 Å and 6.7 Å. On the other hand, the nitro group only participated when Rpath = 4.3 Å and did not have any short-range contact with the protein at shorter distances. Although Arg-409 formed tight interactions with pNCS in the binding pocket, it was not involved in the ligand-docking pathway. Arg-404, on the other hand, started interacting with the ligand at the surface and led it all the way to the binding pocket. The large movement of some residues observed during docking suggested that protein flexibility played an important role in facilitating docking. The flexibility of Ile-223 might also aid binding by moving away from the binding pocket to open up space for the ligand.
TABLE 3.
Interactions between pNCS and YopH along correct docking pathways (blue line or Pathway I and yellow line or Pathway II in the inset of Fig. 4)
| 0.7 Å (I) | 2.7 Å (I) | 3.5 Å (I) | 4.3 Å (I) | 5.5 Å (II) | 6.7 Å (II) |
|---|---|---|---|---|---|
| C403-SG:OS2;3.51* | C403-SG:OS4;3.44 | R404-NH2:OS1;3.87 | R404-NH2:OS3;3.47 | R404-NH1:OS2;2.87 | R230-NH2:OS2;3.38 |
| C403-SG∷OS3;3.62 | Q446-NE2:OS2;2.93 | R404-NH2:OS3;2.97 | R404-NE:OS3;2.86 | R404-NH2:OS2;3.39 | R230-NH2:OS3;3.20 |
| C403-SG:OS4;3.32 | Q446-OE1:OS2:3.78 | R404-NE:OS4;2.82 | R404-NH2:OS2;2.91 | Q446-NE2:OS1;3.15 | Q446-NE2:OS1;3.62 |
| R409-NH2:OS2;2.98 | D356-OD2:OS4:3.53 | R404-NH2:OS4;3.82 | Q357-NE2:OS2;3.70 | Q446-OE1:OS1;3.97 | Q446-NE2:OH;3.85 |
| R409-NE:OS2;3.82 | D356-OD1:OS4;3.61 | R404-NH2:OH;3.31 | Q357-NE2:OS4;3.12 | Q357-OE1:OH;3.97 | Q357-OE1:OH;3.8 |
| R409-NE:OS4;3.05 | D356-OD2:OS1;3.25 | D356-OD1:OH;3.01 | Q446-NE2:OS4;2.87 | Q357-NE2:OH;3.40 | R205-NH1:ON2;3.37 |
| R409-NH2:OS4;3.84 | D356-OD1:OS3;2.95 | Q357-NE2:OH;3.81 | Q446-OE1:OS4;3.36 | R205-NH2:ON2;2.98 | R205-NH1:ON1;3.50 |
| R409-NH:OS4;3.16 | D356-OD2:OS3;3.26 | D356-OD1:OS2;3.46 | R205-NH2:ON1;3.46 | ||
| R404-NH1:OH;3.33 | D356-OD1:OH;3.92 | D356-OD1:OS3;3.29 | |||
| R404-NH:OS2;3.40 | D356-OD2:OH;2.71 | Q446-NE2:ON2;3.41 | |||
| A405-NH:OS2;3.06 | R404-NH1:OH;3.14 | A405-NH:OS3;3.95 | |||
| V407-NH:OS3;3.34 | A405-NH:OS1;3.84 | ||||
| G406-NH:OS3;3.51 | |||||
| G408-NH:OS3;3.03 | |||||
| G408-NH:OS4;3.69 |
Interactions between two groups within 4.0 Å are shown. OS2, OS3, and OS4 are the nonbridging oxygens of the sulphate group of pNCS. OS1 is the bridging oxygen. OH is the hydroxyl group of pNCS. ON1 and ON2 are the oxygens of the nitro group of pNCS. Residue and atom names are those used in CHARMM.
Distances are in Å.
The amino acids that interacted with the sulfate and the nitro group in the correct and incorrect docking structures adopted a similar conformation in the binding pocket. On the other hand, the residues that interacted with the other side of the ligand had a somewhat different conformation for the three different docking poses, consistent with the proposition that this part of the protein did not contribute as much to binding the ligand. Therefore, this portion of the protein might react passively according to whichever portions of the ligand were presented to them after the major interactions on the other side of the ligand were established.
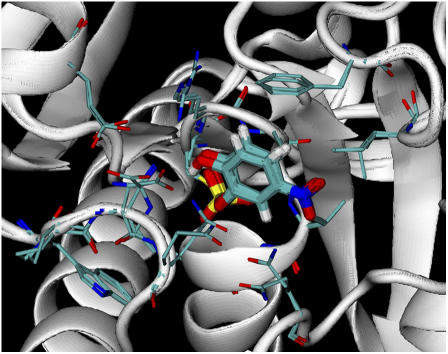
Fig. 6 shows that the structure of the protein surrounding the predicted docking pose agreed well with the crystal structure. The side chains of 15 residues (Phe-229, Ile-232, Gln-290, Trp-354, Pro-355, Asp-356, Gln-357, Cys-403, Arg-404, Ala-405, Gly-406, Val-407, Gly-408, Arg-409, and Gln-446) are shown. They all agreed well with the crystal structure with the exception of three residues: Arg-404, Asp-356, and Gln-446. One reason that our model did not predict the structure of these three residues as well might be the involvement of water molecules in mediating the interactions between the ligand and the protein, as observed in the crystal structure (10). Because we used an implicit solvent model, such effects could not be accounted for.
FIGURE 6.
Overlay of the predicted docking structure and the crystal structure. pNCS and the side chains of 15 residues (Phe-229, Ile-232, Gln-290, Trp-354, Pro-355, Asp-356, Gln-357, Cys-403, Arg-404, Ala-405, Gly-406, Val-407, Gly-408, Arg-409, and Gln-446) are shown.
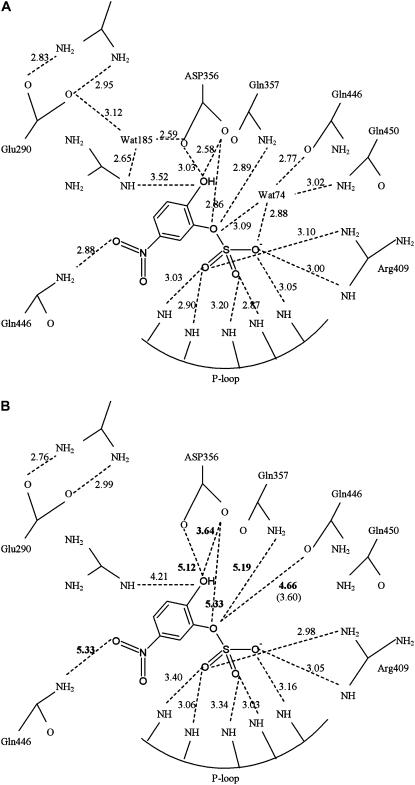
The hydrogen bonding and polar interactions between the ligand and the protein for the crystal and predicted docking structure are shown in Fig. 7, A and B, respectively, for comparison. It is evident that most of the interactions appearing in the crystal structure were also present in the docking structure. The strongest interactions presented by the sulfate group with the P-loop and Arg-409 of the protein were well described by the predicted docking structure. The bidentate hydrogen bonds between Arg-409 and Glu-290 were also tightly formed in the docking structure as in the crystal structure. On the other hand, the tight interactions between Arg-404, Asp-356, or Gln-446 with the ligand were lost in the predicted structure, as indicated by the increased distances. These interactions included the hydrogen bonds between Nɛ of Gln-446 and the nitro oxygen of pNCS, between Nɛ of Gln-357 and the phenolic oxygen of pNCS, and the polar interactions between the carboxyl oxygen of Asp-356 and the hydroxyl oxygen of pNCS. These distances increased by at least 1 Å from the corresponding distances in the crystal structure. The tighter interactions in the crystal structure were maintained by two bound water molecules—Wat74 and Wat185—through water-mediated hydrogen bonds (Fig. 7 A). These water-mediated interactions could not be described by the implicit solvent model used in our docking simulation (Fig. 7 B). Because Asp-356 serves as a general acid in protein tyrosene phosphatase catalysis (26), these bound water molecules might also play critical roles in phosphotyrosine hydrolysis (27).
FIGURE 7.
Interactions between pNCS and YopH. Hydrogen bonds (with a cutoff distance of 3.2 Å) and polar interactions (with a cutoff distance of 4.0 Å) are shown. (A) X-ray structure. (B) Predicted docking structure (3.60 within parenthesis is the distance obtained from the crystal structure).
CONCLUSION
A mining minima approach utilizing simulated annealing cycling to explore ligand-docking pathways was tested in the docking of pNCS to the Yersinia protein tyrosine phosphatase YopH. To reduce computational costs, we found that a simple distance-dependent dielectric (ɛ(r) = 4r) model was sufficiently reliable to identify the correct docking pose, as long as we applied weak RMSD constraints to the α-carbons of the protein. The structure of the protein in the binding pocket was also mostly recovered by our docking study. However, three residues in the binding pocket were not described as well by our model. This was because of the lack of explicit water molecules that could form water-mediated interactions as those observed in the crystal structure.
Clustering the structures near the energy minima and examining how they might be connected has yielded useful insights into the docking pathways. Our analysis demonstrated three different docking poses in the binding pocket; one of them was the correct docking structure and the other two were incorrect docking structures. We also observed four docking pathways leading from the surface of the protein to the correct docking pathway. The centroid structure from the cluster containing the lowest energy structure had an RMSD of only 0.67 Å from the crystal structure. This structure was much better than that (1.66 Å) determined by binding energy alone. Thus, using both binding energy and clustering could better identify the correct docking pose in docking simulations.
The sulfate group of pNCS appeared to play the most important role in contributing to binding and in directing the ligand toward the binding site during docking. The flexibility of the protein was also found to play an important role in facilitating ligand entry into or exit from the binding pocket.
Acknowledgments
We thank the University of Missouri Bioinformatics Consortium and the University of Missouri-St. Louis Information Technology Services for providing computational resources.
This research was supported by a research award from the University of Missouri-St. Louis, by a research board award from the University of Missouri System, and by the National Institutes of Health.
Editor: Ivet Bahar.
References
- 1.Mangoni, M., D. Roccatano, and A. Di Nola. 1999. Docking of flexible ligands to flexible receptors in solution by molecular dynamics simulation. Proteins. 35:153–162. [DOI] [PubMed] [Google Scholar]
- 2.Nakajima, N., J. Higo, A. Kidera, and H. Nakamura. 1997. Flexible docking of a ligand peptide to a receptor protein by multicanonical molecular dynamics simulation. Chem. Phys. Lett. 278:297–301. [Google Scholar]
- 3.Isralewitz, B., S. Izrailev, and K. Schulten. 1997. Binding pathway of retinal to bacterio-opsin: a prediction by molecular dynamics simulations. Biophys. J. 73:2972–2979. [DOI] [PMC free article] [PubMed] [Google Scholar]
- 4.Paci, E., and M. Karplus. 1999. Forced unfolding of fibronectin type 3 modules: an analysis by biased molecular dynamics simulations. J. Mol. Biol. 288:441–459. [DOI] [PubMed] [Google Scholar]
- 5.Frauenfelder, H., S. G. Sligar, and P. G. Wolynes. 1991. The energy landscapes and motions of proteins. Science. 254:1598–1603. [DOI] [PubMed] [Google Scholar]
- 6.Kirkpatrick, S., C. D. Gelatt Jr., and M. P. Vecchi. 1983. Optimization by simulated annealing. Science. 220:671–680. [DOI] [PubMed] [Google Scholar]
- 7.Guan, K. L., and J. E. Dixon. 1990. Protein tyrosine phosphatase activity of an essential virulence determinant in Yersinia. Science. 249:553–556. [DOI] [PubMed] [Google Scholar]
- 8.Bulter, T. 1985. Textbook of Medicine. W. B. Saunders, Philadelphia, PA.
- 9.Stuckey, J. A., H. L. Schubert, E. B. Fauman, Z.-Y. Zhang, J. E. Dixon, and M. A. Saper. 1994. Crystal structure of Yersinia protein tyrosine phosphatase at 2.5 Å and the complex with tungstate. Nature. 370:571–575. [DOI] [PubMed] [Google Scholar]
- 10.Sun, J.-P., L. Wu, A. A. Fedorov, S. C. Almo, and Z.-Y. Zhang. 2003. Crystal structure of the Yersinia protein-tyrosine phosphatase YopH complexed with a specific small molecule inhibitor. J. Biol. Chem. 278:33392–33399. [DOI] [PubMed] [Google Scholar]
- 11.Martyna, G. J., M. L. Klein, and M. E. Tuckerman. 1992. Nosé-Hoover chains—the canonical ensemble via continuous dynamics. J. Chem. Phys. 97:2635–2643. [Google Scholar]
- 12.Feig, M., J. Karanicolas, and C. L. Brooks III. 2004. MMTSB tool set: enhanced sampling and multiscale modeling methods for applications in structural biology. J. Mol. Graph. Model. 22:377–395. [DOI] [PubMed] [Google Scholar]
- 13.Brooks, B. R., R. E. Bruccoleri, B. D. Olafson, D. J. States, S. Swaminathan, and M. Karplus. 1983. CHARMM: a program for macromolecular energy, minimization, and dynamics calculations. J. Comput. Chem. 4:187–217. [Google Scholar]
- 14.Fauman, E. B., C. Yuvaniyama, H. L. Schubert, J. A. Stuckey, and M. A. Saper. 1996. The x-ray crystal structures of Yersinia tyrosine phosphatase with bound tungstate and nitrate. J. Biol. Chem. 271:18780–18788. [DOI] [PubMed] [Google Scholar]
- 15.Humphrey, W., A. Dalke, and K. Schulten. 1996. VMD: visual molecular dynamics. J. Mol. Graph. 14:33–38. [DOI] [PubMed] [Google Scholar]
- 16.Frisch, M. J., G. W. Trucks, H. B. Schlegel, G. E. Scuseria, M. A. Robb, J. R. Cheeseman, J. A. Montgomery Jr., T. Vreven, K. N. Kudin, J. C. Burant, J. M. Millam, S. S. Iyengar, J. Tomasi, V. Barone, B. Mennucci, M. Cossi, G. Scalmani, N. Rega, G. A. Petersson, H. Nakatsuji, M. Hada, M. Ehara, K. Toyota, R. Fukuda, J. Hasegawa, M. Ishida, T. Nakajima, Y. Honda, O. Kitao, H. Nakai, M. Klene, X. Li, J. E. Knox, H. P. Hratchian, J. B. Cross, V. Bakken, C. Adamo, J. Jaramillo, R. Gomperts, R. E. Stratmann, O. Yazyev, A. J. Austin, R. Cammi, C. Pomelli, J. W. Ochterski, P. Y. Ayala, K. Morokuma, G. A. Voth, P. Salvador, J. J. Dannenberg, V. G. Zakrzewski, S. Dapprich, A. D. Daniels, M. C. Strain, O. Farkas, D. K. Malick, A. D. Rabuck, K. Raghavachari, J. B. Foresman, J. V. Ortiz, Q. Cui, A. G. Baboul, S. Clifford, J. Cioslowski, B. B. Stefanov, G. Liu, A. Liashenko, P. Piskorz, I. Komaromi, R. L. Martin, D. J. Fox, T. Keith, M. A. Al-Laham, C. Y. Peng, A. Nanayakkara, M. Challacombe, P. M. W. Gill, B. Johnson, W. Chen, M. W. Wong, C. Gonzalez, and J. A. Pople. 2004. Gaussian 03 Revision C.02. Gaussian Inc., Wallingford, CT.
- 17.Besler, B. H., K. M. Merz, and P. A. Kollman. 1990. Atomic charges derived from semiempirical methods. J. Comput. Chem. 11:431–439. [Google Scholar]
- 18.MacKerell, A. D. Jr., M. Feig, and C. L. Brooks III. 2004. Extending the treatment of backbone energetics in protein force fields: limitations of gas-phase quantum mechanics in reproducing protein conformational distributions in molecular dynamics simulations. J. Comput. Chem. 25:1400–1415. [DOI] [PubMed] [Google Scholar]
- 19.Lee, M. S., F. R. Salsbury Jr., and C. L. Brooks III. 2002. Novel generalized Born methods. J. Chem. Phys. 116:10606–10614. [Google Scholar]
- 20.Lee, M. S., M. Feig, F. R. Salsbury Jr., and C. L. Brooks III. 2003. New analytic approximation to the standard molecular volume definition and its application to generalized Born calculations. J. Comput. Chem. 24:1348–1356. [DOI] [PubMed] [Google Scholar]
- 21.Chocholoušová, J., and M. Feig. 2006. Balancing an accurate representation of the molecular surface in generalized Born formalisms with integrator stability in molecular dynamics simulations. J. Comput. Chem. 27:719–729. [DOI] [PubMed] [Google Scholar]
- 22.Carpenter, G. A., and S. Grossberg. 1987. ART 2: self-organization of stable category recognition codes for analog input patterns. Appl. Opt. 26:4919–4930. [DOI] [PubMed] [Google Scholar]
- 23.Karpen, M. E., D. J. Tobias, and C. L. Brooks III. 1993. Statistical clustering techniques for the analysis of long molecular dynamics trajectories: analysis of 2.2-ns trajectories of YPGDV. Biochemistry. 32:412–420. [DOI] [PubMed] [Google Scholar]
- 24.Pao, Y. H. 1989. Adaptive Pattern Recognition and Neural Networks. Addison Wesley, New York.
- 25.Cavasotto, C. N., J. A. Kovacs, and R. A. Abagyan. 2005. Representing receptor flexibility in ligand docking through relevant normal modes. J. Am. Chem. Soc. 127:9632–9640. [DOI] [PubMed] [Google Scholar]
- 26.Zhang, Z.-Y., Y. Wang, and J. E. Dixon. 1994. Dissecting the catalytic mechanism of protein-tyrosin phosphatases. Proc. Natl. Acad. Sci. USA. 91:1624–1627. [DOI] [PMC free article] [PubMed] [Google Scholar]
- 27.Schubert, H. L., E. B. Fauman, J. A. Stuckey, J. E. Dixon, and M. A. Saper. 1995. A ligand-induced conformational change in the Yersinia protein tyrosine phosphatase. Protein Sci. 4:1904–1913. [DOI] [PMC free article] [PubMed] [Google Scholar]


