

Abstract
Protein self-assembly is critical for numerous biological processes. Yet, assembly is rarely targeted by therapeutic agents, in part because it is hard to identify molecules that interfere with protein-protein interactions. Here we describe a simple fluorescence-based screen for self-association and its application to the assembly of hepatitis B virus capsids. These data are analyzed to identify kinetic and thermodynamic effects — both of which are critical for the viral lifecycle and for understanding the mechanism of assembly effectors. Suggestions are made for modification of this protocol so that it can be applied to other self-assembling systems. With manual pipetting, setting up a plate takes about two hours, the initial reading takes one hour, and the endpoint reading the following day takes about 5 minutes.
INTRODUCTION
One can still hear the opinion that protein-protein interactions are not viable targets for small molecules. Yet, effectors of cytoskeleton self-assembly are commonly discussed in cell biology text books1: microtubules are stabilized by paclitaxel and destabilized by colchicine; actin filaments are stabilized by phalloidin and destabilized by cytochalasin B. These small molecule effectors are tight binding and specific. They are powerful tools for “chemical genetics” where the lesions they induce give new insights into cell biology2. Though there are therapeutic uses for most of the molecules mentioned, they are extremely toxic because they target cytoskeletal proteins common to every cell. Viruses are an example of biological self-assembly where the reaction is distinct from any process in a healthy host cell. For spherical viruses, there is a protein shell, or capsid, constructed from hundreds of copies of the capsid protein(s). In this way, viruses use a minimal amount of their genome to envelope the maximum volume by prodigal use of their host's resources. Generally, capsid proteins are not homologous to any known host proteins. Most antiviral therapeutics target viral enzymes such as proteases or polymerases. We suggest that virus self-assembly should be an ideal target for a new generation of antivirals3-5; though not commercialized, virus stabilizing molecules have already been tested as potential antiviral agents6-8. Similarly, heteroaryldihydropyrimidines (HAPs) which attenuate hepatitis B virus (HBV) production in tissue culture9 work by affecting capsid assembly and structure10-14. However, these antivirals were not found by searching for assembly effectors.
This protocol describes an assay for identifying small molecules that directly affect capsid stability and assembly15. HBV is an ideal test bed for these studies because assembly is critical to the virus lifecycle and there is a reliable, well-characterized in vitro assembly system. HBV is a DNA virus with an RNA pre-genome that is reverse transcribed within newly assembled capsids 16. The capsid protein is a homodimer17 that spontaneously self-assembles into a mixture of 120-dimer (T=4) and 90-dimer (T=3) icosahedral particles when expressed in E. coli18. Both sizes are seen in vivo19, as well as in E. coli3, though the larger size predominates in both. Image reconstructions20 and X-ray structures13, 21 of expressed capsids are indistinguishable from the structure of the core in enveloped, infectious virions22. Purified E. coli expressed core protein dimers, lacking the RNA binding domain, spontaneously reassemble in vitro as a function of protein concentration, temperature, and ionic strength23, 24. To facilitate unique labeling at the C-terminus of the HBV capsid protein, we engineered a mutant capsid protein, C150, in which the native cysteines are mutated to alanine and a C-terminal cysteine was included. When that cysteine is modified with the fluorescent dye BoDIPY-FL, we refer to the construct as C150Bo. C-termini are at the extreme ends of free dimer. In capsids, the C-termini cluster together allowing the BoDIPY molecules to form a dimer that is essentially non-fluorescent (Figure 1)15. We have shown that changes in fluorescence correlate with HBV capsid protein assembly to yield either capsid or, when assembly is misdirected, large hexagonal complexes15.
Figure 1.
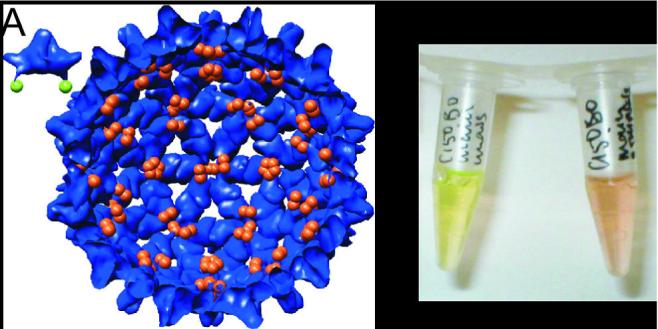
Assembly dramatically changes the fluorescence of C150Bo. (A) Structures13 for dimer and a capsid (interior view) are shown with the C-terminal residue highlighted. The coloring of the C-termini reflects quenching state. (B) Dimer (left) fluorescence is very bright; capsid (right) has a dull reddish color, because the fluorescence is quenched by the association of BoDIPY fluors15. Samples are both 3μM C150Bo in 50 mM HEPES pH 7.5, assembly was induced by 0.5 M NaCl.
The last piece of background information needed to interpret assembly data is an understanding of the current thinking on mechanisms of capsid assembly. Experimentally, below a threshold concentration capsids do not assemble; above the threshold concentration, assembly has sigmoidal kinetics, marked by the transient appearance of low concentrations of intermediates. The simplest case model of assembly describes the reaction as a cascade of fast, low order reactions that follow a rate-limiting nucleation step which can readily be written as a master equation (i.e. a balanced system of rate equations)3, 25. Such models give rise to sigmoidal kinetics because capsids cannot appear until a complete ladder of intermediates is sequentially synthesized23. At equilibrium, assembly of N protomers (the mono- or oligomeric fundamental unit of assembly) is expected to follow the law of mass action3: Kcapsid = [capsid]/[protomer]N. Because of the extreme power dependence, there is negligible assembly when the concentration of free protomer is low, while above a threshold, or pseudo-critical concentration, almost all the protein present in solution aggregates to form capsids. This behavior is observed for HBV24 and most viruses examined26-29. Other methods for analytically modeling assembly such as molecular dynamics30, 31 and discreet event simulators 32 recapitulate the behavior predicted from master equation approaches. Because the rate of assembly does not necessarily reflect the extent of assembly, both sorts of information are necessary for evaluating assembly and assembly effectors (Figure 3, 4).
Figure 3.
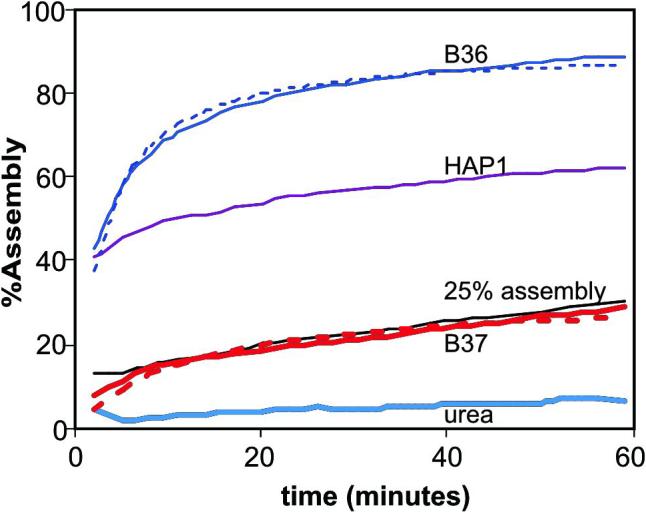
Representative assembly kinetics from a single experiment. All reactions have 0.15 M NaCl and should achieve 25% assembly in the absence of assembly effectors. Kinetic trajectories (solid lines) are shown for two experimental compounds (B-36 and B-37) alongside standards: HAP1, urea, and the control reaction. Curve fits are shown as dashed lines for B-36 and B-37. B-37 does not appear to affect assembly. B-36 is a stronger assembly enhancer than HAP1 but actually has slightly slower assembly kinetics.
Figure 4.

Assembly kinetics and extent of assembly for controls and selected experimental compounds. Shown are the %assembly and reciprocal time constant from a single representative experiment. Typical standard deviations are about 5 percentage points for %assembly, and 2 minutes for t1/2.
Expanding the protocol to other virus/protein systems
The present protocol was developed for a mutant HBV core protein in which the native cysteines were mutated to alanine and a C-terminal cysteine was appended. Because this assay is applicable to any virus, or protein, for which there is an in vitro assembly assay, it is useful to provide generalization for adapting it to other systems. For almost every virus, assembly juxtaposes the N- or C-termini of the capsid proteins (see the VIPER database for examples33), making these ends particularly suitable for labeling. It is not necessary to mutate native cysteines if they are not accessible to free dyes. Accessibility of native cysteines can be tested using Ellman's reagent34 (see Box 1 in Procedure). An N- or C-terminal cysteine can be incorporated using standard molecular biological techniques. As an alternative to cysteine, the N-terminal amine of a protein (if it is not modified) has a pK of about 7 and in some cases can be specifically labeled using succinimide chemistry.
In other systems it may be necessary to consider other fluorophores. BoDIPY-FL quenching is dominated by formation of a ground state dimer, therefore it is most useful when assembly places labels in contact with one another. Otherwise, BoDIPY-FL fluorescence is almost insensitive to environment35. At that point, it becomes necessary to consider alternative assays such as using BoDIPY-FL anisotropy or other dyes, labeling sites, and detection strategies. For example, the target protein can also be modified with FRET (fluorescence resonance energy transfer) pairs36, though the assay will be dependent on the juxtaposition of distinctly different dyes instead of a single dye. Common FRET pairs include fluorescein and rhodamine. Unlike the BoDIPY dyes, the absorbance and fluorescence of most fluorophores are exquisitely sensitive to environment, and this effect must be considered when observing FRET or anisotropy. If adapting this protocol to a different protein, it should be kept in mind that maleimides will react with nucleophilic (unprotonated) amines and will preferentially react with the unprotonated form of cysteine. Thus, when appending a fluorescent probe, it is best to maintain the pH of the protein solution between 6.5 and 7.5 using a buffer that does not contain primary amines.
Deciding on assembly thresholds and assay type
The goal of this screen is to examine the effect of small molecules on assembly. The basic strategy is to preincubate capsid protein with a small molecule and then induce assembly. In the case of HBV, assembly is induced by raising ionic strength. It is straightforward to determine the extent of assembly under a range of protein concentrations and ionic strengths. It is critical to decide how much assembly is needed to obtain interpretable results (see also the procedure herein). For assembly inhibitors, it is desirable to have ≥50% assembly. For assembly enhancers, we choose 25−30% assembly, based on a standard curve of fluorescence as a function of protein concentration (See step 8 of the procedure).
The simplest assay is an endpoint analysis, the extent of assembly after 24 hours. However, because in vivo assembly is sensitive to changes in kinetics and thermodynamics, there is a great deal of information to be obtained by observing the kinetics of assembly (Figure 3). Changing the rate of a reaction does not always affect the reaction extent, and vice versa (Figure 4). When there are 96 or more samples, it is impractical to induce one reaction at a time. In order to observe kinetics at coarsely sampled times points, conditions must be chosen so that the half time of assembly is later than the first time points, on the order of 10 minutes, which is conveniently consistent with 25−30% assembly.
Choice of kinetic model
No simple model adequately describes a reaction as complex as virus assembly. The reaction is nominally second order as subunits37 and small complexes of subunits32 add to a growing capsid. The result is that kinetics are nominally sigmoidal and slowly, asymptotically approach equilibrium25. For screening purposes, because we are more interested in developing indices of assembly, we propose a curve fit with an oversimplified model. We suggest a hyperbolic model as a first approximation (Figure 3). The hyperbolic curve we have chosen fits fluorescence over time and is expressed as follows:
where Finit is the initial fluorescence of unassembled protein, determined from the ‘no-assembly’ controls (see procedure). Ffinal is a fit parameter; a good starting estimate is the fluorescence at 24 hours (1440 minutes).
The reciprocal of the time constant, kt, is the time it takes the reaction to achieve 50% of its dynamic range. The exponential term, n, is optional. It can be included to accommodate the fact that assembly kinetics are not hyperbolic; an exponential term allows fitting to kinetics that are sigmoidal, and have either a very long lag phase or are fast and then level off. In some respects it is analogous to a Hill coefficient38 needed to fit a cooperative binding isotherm.
The same curve fit in terms of %assembly is:
Where %final is the maximum assembly, which like Ffinal is a fit parameter that should use assembly at 1440 minutes as a first estimate.
MATERIALS
Reagents
(unless otherwise stated, all chemicals are from Sigma-Aldrich, St. Louis, MO)
50mM HEPES (pH 7.5)
BODIPY® FL N-(2-aminoethyl)maleimide (Invitrogen B-10250)
DMSO
Carnation Non-fat dried milk (2% w/v in deionized water)
Sodium Chloride
Ellman's reagent (dithionitrobenzoic acid, DTNB)
Acetone
DTT (dithiothreitol)
Sodium borate (pH 8.5)
50mM TRIS base (pH 7.5)
Complete Tablets EDTA free (Roche 183−6170)
Dnase (Roche 104−132)
RNase A (Roche 109−142)
Ammonium Sulfate
50mM Sodium Bicarbonate (pH 9.6)
Urea
Sephadex G-25 (GE Biosciences)
Sepharose CL-4B (GE Biosciences)
Sephacryl S-300 (GE Biosciences)
Equipment
Spectrophotometer (Shimadzu UV-1601)
PD-10 column (GE Biosciences)
columns (C26/70 and XK50/60) (GE Biosciences)
Software for data analysis (EXCEL, Microsoft or Kaleidaraph, Synergy)
- 96-well plate
- CRITICAL! Black plates are used to diminish light scattering and to enhance signal. (Costar/Corning)
Polarion microplate reader (Tecan)
Microcuvette (Hellma)
Aluminum foil
2 inch wide packaging tape (Scotch, 3M)
Amber microcentrifuge tubes
Centrifuge
column chromatography system (e.g. peristaltic pump, detector, chart recorder, or AKTA FPLC, all chromatography equipment is GE Biosciences)
Amicon stirred cell concentrator (Millipore)
Regenerated cellulose membranes (YM 10 and YM 100) (Millipore)
Sonicator
Reagent Setup
“Drug” preparation (Timing: 30 min)
Resuspend “drugs” in DMSO at a concentration of 10−50 mM.
PAUSE POINT Aliquots of 100−200uLin 2 mL amber microcentrifuge tubes are stored at −80°C.
Equipment Setup
Polarion microplate reader — Mode: fluorescence; excitation: 485 nm; emission: 535 nm; gain: optimal. The above settings are equivalent to the fluorescein settings.
PROCEDURE
BOX 1: Test for free cysteines using Ellman's reagent
Start of Box 1
Make a 20 mM stock of Ellman's reagent (dithionitrobenzoic acid) by dissolving 12 mg in a minimum volume of acetone and then adding deionized water to a final volume of 1.5 mL.
- Transfer the protein to a slightly basic buffer, such as 50 mM sodium borate pH 8.5. To accomplish this buffer exchange, use a desalting column such as PD10 or equivalent Sephadex G25 column, and follow the directions in step 2 of the main Procedure.
- CRITICAL STEP For this assay, it is necessary to remove any reducing agent (i.e. DTT) from the protein solution.
Determine the protein stock concentration by absorbance. It is advisable to have at least 10 µM protein for this assay. Your protein's extinction coefficient at 280 nm can be estimated by scoring 5500 M−1 cm−1 for each tryptophan, 1500 M−1 cm−1 for each tyrosine, and 125 M−1 cm−1 for each disulfide39 (see also www.expasy.com). To minimize use of protein in this and the next step, use black masked 100 μL microcuvettes with a 1 cm optical path length.
- Mix100 μL of buffer (as a control) or protein solution with 20 μl of Ellman's reagent stock solution. After 20 minutes, read the absorbance at 412 nm. Ellman's reagent modifies free cysteine and releases one thionitrobenzoate, which has an extinction coefficient at 412 nm of 13,600 M−1 cm−1. Keeping in mind the 5/6 dilution (and assuming a 1 cm cuvette), the concentration of solvent-exposed thiol in the protein sample is:
This should be compared to the protein concentration to determine the number of solvent accessible cysteines per protein.
End of Box 1
BOX 2: Purification of hepatitis B virus core protein assembly domain (C150)
Start of Box 2
This box is primarily included for informational purposes. The protocol assumes you have frozen cell paste of an E. coli clone that over-expresses HBV capsid protein assembly domain. The purification protocol is based on published protocols.3, 40 We use BL21-DE3 carrying a pET11 plasmid with the assembly domain expression under control of a T7 promoter (the cells and plasmid are both from Novagen; the Cp149 insert is the generous gift of P. T. Wingfield). The Cp149 was mutated to C150 using a QuikChange Multi Site-Directed mutagenesis kit (Stratagene) to replace cysteines at positions 48, 61, and 107 with alanines and to add a C-terminal cysteine; details of the mutagenesis are described in Stray et al15.
Resuspend e.coli cell paste (1g paste/4mL buffer) with 50 mM TRIS pH 7.5, 5 mM DTT, 1 Protease inhibitor cocktail tablet per 10 mL (Roche), 0.01 mg/mL DNase, 0.1 mg/mL RNase A.
- Sonicate cells for 15 seconds then rest for 15 seconds for 1 minute; repeat 7−10 times while on ice.
- CRITICAL STEP: Make sure to keep cells cold. Use the pulse mode on the sonicator to avoid localized heating.
- Centrifuge at 27,000g for 30 min. at 4°C.
- CRITICAL STEP: At each step, test pellets and supernatants for HBV capsid protein by 16% SDS-PAGE.
Precipitate protein from the supernatant by slow addition of ammonium sulfate (AS) to 40% of saturation (Saturated AS is 76%, thus 40% of Saturated AS corresponds to a 30% concentration). Stir slowly in cold box for 1 hour. Centrifuge at 25,000g for 1 hour at 4 °C and decant supernatant.
Resuspend AS pellet in Buffer A (100 mM TRIS pH 7.5, 100 mM NaCl, 2 mM DTT) to an A280 of ∼6. Spin at 25,000g × 15min at 4 °C.
- Load the sample onto a Buffer A-equilibrated Sepharose CL-4B column (∼350mL bed volume in a 2.6 cm diameter column, maximum load volume is 5% of bed volume or 17mL) at 4°C. Run the column at a flow rate of 1 mL/min. Collect forty 7 mL fractions after having discarded the first 100 mL of flow-through.
- PAUSE POINT: Column can be run overnight.
- CRITICAL STEP: All columns should be stored and run at 4°C to preserve protein integrity.
Pool capsid fractions on the basis of the chromatographic profile, Abs280 and SDS-PAGE. Concentrate in an Amicon Stirred Cell concentrator using a YM100 (max psi is 10) to an A280 of 2 to 4.
- Dialyze sample into Buffer N (50mM Sodium Bicarbonate, pH 9.6, 2mM DTT) for a minimum of 2 hours at 4°C. Change buffer at 1 hour. Maximum duration is overnight.
- PAUSE POINT: Protein can be dialyzed overnight.
Add solid Urea to 3M (2.09g of urea/10 mL solution). Allow to incubate on ice for 1.5 hours. This dissociates capsids into capsid protein dimers.
- Load dimer sample on a Buffer N-equilibrated Sephacryl S-300 column (1 L bed volume, 5 cm diameter, max. load vol. 50mL) at 4°C. Elute at ∼4 mL/min. Collect seventy 16 mL fractions.
- PAUSE POINT: Column can be run overnight.
Pool dimer fractions on the basis of the chromatographic profile, Abs280 and SDS-PAGE.
Concentrate in an Amicon Stirred Cell using a YM10 membrane (max psi is 70) to 2.0 mg/mL.
- Dialyze protein into 50mM HEPES pH7.5, 2mM DTT for a minimum of 2 hours at 4°C. Change buffer at 1 hour.
- PAUSE POINT: Protein can be dialyzed overnight.
- Reassemble dimer by adding 5.0M NaCl to a final concentration of 0.5M NaCl. Incubate on ice for 2 hours.
- CRITICAL STEP: Protein is reassembled and re-dissociated to ensure protein activity. Dissociation and reassociation are demonstrated during purification.
- Purify reassembled capsid. Load capsid sample on a Buffer N-equilibrated 1L Sephacryl S-300 XK-50 (Max. load vol. 50mL) or 350mL S-300 column (Max. load vol. 17mL) at 4°C. Elute at ∼4 mL/min (1 L column) or ∼1 mL/min (350mL) collecting 16 or 7 mL fractions, respectively.
- PAUSE POINT: Column can be run overnight.
Redissociate and isolate pure, active dimer by repeating steps 7−11.
- Filter (0.2uM) and store aliquoted protein at −80°C.
- PAUSE POINT Protein solutions can be safely stored at −80°C for at least four months.
- CRITICAL STEP: Use plastic containers whenever possible.
Timing: 5 days
End of Box 2
Protein Labeling (Time: 2 days)
- Make a 50 mM stock of maleimidyl BoDIPY-FL dye by dissolving 5 mg of maleimidyl BoDIPY-FL in 241 μL of dry DMSO.
- PAUSE POINT Stocks may be stored at −80°C for at least 2 months.
- Remove DTT from the protein stock (typically 1.5 mg/mL, 45μM Cp149 in storage buffer, see Box 2) by desalting a 0.5 mL or 1mL aliquot on a PD10 or equivalent Sephadex G25 column equilibrated with ice-cold 50 mM HEPES pH 7.5. Collect 0.5 mL fractions and pool fractions (usually 2−3 fractions) based on absorbance at 280 nm. The protein is typically diluted by 1/3. Determine the protein concentration by absorbance at 280 nm (ε= 60,900 M−1 cm−1), a standard extinction coefficient for the HBV assembly domain41. We use a black masked 100 μL microcuvette with a 1 cm optical path length.
- CRITICAL STEP: All column chromatography should be performed at 4°C. We have found that room temperature chromatography of free HBV dimer can lead to a loss of assembly activity.
In a 1.5 mL microcentrifuge tube, mix 0.98 mL of protein with 20 μL of stock maleimidyl BoDIPY-FL so that there is at least a 20 fold molar excess of dye. Cover the tube with aluminum foil to protect it from light. PAUSE POINT Incubate the solution overnight at 4°C.
Remove DMSO and unreacted dye from the solution using a PD10 or equivalent column equilibrated with ice-cold 50 mM HEPES pH 7.5. Collect 0.5 mL fractions, pool fractions based on absorbance of the BoDIPY at 504 nm. Labeled protein will appear in the void volume of this mini-column and is obvious to the naked eye (Figure 1). Many dyes, including BoDIPY-FL, bind size exclusion gels presumably by hydrophobic interactions. As these dyes cannot be efficiently washed off the column, discard the packing (or the entire column) after each use. The modified protein is referred to as C150Bo.
- To quantify the efficiency of labeling, measure the absorbance at 280 and 504 nm, A280 and A504 (Figure 2). The extinction coefficient for BoDIPY-FL is 78,000 M−1 cm−1 at 504 nm and 1,300 M−1 cm−1 at 280 nm. Therefore, the concentration of bound dye in solution is:
The contribution of dye absorbance at 280 nm must be subtracted to determine the concentration of labeled protein:
The number of dyes per C150Bo dimer is [BoDIPY-FL] / [C150Bo]. The C150Bo sample should be visibly green (Fig 1B). Typical labeling is greater than 1.7 dyes/dimer.- PAUSE POINT This material is stored at 4°C for up to three weeks. Unlike the unlabeled protein, it does not tolerate freezing well.
- TROUBLESHOOTING
- Calibrating the Assembly Assay (Time: 2 hours on day 1, 10 minutes on day 2)
Pre-treat black, flat-bottomed 96-well plates by adding 150 μl of 2% w/v Carnation dried milk per well and incubating for 2 hours at room temperature. Discard the blocking solution. Wash plates with 200 μL of deionized water per well four times, flicking the contents of the plate into the sink after each wash, and then dry by aggressively slamming them on paper towels. Cover plates with packaging tape. They may be stores at 21 °C for several days. PAUSE POINT
- Generate an assembly standard curve at 150 and 300 mM NaCl to determine the pseudo-critical concentration of free dimer, above this concentration nearly all additional protein goes to form capsid (see also Anticipated Results). In a pre-treated plate, set up two columns in the plate with 40 μL samples of C150Bo, where each column has wells at concentrations of 0, 1, 2, 3, 4, 5, 6, and 7 μM prepared by diluting C150Bo stock with 50 mM HEPES buffer pH 7.5.
- CRITICAL STEP Because there is some batch-to-batch variation in C150Bo, the KDapparent for capsid formation should be determined empirically. Generally, the KDapparent for C150Bo at 150 mM NaCl is about 4 μM; at 300 mM NaCl the KDapparent is approximately 1μM.
Initiate assembly by adding to each sample 10 μL of 750 mM NaCl in 50 mM HEPES buffer pH 7.5 to one column of wells and 10 μL of 1500 mM NaCl in 50 mM HEPES buffer pH 7.5 to the other column. Mix reactions by aspiration.
Prepare control solutions as follows: for full-assembly control, mix 50 μL of 10 μM C150Bo with 50 μL of 2 M NaCl in 50 mM HEPES pH 7.5. For no-assembly controls, mix 50 μL of 10 μM C150Bo with 50 μL of 50 mM HEPES pH 7.5. Prepare also buffer blanks. Cover the plate with adhesive tape. PAUSE POINT Allow the reaction to equilibrate for 24 hours.
Remove the adhesive tape from the plates and measure the fluorescence of the samples from steps 8 and 9 in a fluorescence plate reader, either using a standard fluorescein filter set or setting the excitation wavelength to 485 nm and the emission wavelength to 535 nm.
- The fluorescence of the full-assembly control should be no more than 1/10 the fluorescence of the no-assembly control. After background subtraction (signal from wells containing buffer only), the fluorescence data should be normalized to percent assembly.
- CRITICAL STEP. For calibration, include triplicate controls of full-assembly, no-assembly, and buffer (as a blank). For screens, (below) include triplicate controls of full-assembly, no-assembly, 25% assembly, and buffer background. It is better to repeat experiments with assembly effectors in triplicate on three different days to ensure that assays are independent, rather than to test each compound in triplicate on the same plate.
- Assay Assembly Effectors (Time: 2 hours on day 1, 10 minutes on day 2)
We choose protein concentrations where we have 25−30% assembly as the best compromise for identifying enhancers and inhibitors and allowing us to observe HBV assembly kinetics. For a typical C150Bo stock, 25% assembly is achieved at 5.25 μM dimer. Make a stock solution of 1.25X this concentration of C150Bo (6.6 μM for this typical case). For each compound to be tested and each control, add 37.5 μL of stock protein solution to a well.
- To each well, add 10−20 μM of a compound to be tested and incubate for 30 minutes. For screening purposes, the compound should be in molar excess of the capsid protein. Since compound stocks are typically 20 mM in DMSO, an aliquot of this stock is diluted 1:99 with 50 mM HEPES TO 0.2 mM. Dilution into buffer decreases the amount DMSO added to the reaction. 2.5 μL of diluted compound or buffer+DMSO (as a control) is added to each well. Add 2.5 μL of 1% DMSO to each control sample. Total volume is now 40 μL.
- CRITICAL STEP. This assay depends on keeping all reactants in solution. If a well appears cloudy due to precipitation of compound and/or protein the results from that sample are not valid.
- CRITICAL STEP. DMSO in high concentrations does affect assembly. C150Bo assembly is not affected by ≤ 1% DMSO. If you are studying assembly of other proteins or using other solvents, be sure to control for solvent effect.
To obtain a final concentration of 150 mM NaCl in 50 mM HEPES pH 7.5, add 10 μL of 750 mM NaCl, and mix by aspirating. For controls add 10 μL buffer with no NaCl (0% assembly), buffer with 5 M NaCl (100% assembly), and buffer with 750μM assembly (25% assembly).
- Take readings (as described in step 10). For kinetic studies, read fluorescence at 5 minute intervals after mixing; continue readings for one hour, then cover the plate and store in the dark at 21°C. PAUSE POINT For the final point in the kinetic experiment and for endpoint analysis, read fluorescence after 24 hours.
- TROUBLESHOOTING
- Convert fluorescence to % assembly (See step 12). If you are not interested in observing kinetic effects on assembly, this protocol ends here. Otherwise please consult the Data Analysis section and the Anticipated Results.
- TROUBLESHOOTING
- Data Analysis
For fitting raw fluorescence data (see Choice of kinetic model in Introduction), hold Finitial constant, as it is experimentally determined. Allow Ffinal to vary; however, to prevent absurd curve fits, limit its value to less than or equal to the average of the fluorescence at 60 and 1440 minutes. In cases where assembly is very fast, curve-fitting routines will settle on unrealistically fast time constants; when assembly is altogether prevented, time constants will often be unrealistically slow and may have extremely high or even negative values for Ffinal. For a %assembly fit, %final is adjustable and should have the same characteristics as Ffinal, i.e. a starting value of %assembly at 1440 minutes and a minimum value of the mean of assembly at 60 and 1440 minutes. The time constant, kt, must be allowed to float freely; a useful starting value is 20 minutes. Cooperativity, n, can be held at 1.0 or allowed to freely float. For HBV, where the lag phase is not particularly extreme, we hold n =1.
In order to fit assembly, we routinely use the “solver” add-in for Microsoft EXCEL or Kaleidagraph. For describing the data, including the curve fits, useful terms are 1/kt, calculated final assembly based on Ffinal or %assembly, cooperativity (n), and the experimentally observed assembly at 24 hours.
- Using the %assembly data, the effect of a small molecule on the assembly association constant can be evaluated (see reference 24). On the assumption that the protein self-assembles into a typical 120-dimer capsid, Kcapsid = [capsid]/[dimer]120. For %assembly data:
Since a capsid is held together by 240 pairwise contacts and there is statistical degeneracy in the assembly of an icosahedron, the association constant per contact is:
where R is the universal gas constant (1.987 cal deg−1 mol−1), T is temperature in Kelvin, and 2.303 is the conversion from log10 to natural log.
Figure 2.
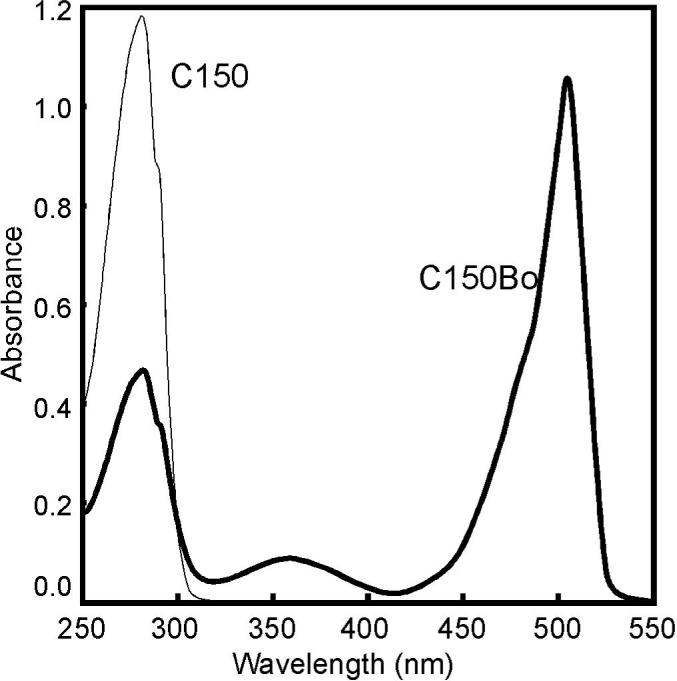
Absorbance spectra. Unmodified C150 (19 μM, thin line) has a typical protein spectrum. The C150Bo spectrum (7.8 μM, thick line) is a weighted sum of contributions from protein and the BoDIPY dye. There are slight changes in the spectrum related to formation of the ground-state BoDIPY dimer concomitant with assembly15, but not enough to affect the calculations for concentration (step 5).
ANTICIPATED RESULTS
Quantifying labeling (step 5)
A protein absorbance spectrum is dominated by tryptophan and tyrosine resulting in a broad peak at 280 nm with a shoulder at 295 nm39. There is some BoDIPY absorbance in this region but, for C150Bo, at 504 nm only BoDIPY absorbs light. For the sample shown in figure 2, the reading at 504 nm is 1.05. As shown in step 5, using an extinction coefficient of 78,000 M−1 cm−1, the concentration of BoDIPY-FL in the sample is 14.8 μM. The concentration of protein in the sample is determined from the absorbance at 280 nm, 0.485, using an ε280C150 = 60,900 M−1 cm−1, less the absorbance due to BoDIPY (ε280 = 1300 M−1 cm−1). This results in a protein concentration of 7.8 μM. The ratio of BoDIPY to protein concentration is the number of dyes per dimer, in this case 1.9.
Calibrating assembly (steps 6−11)
The goal of calibrating assembly is to determine a concentration of C150Bo that will be most sensitive to assembly effectors under given assembly conditions. For this purpose, we have elected the best scenario to be one in which 25% of the total protein assembles and 75% remains free dimer. Given that at 150 mM NaCl, if the pseudo-critical concentration of assembly is 4 μM, then at a concentration of 5.25 μM C150Bo, 1.25 μM C150Bo will be assembled and 4 μM will be in the dimer form. (The pseudo-critical concentration is approximately equal to KDapparent, the point where there are equal molar concentrations of free dimer and capsid. KDapparent in turn can be directly related to the pairwise association constant, Kcontact.3-5) After subtracting the background for all samples, the fluorescence of free and assembled protein can be estimated from the control samples for all protein concentrations. The amount of assembly for each sample can then be calculated for each test sample using the equation in step 11 and the control values for “no-assembly” and “full-assembly”.
Results from a screen (steps (12−16))
The change in assembly over the course of one hour for 5 samples is shown as solid lines in figure 3. Three standard samples are (a) no additives (25% assembly), (b) +10μM HAP1, and (c) +1 M urea. It is pretty clear that most assembly is happening in the first few minutes for the first two samples and that urea practically halts assembly. Compound B37 has no detectable effect on assembly. Compound B36 enhances assembly dramatically. Second order curve fits (Figure 3, dashed lines), shown for B36 and B37, clearly are an approximation with systematic deviation. Nonetheless, the reciprocal of the time constant is a useful approximation for describing assembly kinetics.
These data are summarized in figure 4. For 25% assembly of 5.25 μM C150Bo, induced by 150mM NaCl, the ΔGcontact is −3.38 kcal/mol (calculated as in step 19 above). The presence of 10 μM HAP1+150mM NaCl results in 65% assembly indicating an association energy of −3.65 kcal/mol. Though this change (HAP1 enhances assembly by ΔΔG = −0.27 kcal/mol) is relatively small per contact, it must be understood that there are 240 such contacts per capsid. The noise inherent in this system is about ±5 percentage points. The reciprocal time constant generally tracks with the % assembly, about 10 minutes for the 25% assembly control and 2 minutes for the HAP1+150 mM NaCl. In some cases (e.g. B45), assembly speeds up even though the increase in assembly is not all that great.
Final comments
The protocol described in this paper will allow one to observe assembly in vitro and screen small molecules that affect assembly. The analyses described in this protocol are intentionally crude — they allow the experimentalist to identify which molecules do and do not affect assembly, but they tell little about the mechanism of binding. All experiments here are at relatively high concentrations of effector, 10 μM; we are looking for an effect, not a dissociation constant. Fundamentally different experiments will be required to identify the significant mechanistic details: KD, effects on nucleation and elongation rate constants, and morphology of assembly products. The simple curve fits developed here are an index for activity and should not be interpreted otherwise. The true kinetic trajectories are generally sigmoidal but can adopt much more complex shapes in response to changes in reaction conditions12, 42, keeping in mind that, by definition, assembly effectors change reaction conditions.
TROUBLESHOOTING
Step 6
Problem: Non-specific, non-covalently associated dye can persist after initial purification and will interfere with assembly screens by affecting the protein, increasing the background and decreasing the dynamic range of the assay. It is usually seen as more than 2 dyes per
C150 dimer OR, after 24 hours, the C150Bo sample becomes slightly cloudy and reddish due to aggregation of the free dye.
Solution: Aggregated dye can be removed by centrifuging the labeled sample for 30 minutes at 20,000g. Because the free dye binds Sepharose, non-covalently associated dye can be removed by elution through another Sephadex G25 column.
Step 16
Problem: Inconsistent results.
Solution: Temperature affects assembly reactions and fluorescence output. Keep experimental temperature constant. Bubbles ruin fluorescence readings, even little bubbles.
Problem: Colored small molecules.
Solution: Small molecules that absorb light in the same range as excitation and emission will decrease the fluorescence output due to an “inner filter” effect43. The inner filter effect can be corrected for the absorbance of the small molecule:
where Fobserved is the observed fluorescence. The absorbance can be calculated from the extinction coefficient, concentration, and path length using Beer's law. We determined that the path length was 0.2 cm for 50 μl samples in a 96-well format; this was accomplished by generating a standard curve of free BoDIPY emission in the presence of different non-fluorescent molecules of known concentration and extinction coefficient. The inner filter effect is negligible for molecules with an extinction coefficient < 25,000 M−1 cm-1.
Problem: Some small molecules are fluorescent. Because their fluorescence may be sensitive to binding capsid protein, determining their effect on assembly requires control experiments with unlabeled protein. Also, hypothetically, some molecules may specifically interact with the fluorophore and not the the assembly reaction, yielding a false result.
Data Analysis
Problem: How can one discern the difference between mis-assembly and capsid formation?
Solution: Misdirected assembly, assembly of non-capsid polymers, is a very desirable outcome for an assembly effector. There is no direct readout for misdirection from this high throughput assay. However, we can make the generalization that misdirected assembly proceeds without “editing” to remove incorrectly incorporated subunits. This lack of editing is predicted to be more likely when assembly is much faster or much stronger25; faster and/or stronger can be detected using this assay.
Timeline
Protein purification: 5 days
Labeling protein: 1 hour on day 1, about 2 hours on day 2.
Calibrating assay: 1 hour of set-up, overnight incubation, and 5 minutes to read samples
Screen: about 2 hours per plate on day 1, about 5 minutes to reread each plate on day 2
Acknowledgements
We thank Dr MG Finn and Dr Seijun Lee (TSRI) for the B compounds used to demonstrate the assay in this protocol. This work was supported by a grant from the National Institutes of Health (R01-AI 67417−01) to AZ and an American Cancer Society-Mary Horton post doctoral fellowship to CRB.
Footnotes
Competing interest statement: We have applied for a patent for this assay.
References
- 1.Alberts B, et al. Molecular Biology of the Cell. Garland Publishing; New York: 1994. [Google Scholar]
- 2.Strausberg RL, Schreiber SL. From knowing to controlling: a path from genomics to drugs using small molecule probes. Science. 2003;300:294–295. doi: 10.1126/science.1083395. [DOI] [PubMed] [Google Scholar]
- 3.Zlotnick A. To build a virus capsid. An equilibrium model of the self assembly of polyhedral protein complexes. J Mol Biol. 1994;241:59–67. doi: 10.1006/jmbi.1994.1473. [DOI] [PubMed] [Google Scholar]
- 4.Zlotnick A, Ceres P, Singh S, Johnson JM. A small molecule inhibits and misdirects assembly of hepatitis B virus capsids. J Virol. 2002;76:4848–4854. doi: 10.1128/JVI.76.10.4848-4854.2002. [DOI] [PMC free article] [PubMed] [Google Scholar]
- 5.Prevelige PEJ. Inhibiting virus-capsid assembly by altering the polymerisation pathway. Trends Biotech. 1998;16:61–65. doi: 10.1016/s0167-7799(97)01154-2. [DOI] [PubMed] [Google Scholar]
- 6.Smith TJ, et al. The site of attachment in human rhinovirus 14 for antiviral agents that inhibit uncoating. Science. 1986;233:1286–1293. doi: 10.1126/science.3018924. [DOI] [PubMed] [Google Scholar]
- 7.Zhang Y, et al. Structural and virological studies of the stages of virus replication that are affected by antirhinovirus compounds. J Virol. 2004;78:11061–11069. doi: 10.1128/JVI.78.20.11061-11069.2004. [DOI] [PMC free article] [PubMed] [Google Scholar]
- 8.Romero JR. Pleconaril: a novel antipicornaviral drug. Expert Opin Investig Drugs. 2001;10:369–379. doi: 10.1517/13543784.10.2.369. [DOI] [PubMed] [Google Scholar]
- 9.Weber O, et al. Inhibition of human hepatitis B virus (HBV) by a novel non-nucleosidic compound in a transgenic mouse model. Antiviral Res. 2002;54:69–78. doi: 10.1016/s0166-3542(01)00216-9. [DOI] [PubMed] [Google Scholar]
- 10.Deres K, et al. Inhibition of hepatitis B virus replication by drug-induced depletion of nucleocapsids. Science. 2003;299:893–896. doi: 10.1126/science.1077215. [DOI] [PubMed] [Google Scholar]
- 11.Hacker HJ, Deres K, Mildenberger M, Schroder CH. Antivirals interacting with hepatitis B virus core protein and core mutations may misdirect capsid assembly in a similar fashion. Biochem Pharmacol. 2003;66:2273–2279. doi: 10.1016/j.bcp.2003.08.001. [DOI] [PubMed] [Google Scholar]
- 12.Stray SJ, et al. A heteroaryldihydropyrimidine activates and can misdirect hepatitis B virus capsid assembly. Proc Natl Acad Sci U S A. 2005;102:8138–8143. doi: 10.1073/pnas.0409732102. [DOI] [PMC free article] [PubMed] [Google Scholar]
- 13.Bourne C, Finn MG, Zlotnick A. Global structural changes in hepatitis B capsids induced by the assembly effector HAP1. J Virol. 2006;80:11055–11061. doi: 10.1128/JVI.00933-06. [DOI] [PMC free article] [PubMed] [Google Scholar]
- 14.Stray SJ, Zlotnick A. BAY 41−4109 has multiple effects on Hepatitis B virus capsid assembly. J Mol Recognit. 2006;19:542–548. doi: 10.1002/jmr.801. [DOI] [PubMed] [Google Scholar]
- 15.Stray SJ, Johnson JM, Kopek BG, Zlotnick A. An in vitro fluorescence screen to identify antivirals that disrupt hepatitis B virus capsid assembly. Nat Biotechnol. 2006;24:358–362. doi: 10.1038/nbt1187. [DOI] [PubMed] [Google Scholar]
- 16.Ganem D, Schneider RJ. Hepadnaviridae: The Viruses and Their Replication. Edn. 4. Lippincott Williams & Wilkins; Philadelphia: 2001. [Google Scholar]
- 17.Zhou S, Standring DN. Hepatitis B virus capsid particles are assembled from core-protein dimer precursors. Proc.Natl.Acad.Sci.U.S.A. 1992;89:10046–10050. doi: 10.1073/pnas.89.21.10046. [DOI] [PMC free article] [PubMed] [Google Scholar]
- 18.Crowther RA, et al. Three-dimensional structure of hepatitis B virus core particles determined by electron cryomicroscopy. Cell. 1994;77:943–950. doi: 10.1016/0092-8674(94)90142-2. [DOI] [PubMed] [Google Scholar]
- 19.Stannard LM, Hodgkiss M. Morphological irregularities in Dane particle cores. J. Gen. Virol. 1979;45:509–514. doi: 10.1099/0022-1317-45-2-509. [DOI] [PubMed] [Google Scholar]
- 20.Steven AC, et al. Structure, assembly, and antigenicity of hepatitis B virus capsid proteins. Adv Virus Res. 2005;64:125–164. doi: 10.1016/S0065-3527(05)64005-5. [DOI] [PubMed] [Google Scholar]
- 21.Wynne SA, Crowther RA, Leslie AG. The crystal structure of the human hepatitis B virus capsid. Mol Cell. 1999;3:771–780. doi: 10.1016/s1097-2765(01)80009-5. [DOI] [PubMed] [Google Scholar]
- 22.Dryden KA, et al. Native hepatitis B virions and capsids visualized by electron cryomicroscopy. Mol Cell. 2006;22:843–850. doi: 10.1016/j.molcel.2006.04.025. [DOI] [PubMed] [Google Scholar]
- 23.Zlotnick A, Johnson JM, Wingfield PW, Stahl SJ, Endres D. A theoretical model successfully identifies features of hepatitis B virus capsid assembly. Biochemistry. 1999;38:14644–14652. doi: 10.1021/bi991611a. [DOI] [PubMed] [Google Scholar]
- 24.Ceres P, Zlotnick A. Weak protein-protein interactions are sufficient to drive assembly of hepatitis B virus capsids. Biochemistry. 2002;41:11525–11531. doi: 10.1021/bi0261645. [DOI] [PubMed] [Google Scholar]
- 25.Zlotnick A. Theoretical aspects of virus capsid assembly. J. Mol. Recognit. 2005;18:479–490. doi: 10.1002/jmr.754. [DOI] [PubMed] [Google Scholar]
- 26.Adolph KW, Butler PJ. Assembly of a spherical plant virus. Philos Trans R Soc Lond B Biol Sci. 1976;276:113–122. doi: 10.1098/rstb.1976.0102. [DOI] [PubMed] [Google Scholar]
- 27.Prevelige J, Thomas D, King J. Scaffolding protein regulates the polymerization of P22 coat subunits into icosahedral shells in vitro. J.Mol.Biol. 1988;202:743–757. doi: 10.1016/0022-2836(88)90555-4. [DOI] [PubMed] [Google Scholar]
- 28.Johnson JM, et al. Regulating self-assembly of spherical oligomers. Nano Lett. 2005;5:765–770. doi: 10.1021/nl050274q. [DOI] [PubMed] [Google Scholar]
- 29.Parent KN, Zlotnick A, Teschke CM. Quantitative Analysis of Multi-component Spherical Virus Assembly: Scaffolding Protein Contributes to the Global Stability of Phage P22 Procapsids. J Mol Biol. 2006;359:1097–1106. doi: 10.1016/j.jmb.2006.03.068. [DOI] [PubMed] [Google Scholar]
- 30.Rapaport DC. Self-assembly of polyhedral shells: A molecular dynamics study. Phys Rev E Stat Nonlin Soft Matter Phys. 2004;70:051905. doi: 10.1103/PhysRevE.70.051905. [DOI] [PubMed] [Google Scholar]
- 31.Hagan MF, Chandler D. Dynamic Pathways for Viral Capsid Assembly. Biophys J. 2006 doi: 10.1529/biophysj.105.076851. [DOI] [PMC free article] [PubMed] [Google Scholar]
- 32.Zhang T, Schwartz R. Simulation study of the contribution of oligomer/oligomer binding to capsid assembly kinetics. Biophys J. 2006;90:57–64. doi: 10.1529/biophysj.105.072207. [DOI] [PMC free article] [PubMed] [Google Scholar]
- 33.Reddy VS, et al. Virus Particle Explorer (VIPER), a website for virus capsid structures and their computational analyses. J Virol. 2001;75:11943–11947. doi: 10.1128/JVI.75.24.11943-11947.2001. [DOI] [PMC free article] [PubMed] [Google Scholar]
- 34.Riddles PW, Blakeley RL, Zerner B. Reassessment of Ellman's reagent. Methods Enzymol. 1983;91:49–60. doi: 10.1016/s0076-6879(83)91010-8. [DOI] [PubMed] [Google Scholar]
- 35.Bergstrom F, et al. Dimers of dipyrrometheneboron difluoride (BODIPY) with light spectroscopic applications in chemistry and biology. J Am Chem Soc. 2002;124:196–204. doi: 10.1021/ja010983f. [DOI] [PubMed] [Google Scholar]
- 36.Vogel M, Diez M, Eisfeld J, Nassal M. In vitro assembly of mosaic hepatitis B virus capsid-like particles (CLPs): rescue into CLPs of assembly-deficient core protein fusions and FRET-suited CLPs. FEBS Lett. 2005;579:5211–5216. doi: 10.1016/j.febslet.2005.08.044. [DOI] [PubMed] [Google Scholar]
- 37.Endres D, Miyahara M, Moisant P, Zlotnick A. A reaction landscape identifies the intermediates critical for self-assembly of virus capsids and other polyhedral structures. Protein.Sci. 2005;14:1518–1525. doi: 10.1110/ps.041314405. [DOI] [PMC free article] [PubMed] [Google Scholar]
- 38.van Holde KE, Johnson WC, Ho PS. Principles of Physical Biochemistry. Prentice-Hall; Upper Saddle River: 1998. [Google Scholar]
- 39.Pace CN, Vajdos F, Fee L, Grimsley G, Gray T. How to measure and predict the molar absorption coefficient of a protein. Protein Sci. 1995;4:2411–2423. doi: 10.1002/pro.5560041120. [DOI] [PMC free article] [PubMed] [Google Scholar]
- 40.Ceres P, Stray SJ, Zlotnick A. Hepatitis B Virus Capsid Assembly is Enhanced by Naturally Occurring Mutation F97L. J. Virol. 2004;78:9538–9543. doi: 10.1128/JVI.78.17.9538-9543.2004. [DOI] [PMC free article] [PubMed] [Google Scholar]
- 41.Wingfield PT, et al. The extracellular domain of immunodeficiency virus gp41 protein: expression in Escherichia coli, purification, and crystallization. Protein Sci. 1997;6:1653–1660. doi: 10.1002/pro.5560060806. [DOI] [PMC free article] [PubMed] [Google Scholar]
- 42.Stray SJ, Ceres P, Zlotnick A. Zinc ions trigger conformational change and oligomerization of hepatitis B virus capsid protein. Biochemistry. 2004;43:9989–9998. doi: 10.1021/bi049571k. [DOI] [PubMed] [Google Scholar]
- 43.Lakowicz JR. Principles of Fluorescence Spectroscopy. Edn. 2. Kluwer Academic/Plenum Publishers; New York: 1999. [Google Scholar]