

Abstract
To identify sequence variants in genes that may have roles in neuronal responses to alcohol, we resequenced the 5′ region of NTRK2 and determined linkage disequilibrium (LD) values, haplotype structure, and performed association analyses using 43 single nucleotide polymorphisms (SNPs) covering the entire NTRK2 region in a Finnish Caucasian sample of 229 alcohol dependent subjects with antisocial personality disorder and 287 healthy controls. Individually, three SNPs were associated with alcohol dependence and alcohol abuse (AD)(P-value from 0.0019 to 0.0059, significance level was set at P ≤ 0.01 corrected for multiple testing), while a common eighteen-locus haplotype within the largest LD block of NTRK2, a 119 kb region containing the 5′ flanking region and exons 1 through 15, was marginally overrepresented in control subjects compared to AD individuals (global P = 0.057). Taken together, these results support a role for the NTRK2 gene in addiction in a Caucasian population with AD and a subtype of antisocial personality disorder.
Keywords: alcoholism, gene, tyrosine kinase B receptor, TrkB, NTRK2 gene, single nucleotide polymorphism, SNP, association
Introduction
Alcohol dependence (MIM 103780) is a common complex addiction having a heritability of at least 50%, in both men and women.1 Approximately 7 % of the adult U.S. population (about 18 million individuals) is diagnosed with alcohol abuse or dependence.2 Vulnerability to alcoholism is most likely due to multiple interacting genes, each having a modest contribution to the phenotype and gene-environment interactions. Understanding the contribution of allelic variation to alcohol dependence (AD) will aid in defining neurochemical pathways that are altered in the brain to produce addiction and to better understand mechanisms that may be shared with other habit-forming behaviors in humans, such as cigarette smoking.3
Candidate gene studies and linkage-based genome scans have identified multiple chromosomal regions as sources of potential susceptibility to AD as well as other addictions, showing some convergent findings.4 Examples of this convergence are the genes encoding alcohol dehydrogenase IB and aldehyde dehydrogenase 2, which were originally based on the mechanism of the association of ADH1B and ALDH2 polymorphisms with AD in that the isoenzymes encoded by these alleles lead to an accumulation of acetaldehyde during alcohol metabolism. In other investigations of interest to the current study, cigarette smoking with or without AD, were linked to broad regions of chromosomes 9 and 11.4–9 Among the candidate addiction susceptibility genes defined by these linkage signals were those that encode the neurotrophin, brain-derived neurotrophic factor (BDNF, chromosome 11), and its cognate receptor, neurotrophic tyrosine kinase receptor B (TrkB) (NTRK2, chromosome 9).
Neurotrophins are a family of developmentally regulated proteins that are critical for differentiation and survival of post-mitotic neurons and in synaptic plasticity. The biological activity of neurotrophins is mediated by the Trk family of receptors having intrinsic protein-tyrosine kinase activity10, but with different binding affinities for neurotrophins. High-affinity binding and receptor activation by BDNF is mediated by TrkB. BDNF binding to TrkB results in receptor dimerization and trans-autophosphorylation of tyrosine residues in the carboxyl-terminal intracellular domain that is required for activation of signaling cascades, which include transcriptional activation of the BDNF gene (BDNF).11
At least three protein isoforms of TrkB are produced by alternative splicing of NTRK2 pre-mRNAs. These isoforms are the full-length tyrosine kinase receptor, an isoform lacking the tyrosine kinase domain (TrkB-T1), and an isoform lacking the tyrosine kinase domain but containing a Shc binding site (TrkB-T-Shc).12 All three isoforms are expressed in brain. The T1 isoform has dominant inhibitory effects on BDNF-mediated signaling, although the cellular and molecular functions of truncated TrkB isoforms are not well understood.13–16 However, there is accumulating evidence that truncated TrkB isoforms have both dominant-negative inhibitory activity on full-length TrkB receptors and yet are capable of mediating signal transduction independent of full-length TrkB receptors.14,15,17,18
Evidence supporting a role for BDNF signaling in mechanisms of alcohol and drug dependence has been well documented using different animal models. For example, McGough and co-workers showed that in BDNF-deficient mice, decreased levels of BDNF lead to increased ethanol sensitization and increased voluntary ethanol consumption after a two week withdrawal compared to wild-type animals.19 In addition, this group showed that when wild-type C57BL/6 mice were allowed to self-administer ethanol, having unlimited access to both water and a 10% ethanol solution for four weeks, BDNF mRNA levels were significantly increased in dorsal striatum, a brain region associated with motor control. These results suggest that BDNF signaling is part of regulatory pathway that may offset the development of dependence by limiting alcohol intake. This concept was supported by a previous report where rats received an infusion of BDNF into the ventral tegmental area (VTA), preventing drug-induced adaptations in a brain region known to be involved in drug reinforcing behavior.20 The essential functional role of BDNF in TrkB-mediated signaling was demonstrated in a model of neurodegeneration, where survival of hippocampal neurons in culture derived from trisomy 16 mice, which produce the truncated kinase deficient isoform, Trk-T1, and would be destined to die were restored by introduction of exogenous full-length TrkB.21
A role for TrkB liked to AD in humans has not been reported. In the present study, we found evidence for allele, genotype, and haplotype-based association of NTRK2 with AD, antisocial personality disorder type, in a Finnish population. These data provide evidence for a new role of TrkB in addictive disorders. As a first approach to identifying sequence variants that may control NTRK2 expression, we also resequenced the 5′ region of NTRK2.
Results
Identification of NTRK2 sequence variants in the 5′ region
Resequencing of the 5′ region of NTRK2 in a clinically and ethnically diverse sample of 190 unrelated individuals uncovered two novel sequence variants (LNG5 and LNG7; Table 1). The two previously unknown SNPs were located within intronic sequences. Five of the seven variants were previously known and were located in either the 5′ flanking region or 5′-UTR. These other five SNPs were reported in the National Center for Biotechnology Information (NCBI) Single Nucleotide Polymorphism Database (dbSNP) or the Celera Discovery Systems databases. Celera database and NCBI entries are available through the NCBI and the HapMap Project. Preliminary allele frequencies for each SNP were determined from the number of heterozygotes detected by denaturing high-performance liquid chromatography in the screening panel. Variants LNG5 and LNG7 each were detected at an estimated allele frequency of 0.03. This was a preliminary allele frequency based on the entire screening panel, which was composed of individuals from different ethnic populations. Because SNPs LNG5 and LNG7 were previously unknown, we incorporated them into the marker list as SNP2 and SNP4, respectively.
Table 1.
Single nucleotide polymorphisms (SNPs) identified or confirmed in the 5′ region of NTRK2.
| Identification Number | |||||
|---|---|---|---|---|---|
| SNP (LNG No.) | NCBI | Celera | Variation | Location | Nucleotide positiona |
| LNG1 | rs1212171 | hCV7424025 | C>T | promoter | 84,512,081 |
| LNG2 | rs3758317 | hCV3237595 | C>T | promoter | 84,512,169 |
| LNG3 | rs1187321 | hCV7424024 | A>T | promoter | 84,512,585 |
| LNG4 | NRb | hCV27838439 | G>A | promoter | 84,513,300 |
| LNG5 | NR | NR | A>G | intron 4 | 84,514,790 |
| LNG6 | rs1187325 | hCV3237596 | G>C | 5′-UTR exon 5 | 84,515,149 |
| LNG7 | NR | NR | T>C | intron 5 | 84,515,471 |
HapMap NCBI Build 35.
No record in database.
Hardy-Weinberg equilibrium test
Table 2 shows the SNP markers used in the current study. Genotypes were obtained from a total of 43 SNP markers and were tested for meeting Hardy-Weinberg equilibrium (HWE) expectations in the case and control groups, respectively. All SNPs fit HWE in each group (P > 0.05) with the exception of SNP 19 (P = 0.042) and SNP 32, (P = 0.045), which showed marginally significant departures from HWE. These two markers were excluded from subsequent analyses.
Table 2.
NTRK2 single nucleotide polymorphisms (SNPs) used for genotyping.
| Identification Number | ||||
|---|---|---|---|---|
| SNP | NCBI | Celera | Variation | Nucleotide positiona |
| 1* | rs1147198 | hCV7424042 | C/A | 84504902 |
| 2 (LNG5) | NRb | NR | A/G | 84514790 |
| 3 | rs1187325 | hCV3237596 | G/C | 84515149 |
| 4 (LNG7) | NR | NR | T/C | 84515449 |
| 5* | rs993315 | hCV7424005 | T/C | 84517275 |
| 6* | rs1187352 | hCV3237603 | A/G | 84523011 |
| 7* | rs1619120 | hCV7423969 | T/C | 84531750 |
| 8 | NR | hCV3237607 | T/C | 84533719 |
| 9 | NR | hCV26567668 | C/T | 84545393 |
| 10 | rs7041260 | hCV2121698 | C/G | 84548082 |
| 11* | rs1778934 | hCV2121705 | G/A | 84554176 |
| 12* | rs10081630 | hCV2121711 | T/A | 84558452 |
| 13* | rs2489162 | hCV2121715 | C/T | 84563296 |
| 14* | rs3780632 | hCV11868468 | C/T | 84582342 |
| 15* | rs7048278 | hCV25649147 | G/A | 84589707 |
| 16 | rs7027979 | hCV11868452 | C/G | 84610105 |
| 17* | rs1573219 | hCV7422086 | T/C | 84617176 |
| 18* | rs12555159 | hCV7958799 | A/G | 84624386 |
| 19 | rs1443444 | hCV7958706 | C/T | 84638865 |
| 20 | rs3739804 | hCV7958645 | G/A | 84651185 |
| 21* | rs1624327 | hCV7958636 | T/C | 84658844 |
| 22 | NR | hCV7958628 | C/T | 84664800 |
| 23* | rs1036914 | hCV7958610 | C/T | 84667713 |
| 24* | rs11140776 | hCV1231292 | G/T | 84676481 |
| 25 | rs11140777 | hCV1231291 | C/T | 84676515 |
| 26* | rs10868229 | hCV26567734 | G/A | 84693116 |
| 27* | rs1822420 | hCV11923616 | T/C | 84696830 |
| 28* | rs10780690 | hCV7958556 | T/G | 84707726 |
| 29* | rs3780634 | hCV1231360 | G/A | 84718272 |
| 30* | rs10780691 | hCV1231358 | C/T | 84720807 |
| 31 | rs11788168 | hCV1231354 | A/T | 84729983 |
| 32 | rs736744 | hCV1231348 | A/G | 84743961 |
| 33* | rs4304401 | hCV26566813 | T/C | 84760065 |
| 34* | rs920776 | hCV7423761 | T/C | 84767890 |
| 35* | rs1078947 | hCV581246 | C/T | 84792806 |
| 36 | rs2277192 | hCV7958330 | G/A | 84803531 |
| 37 | rs10746752 | hCV185062 | A/G | 84825270 |
| 38* | rs4504715 | hCV185068 | A/G | 84829632 |
| 39* | rs4242630 | hCV237788 | C/T | 84841099 |
| 40 | rs1565445 | hCV1935385 | C/T | 84846625 |
| 41* | rs1490404 | hCV1935396 | C/T | 84852084 |
| 42 | rs729560 | hCV946149 | G/A | 84863859 |
| 43* | rs1490403 | hCV1935405 | A/T | 84868060 |
HapMap NCBI Build 35.
No record in database.
In addition to our genotyping results, genotypes and allele frequency data were available for these markers from HapMap Public Release #20 for the Utah sample from the Centre d’Etude du Polymorphisme Humain collection (CEU).
Single nucleotide polymorphism association
Genotypes were obtained for each of the 43 SNPs, spanning 363 kb of the NTRK2 gene (Figure 1, Panel A), and analyzed for allelic and genotypic association. For two markers, strong significant allelic association with AD was observed (P = 0.0041 for SNP5 and P = 0.0019 for SNP30) (Table 3). SNP 4 and SNP 30 showed genotypic association with AD after Bonferroni correction (P ≤ 0.01) (Table 3). Of note was the fact that the three significant SNPs (4, 5, and 30) were represented more frequently in the AD group than in the controls, suggesting that these SNPs were associated with AD in the Finnish population.
Figure 1.
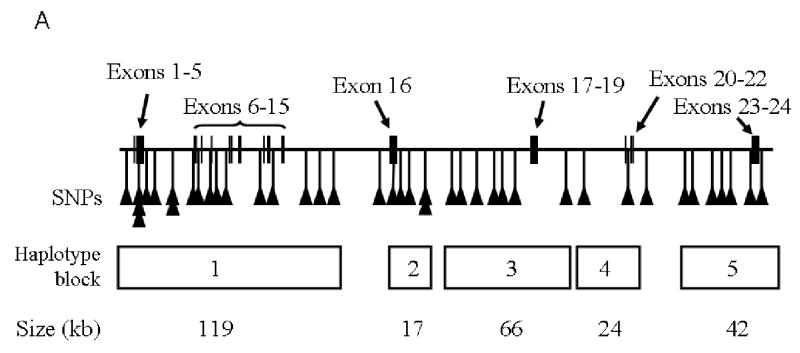
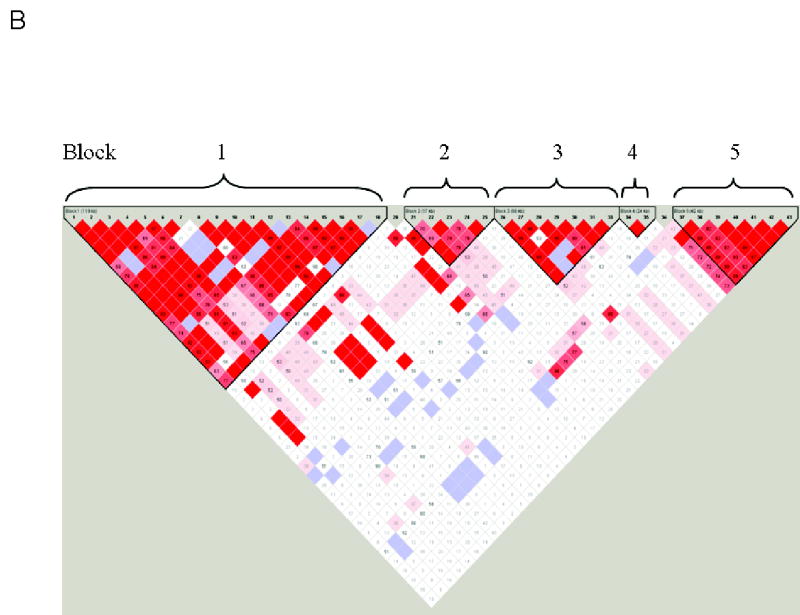
Panel A, Schematic of the NTRK2 gene showing locations of the 24 exons, SNP marker positions, and the haplotype blocks with their approximate physical sizes. Panel B, Haploview-generated LD map of the NTRK2 region in the Finnish Caucasian control sample. The AD sample produced similar results. Regions of high LD (D′ = 1 and LOD > 2) are shown in bright red. Markers with lower LD are shown in red (with D′ value indicated as a percentage) through pink (decreasing color intensity indicates decreasing D′ value). Regions with high D′ values (= 1) but low informativeness (LOD < 2) are shown in light blue. Regions of low LD and low LOD scores (D′ < 2, LOD <2) are shown in white. Five haplotype blocks are indicated.
Table 3.
Genotype-based and allele-based association with antisocial alcohol dependencea.
| SNP | Phenotype | Genotypes | Allele | |||||||
|---|---|---|---|---|---|---|---|---|---|---|
| 1 | 11 | 12 | 22 | Chi Sq | p-value | A1 | A2 | Chi Sq | p-value | |
| control | 206 | 64 | 12 | 7.224 | 0.027 | 476 | 88 | 5.3884 | 0.0203 | |
| 73.05 | 22.7 | 2.39 | 0.844 | 0.156 | ||||||
| AlcDep | 137 | 73 | 11 | 347 | 95 | |||||
| 61.99 | 33.03 | 4.98 | 0.785 | 0.215 | ||||||
| 2 | ||||||||||
| control | 272 | 9 | 0 | 0.694 | 0.405 | 553 | 9 | 0.3492 | 0.5546 | |
| 96.8 | 3.2 | 0 | 0.984 | 0.016 | ||||||
| AlcDep | 205 | 10 | 0 | 420 | 10 | |||||
| 95.35 | 4.65 | 0 | 0.977 | 0.023 | ||||||
| 3 | control | 23 | 109 | 129 | 6.912 | 0.0316 | 155 | 367 | 6.0634 | 0.0138 |
| 8.81 | 41.76 | 49.23 | 0.297 | 0.703 | ||||||
| AlcDep | 26 | 102 | 77 | 154 | 256 | |||||
| 12.68 | 49.76 | 37.56 | 0.376 | 0.624 | ||||||
| 4 | control | 12 | 61 | 203 | 10.272 | 0.0059 | 85 | 467 | 5.4735 | 0.0193 |
| 4.35 | 22.10 | 73.55 | 0.154 | 0.846 | ||||||
| AlcDep | 8 | 74 | 128 | 90 | 330 | |||||
| 3.81 | 35.24 | 60.95 | 0.214 | 0.786 | ||||||
| 5 | control | 25 | 114 | 134 | 9.059 | 0.0108 | 164 | 382 | 8.2322 | 0.0041 |
| 9.16 | 41.76 | 49.08 | 0.300 | 0.700 | ||||||
| AlcDep | 30 | 107 | 77 | 167 | 261 | |||||
| 14.02 | 50.00 | 35.98 | 0.390 | 0.610 | ||||||
| 6 | control | 20 | 110 | 158 | 7.058 | 0.0293 | 150 | 426 | 5.2354 | 0.0221 |
| 6.94 | 38.19 | 54.86 | 0.260 | 0.740 | ||||||
| AlcDep | 19 | 107 | 95 | 145 | 297 | |||||
| 8.60 | 48.42 | 42.99 | 0.328 | 0.672 | ||||||
| 7 | control | 128 | 121 | 24 | 7.937 | 0.0189 | 377 | 169 | 5.6543 | 0.0174 |
| 46.89 | 44.32 | 8.79 | 0.690 | 0.310 | ||||||
| AlcDep | 74 | 118 | 24 | 266 | 166 | |||||
| 34.26 | 56.63 | 11.11 | 0.616 | 0.384 | ||||||
| 8 | control | 276 | 10 | 1 | 1.12 | 0.5713 | 562 | 12 | 0.0009 | 0.9754 |
| 96.17 | 3.48 | 0.35 | 0.979 | 0.021 | ||||||
| AlcDep | 211 | 10 | 0 | 432 | 10 | |||||
| 95.48 | 4.52 | 0 | 0.977 | 0.023 | ||||||
| 9 | control | 271 | 10 | 0 | 0.35 | 0.5542 | 552 | 10 | 0.1279 | 0.7206 |
| 96.44 | 3.56 | 0 | 0.982 | 0.018 | ||||||
| AlcDep | 207 | 10 | 0 | 424 | 10 | |||||
| 95.39 | 4.61 | 0 | 0.977 | 0.023 | ||||||
| 10 | control | 274 | 10 | 0 | 0.341 | 0.5591 | 558 | 10 | 0.1229 | 0.7259 |
| 96.48 | 3.52 | 0 | 0.982 | 0.018 | ||||||
| AlcDep | 210 | 10 | 0 | 430 | 10 | |||||
| 95.45 | 4.55 | 0 | 0.977 | 0.023 | ||||||
| 11 | control | 44 | 130 | 108 | 8.607 | 0.0135 | 218 | 346 | 6.0673 | 0.0138 |
| 15.60 | 46.10 | 38.3 | 0.387 | 0.613 | ||||||
| AlcDep | 42 | 121 | 57 | 205 | 235 | |||||
| 19.09 | 55.00 | 25.91 | 0.466 | 0.534 | ||||||
| 12 | control | 0 | 12 | 275 | 0.193 | 0.6606 | 12 | 562 | 0.0489 | 0.825 |
| 0.00 | 4.18 | 95.82 | 0.021 | 0.979 | ||||||
| AlcDep | 0 | 11 | 209 | 11 | 429 | |||||
| 0.00 | 5.00 | 95 | 0.025 | 0.975 | ||||||
| 13 | control | 40 | 117 | 115 | 8.055 | 0.0178 | 197 | 347 | 4.1445 | 0.0418 |
| 14.71 | 43.01 | 42.28 | 0.362 | 0.638 | ||||||
| AlcDep | 34 | 117 | 65 | 185 | 247 | |||||
| 15.74 | 54.17 | 30.09 | 0.428 | 0.572 | ||||||
| 14 | control | 160 | 95 | 23 | 6.603 | 0.0368 | 415 | 141 | 3.8463 | 0.0499 |
| 57.55 | 34.17 | 8.27 | 0.746 | 0.254 | ||||||
| AlcDep | 101 | 98 | 19 | 300 | 136 | |||||
| 46.33 | 44.95 | 8.72 | 0.688 | 0.312 | ||||||
| 15 | control | 25 | 94 | 166 | 6.661 | 0.0358 | 144 | 426 | 2.83 | 0.0925 |
| 8.77 | 32.98 | 58.25 | 0.253 | 0.747 | ||||||
| AlcDep | 18 | 97 | 105 | 133 | 307 | |||||
| 8.18 | 44.09 | 47.73 | 0.302 | 0.698 | ||||||
| 16 | control | 164 | 88 | 24 | 8.382 | 0.0151 | 416 | 136 | 3.6417 | 0.0563 |
| 59.42 | 31.88 | 8.7 | 0.754 | 0.246 | ||||||
| AlcDep | 100 | 94 | 17 | 294 | 128 | |||||
| 47.39 | 44.55 | 8.06 | 0.697 | 0.303 | ||||||
| 17 | control | 172 | 82 | 15 | 4.3 | 0.1165 | 426 | 112 | 2.4082 | 0.1207 |
| 63.94 | 30.48 | 5.58 | 0.792 | 0.208 | ||||||
| AlcDep | 119 | 85 | 12 | 323 | 109 | |||||
| 55.09 | 39.35 | 5.56 | 0.748 | 0.252 | ||||||
| 18 | control | 270 | 12 | 0 | 0.185 | 0.6673 | 552 | 12 | 0.0449 | 0.8322 |
| 95.74 | 4.26 | 0 | 0.979 | 0.021 | ||||||
| AlcDep | 206 | 11 | 0 | 423 | 11 | |||||
| 94.93 | 5.07 | 0 | 0.975 | 0.025 | ||||||
| 20 | control | 2 | 36 | 245 | 0.912 | 0.6339 | 40 | 526 | 0.0024 | 0.9613 |
| 0.71 | 12.72 | 86.57 | 0.071 | 0.929 | ||||||
| AlcDep | 3 | 24 | 194 | 30 | 412 | |||||
| 1.36 | 10.86 | 87.78 | 0.068 | 0.932 | ||||||
| 21 | control | 179 | 92 | 13 | 2.532 | 0.282 | 450 | 118 | 2.1369 | 0.1438 |
| 63.03 | 32.39 | 4.58 | 0.792 | 0.208 | ||||||
| AlcDep | 124 | 75 | 16 | 323 | 107 | |||||
| 57.67 | 34.88 | 7.44 | 0.751 | 0.249 | ||||||
| 22 | control | 173 | 94 | 14 | 2.387 | 0.3032 | 440 | 122 | 62.0269 | 0.200 |
| 61.57 | 33.45 | 4.98 | 0.783 | 0.217 | ||||||
| AlcDep | 120 | 80 | 16 | 320 | 112 | |||||
| 55.56 | 37.04 | 7.41 | 0.741 | 0.259 | ||||||
| 23 | control | 15 | 93 | 163 | 2.386 | 0.3033 | 123 | 419 | 2.1467 | 0.1429 |
| 5.54 | 34.32 | 60.15 | 0.227 | 0.773 | ||||||
| AlcDep | 18 | 80 | 117 | 116 | 314 | |||||
| 8.37 | 37.21 | 54.42 | 0.270 | 0.730 | ||||||
| 24 | control | 72 | 134 | 81 | 2.587 | 0.2744 | 278 | 296 | 0.1893 | 0.6635 |
| 25.09 | 46.69 | 28.22 | 0.484 | 0.516 | ||||||
| AlcDep | 45 | 119 | 59 | 209 | 237 | |||||
| 20.18 | 56.36 | 26.46 | 0.469 | 0.531 | ||||||
| 25 | control | 77 | 135 | 72 | 2.217 | 0.3301 | 289 | 279 | 0.5435 | 0.461 |
| 27.11 | 47.54 | 25.35 | 0.509 | 0.491 | ||||||
| AlcDep | 59 | 116 | 44 | 234 | 204 | |||||
| 26.94 | 52.97 | 20.09 | 0.534 | 0.466 | ||||||
| 26 | control | 59 | 135 | 78 | 6.864 | 0.0323 | 253 | 291 | 6.4835 | 0.0109 |
| 21.69 | 49.63 | 28.68 | 0.465 | 0.535 | ||||||
| AlcDep | 66 | 100 | 45 | 232 | 190 | |||||
| 31.28 | 47.39 | 21.33 | 0.550 | 0.450 | ||||||
| 27 | control | 3 | 73 | 211 | 1.165 | 0.5585 | 79 | 495 | 0.8197 | 0.3653 |
| 1.05 | 25.44 | 73.52 | 0.138 | 0.862 | ||||||
| AlcDep | 4 | 63 | 155 | 71 | 373 | |||||
| 1.80 | 28.38 | 69.82 | 0.160 | 0.840 | ||||||
| 28 | control | 63 | 151 | 59 | 7.345 | 0.025 | 277 | 269 | 3.9322 | 0.0474 |
| 22.26 | 53.36 | 24.38 | 0.507 | 0.493 | ||||||
| AlcDep | 68 | 116 | 36 | 252 | 188 | |||||
| 30.91 | 52.73 | 16.36 | 0.573 | 0.427 | ||||||
| 29 | control | 206 | 44 | 2 | 0.556 | 0.7575 | 456 | 48 | 0.2195 | 0.6395 |
| 81.75 | 17.46 | 0.79 | 0.905 | 0.095 | ||||||
| AlcDep | 165 | 38 | 3 | 368 | 44 | |||||
| 80.10 | 18.45 | 1.46 | 0.893 | 0.107 | ||||||
| 30 | control | 66 | 142 | 62 | 11.707 | 0.0029 | 274 | 266 | 9.6288 | 0.0019 |
| 24.44 | 52.59 | 22.96 | 0.507 | 0.493 | ||||||
| AlcDep | 26 | 111 | 65 | 163 | 241 | |||||
| 12.87 | 54.95 | 32.18 | 0.403 | 0.597 | ||||||
| 31 | control | 259 | 14 | 0 | 0.076 | 0.7823 | 532 | 14 | 0.0042 | 0.9483 |
| 94.87 | 5.13 | 0 | 0.974 | 0.026 | ||||||
| AlcDep | 208 | 10 | 0 | 426 | 10 | |||||
| 95.41 | 4.59 | 0 | 0.977 | 0.023 | ||||||
| 33 | control | 270 | 15 | 0 | 0.756 | 0.3846 | 555 | 15 | 0.418 | 0.5179 |
| 94.74 | 5.26 | 0 | 0.974 | 0.026 | ||||||
| AlcDep | 212 | 8 | 0 | 432 | 8 | |||||
| 96.36 | 3.64 | 0 | 0.982 | 0.018 | ||||||
| 34 | control | 180 | 98 | 5 | 7.187 | 0.0275 | 458 | 108 | 4.9379 | 0.0263 |
| 63.60 | 34.63 | 1.77 | 0.809 | 0.191 | ||||||
| AlcDep | 121 | 86 | 12 | 328 | 110 | |||||
| 55.25 | 39.27 | 5.48 | 0.749 | 0.251 | ||||||
| 35 | control | 8 | 105 | 166 | 2.913 | 0.2331 | 121 | 437 | 2.204 | 0.1377 |
| 2.87 | 37.63 | 59.5 | 0.217 | 0.783 | ||||||
| AlcDep | 11 | 90 | 115 | 112 | 320 | |||||
| 5.09 | 41.67 | 53.24 | 0.259 | 0.741 | ||||||
| 36 | control | 6 | 74 | 206 | 3.461 | 0.1772 | 86 | 486 | 0.659 | 0.4169 |
| 2.10 | 25.87 | 72.03 | 0.150 | 0.850 | ||||||
| AlcDep | 2 | 71 | 146 | 75 | 363 | |||||
| 0.91 | 32.42 | 66.67 | 0.171 | 0.829 | ||||||
| 37 | control | 222 | 62 | 4 | 2.338 | 0.3107 | 506 | 70 | 0.9898 | 0.3198 |
| 77.08 | 21.53 | 1.39 | 0.878 | 0.122 | ||||||
| AlcDep | 159 | 60 | 2 | 378 | 64 | |||||
| 71.95 | 27.15 | 0.9 | 0.855 | 0.145 | ||||||
| 38 | control | 197 | 65 | 12 | 1.813 | 0.4039 | 459 | 89 | 0.0997 | 0.7522 |
| 71.90 | 23.72 | 4.38 | 0.838 | 0.162 | ||||||
| AlcDep | 157 | 57 | 5 | 371 | 67 | |||||
| 71.69 | 26.03 | 2.28 | 0.847 | 0.153 | ||||||
| 39 | control | 92 | 147 | 41 | 2.709 | 0.2581 | 331 | 229 | 2.1819 | 0.1396 |
| 32.86 | 52.50 | 14.64 | 0.591 | 0.409 | ||||||
| AlcDep | 60 | 112 | 42 | 232 | 196 | |||||
| 28.04 | 52.34 | 19.63 | 0.542 | 0.458 | ||||||
| 40 | control | 41 | 144 | 98 | 2.761 | 0.2514 | 226 | 340 | 2.3488 | 0.1254 |
| 14.49 | 50.88 | 34.63 | 0.399 | 0.601 | ||||||
| AlcDep | 42 | 112 | 64 | 196 | 240 | |||||
| 19.27 | 51.38 | 29.36 | 0.450 | 0.550 | ||||||
| 41 | control | 40 | 142 | 98 | 2.26 | 0.3231 | 222 | 338 | 1.6882 | 0.1938 |
| 14.29 | 50.71 | 35 | 0.396 | 0.604 | ||||||
| AlcDep | 41 | 107 | 67 | 189 | 241 | |||||
| 19.07 | 49.77 | 31.16 | 0.440 | 0.560 | ||||||
| 42 | control | 41 | 147 | 93 | 2.01 | 0.366 | 229 | 333 | 1.085 | 0.2976 |
| 14.59 | 52.31 | 33.1 | 0.407 | 0.593 | ||||||
| AlcDep | 42 | 108 | 67 | 192 | 242 | |||||
| 19.35 | 49.77 | 30.88 | 0.442 | 0.558 | ||||||
| 43 | control | 40 | 147 | 94 | 1.402 | 0.4961 | 227 | 335 | 0.7199 | 0.3962 |
| 14.23 | 52.31 | 33.45 | 0.404 | 0.596 | ||||||
| AlcDep | 38 | 105 | 66 | 181 | 237 | |||||
| 18.18 | 50.24 | 31.58 | 0.433 | 0.567 | ||||||
Genotype and allele counts are shown for each phenotype group. The numbers below each count are frequencies, given as per cent. P-values <0.01 (after multiple test correction) are shown in bold font.
Linkage disequilibrium of NTRK2 gene
Figure 1 (Panel B) shows pairwise D′ values across the 43 markers in the Finnish control population. D′>0.8 was coded as red. Overall linkage disequilibrium was strong across the 353 kb region. Five LD blocks were observed: block1, located at the 5′ end of NTRK2, was defined by eighteen SNPs (SNP1 to SNP18, encompassing the 5′ flanking region and exons 1 through 15 which encode the extracellular and transmembrane domains) covering a physical region of at least 119 kb, accounting for nearly 34% of NTRK2. Within block1, more than 85% of SNP pairs showed complete LD (D′>0.99). Ten of the fourteen markers that showed significant association with alcoholism in a single locus analyses were located within this block. Block 2 contained five SNPs (SNP21 to SNP25, encompassing alternatively spliced exon 16). Three SNP pairs were in complete LD within this block. Block 3 contained six SNPs (SNP26 to SNP33), which covered exons 17 to 19. Ten SNP pairs were in complete LD, producing D′ values > 0.99. Block 4 had only two SNPs (SNP 34 and SNP 35, exons 20 to 22) and these markers were in complete LD. Block 5 was composed of seven SNPs from SNP 37 to SNP43, encompassing exons 23 and 24 with 11 SNP pairs in complete LD. Haplotype structure and frequency were estimated within each block separately for case and control groups.
Haplotype-based association with alcohol dependence with antisocial personality disorder
Haplotypes with frequencies greater than 0.03 in each LD block are listed Table 4. In LD block1, eighteen loci generated five haplotypes with frequencies greater than 0.03 and represented 91% of chromosomes in the control group and 86% in the AD group. The global haplotype comparison in block 1 showed a marginally significant difference (global P = 0.057). For a single haplotype comparison between control and AD groups, haplotype 1A (which embraced the major allele of SNP4 and SNP5) was represented more frequently in the unaffected control group (0.604) than in the AD group (0.527) (χ2 = 5.898, P = 0.013). The P- value remained marginally significant after correction for multiple tests (p = 0.065). Haplotype 1C, which embraced the minor alleles of SNP 4 and SNP5, was more abundant in the AD group (0.129) than in the control group (0.099), although this did not reach statistical significance. Block 2 contained five loci, with five major haplotypes. Haplotype 2B was significantly more abundant in the control group (0.237) than in the AD group (0.181) (χ2 = 4.490, P = 0.034). It was no longer significant after multiple test corrections (corrected P = 0.170). There were four, seven-locus, haplotypes in block 3, which accounted for 94% of chromosomes in the controls and 95% of chromosomes in the alcoholic group. Within block 3, haplotype 3A contained the major allele of SNP 30 and was at slightly higher frequency in the control group (0.503) than in AD subjects (0.424) (χ2 = 5.858, P = 0.015, corrected P = 0.062), while haplotype 3B, which included the minor allele of SNP 30, was more abundant in the AD group than the control group, supporting the prior single allele association with SNP 30. Haplotype block 4 contained only two loci and generated two major haplotypes (4A and 4B). The frequency of haplotype 4B was 0.246 in the AD group while it was represented at lower frequency (0.192) in the controls (χ2 = 3.988, P = 0.046, corrected P = 0.092). Taken together, these results support an association of the NTRK2 gene with AD, using both single locus and haplotype-based approaches.
Table 4.
Haplotype-based association with antisocial alcohol dependence.
| Block | Haplotype | Control (N=287) | AD (N=222) | Global P | P* | Corrected P |
|---|---|---|---|---|---|---|
| 1A | 112222111122212111 | 0.604 | 0.527 | 0.057 | 0.013 | 0.065 |
| 1B | 111211211112112111 | 0.127 | 0.141 | |||
| 1C | 211111211112121221 | 0.099 | 0.129 | |||
| 1D | 112222211112121221 | 0.046 | 0.026 | |||
| 1E | 112222111112121221 | 0.037 | 0.037 | |||
| 2A | 11221 | 0.485 | 0.512 | |||
| 2B | 11212 | 0.237 | 0.181 | 0.944 | 0.034 | 0.170 |
| 2C | 22112 | 0.161 | 0.214 | |||
| 2D | 21212 | 0.046 | 0.036 | |||
| 2E | 12112 | 0.039 | 0.032 | |||
| 3A | 2221111 | 0.503 | 0.424 | 0.740 | 0.015 | 0.062 |
| 3B | 1211211 | 0.238 | 0.283 | |||
| 3C | 1111211 | 0.131 | 0.160 | |||
| 3D | 1212211 | 0.066 | 0.087 | |||
| 4A | 12 | 0.784 | 0.739 | |||
| 4B | 21 | 0.192 | 0.246 | 0.862 | 0.046 | 0.092 |
| 5A | 1112222 | 0.561 | 0.522 | |||
| 5B | 1121111 | 0.137 | 0.162 | |||
| 5C | 1221111 | 0.145 | 0.134 | |||
| 5D | 2121111 | 0.114 | 0.141 |
P- value was calculated for each individual haplotype.
Discussion
The current study provides supportive evidence for an association between variation at NTRK2 and AD. Evidence of association of the NTRK2 gene with AD was gained using both single locus and haplotype-based approaches. In this population, composed of Finnish Caucasians, three markers, of a total of 43 that were genotyped showed significant genotypic/allelic association with AD. Of note was the fact that two of these markers (SNPs 4 and 5) are located to the 5′ end of NTRK2, suggesting that this region may participate in AD directly or indirectly. Moreover, the haplotype-based association results supported over-representation of the 1A haplotype in the control sample, suggesting the presence of a low-risk haplotype in AD.
An additional finding from this study was the pattern of LD across NTRK2 in a Finnish Caucasian population. Overall linkage disequilibrium was strong across the 353 kb region, and five LD blocks were observed. The HapMap Project generated data on genome-wide levels of variation in different human populations with the intent of guiding the design and analysis of medical genetic studies.22 We used publicly available genotyping data from HapMap Public Release #20 to compare patterns of LD between the CEU panel (90 individuals [30 trios] from Utah), and the Finnish sample from this study. A total of 511 SNPs from NTRK2 were genotyped by the HapMap project. Of these, 96 SNPs were selected from HapMap and pairwise measures of LD determined for the NTRK2 region. Using these values of LD from the CEU panel, we were able to observe a similar block-like structure that was visually apparent in Figure 1B (Q.Y. and K.X., unpublished data). Five LD blocks from the Finnish sample were observed although only 43 SNPs were used in this study, suggesting that the 43 SNPs selected were sufficient to represent the “true” LD structure in this region and that the block structure was not an artifact of either low marker density or marker selection.23
To compare haplotype configuration and frequency between CEU and the Finnish samples, we constructed haplotypes using shared SNPs between those used in the HapMap project and this study (26 markers, Table 2). In our analyses, we only considered those haplotypes with a frequency >0.03. We found that haplotype structure and haplotype frequencies were very similar between the two samples ranging from the largest region of LD, Block 1 to the smallest, composed of Block 4. Overall, these results indicate that the block structure and haplotypes within the NTRK2 region are well conserved between the CEU sample and the Finnish sample. When we initiated this study, HapMap data for the NTRK2 region was not available, but such cross-comparisons are essential for designing association studies.23
It is the long term remodeling of neuronal circuitry that is thought to underlie development of addictive behaviors, including AD.24 BDNF is well known to be essential for neuronal survival, protection, and activity-dependent synaptic remodeling. BDNF signaling, via TrkB, may alter the expression of target genes related to limiting alcohol of AD.19 Variation in NTRK2 affecting expression of full-length or truncated isoforms or their stability could profoundly affect this negative regulatory pathway. Thus, during chronic alcohol exposure, individuals with decreased TrkB-mediated signaling may be at greater risk of becoming AD.
Chronic alcohol exposure has been reported to decrease BDNF mRNA levels in the dentate gyrus and CA1 region of hippocampus25, although these findings were not supported by subsequent experiments.26 Global levels and region specific levels of trkB (rat TrkB) mRNA following chronic alcohol exposure were also determined. Levels of trkB mRNA levels were increased in the hippocampus of rats exposed to chronic ethanol, as determined by an RNase protection assay25, although this was not observed using a semi-quantitative RT-PCR assay.26 These disparate findings may be due to the fact that different treatment conditions were performed on different rat strains and different detection methods were used for determining BDNF mRNA levels. Future studies are required to refine treatment conditions and expression assays. With these issues in mind, Tapia-Arancibia et al. observed an increase in trkB mRNA levels in the hypothalamus from chronic alcohol exposed rats, a brain region known to be associated with satiety.25 BDNF-deficient mice exhibited increased eating behavior that was transiently reversed when BDNF was infused.27 Thus, increased TrkB expression or TrkB-mediated signaling may serve as a negative regulatory pathway involved in food consumption that also acts to regulate ethanol intake. This concept is supported by recent findings showing that NTRK2 was associated with increased risk to eating disorders and personality traits related to anxiety.28
This study has a number of strengths and limitations. We used a relatively large number of SNP markers to capture as much variation as possible across NTRK2. Because of this, we were able to perform allele, genotype, and haplotype-based analyses. However, while these association results did not include any known functional variants, they suggest regions of the gene that should have priority in searching for functional variants, particularly the 5′ end of NTRK2. In addition, other methodological issues are of concern, where the application of a Bonferroni correction, taking into account the AD phenotype and 43 different markers may be too stringent for detecting the influence of a single gene predicted of having a modest effect in a complex disease such as AD where multiple genes are thought to have an influence. We think that “overcorrecting” the data is a concern justified by the fact that strong LD exists among the different NTRK2 markers and that the LD blocks themselves are not independent factors, which negates use of a statistical correction. However, as a compromise, we performed a statistical correction by using the number of LD blocks covering this gene for single SNP association tests and presented a global P-value, taking into account multiple tests for haplotype-based association.
Regarding clinical characteristics, because 71% of the AD subjects in this study were also diagnosed with antisocial personality disorder (ASPD), there is a possibility that variation at NTRK2 may also play a role in the course of the disease and not just vulnerability to AD. A plausible functional relationship between alterations in neurotrophin signaling, which would largely occur through TrkB, and comorbid phenotypes with alcoholism has been recently reported by Matsushita et al., who found that the A allele of the G196A (Val66Met) BDNF polymorphism was associated with alcoholic subjects having violent tendencies..29 However, a smaller study involving 110 AD Chinese convicts with violent histories did not support an association of BDNF Val66Met with ASPD comorbidity.30 Additional studies will be necessary in different clinical populations to determine if variation at NTRK2 is associated with ASPD itself, or may modify phenotypes that are comorbid with alcohol dependence.
To our knowledge, this is the first report of NTRK2 association with AD. Although our initial resequencing effort was confined to the 5′ flanking region, it uncovered two previously unknown SNPs. One of these sequence variants (SNP2) is located between two alternative 5′ UTR exons while the other (SNP4) is located within intron 5, which is 3′ of the first coding exon. Their functional impact on NTRK2 regulation is not known. As suggested above, future studies will focus on replicating these preliminary findings in other populations, identifying additional sequence variants in affected individuals that may lead to changes in NTRK2 regulation or TrkB function, and characterization of candidate functional SNPs in different contexts, in vitro and in vivo in order to better understand how alterations in TrkB expression or function impacts alcohol response-related phenotypes.
Materials and Methods
Screening for sequence variants
To identify potentially functional sequence variants in the 5′ region of NTRK2, 3.4 kb of the gene was analyzed in 190 unrelated individuals. The genomic region screened included five know exons in the 5′ untranslated region (5′-UTR) and flanking sequence, comprising 3.1 kb of genomic DNA relative to the translation start site.12 The “resequencing” sample was composed of 40 African Americans, 40 Finnish Caucasians, and 110 U.S. Caucasians. The sample was also clinically diverse, composed of individuals with anxiety disorders (n = 35), major depression (n = 35), anorexia nervosa (n = 20), obsessive-compulsive disorder (n = 20), ASPD(n = 40), suicidal behavior (n = 40), and alcohol dependence (n =110). DNA samples were obtained from cultured white blood cells from repositories. The resequencing strategy based on high performance liquid chromatography (dHPLC) and direct sequence analysis was described previously.31 PCR samples with differential dHPLC elution profiles were selected for direct sequence analysis. Typically, the 10 μl sequencing reaction mixture contained 4 μl BigDye Terminator RR Mix (Applied Biosystems, ABI, Foster City, CA); 2.84 μl of dH2O; 1.6 pmol of forward or reverse primer; and 3 μl of purified PCR amplicon. Cycle conditions for sequencing were 25 cycles consisting of denaturation at 96°C for 10s, annealing at 50°C for 5s, and extension at 60°C for 4 min. Sequencing reaction products were purified by ethanol precipitation, dried, diluted with 25% formamide (v/v), denatured at 95°C for 5 min and analyzed on a 3100 sequencer (ABI, Foster City, CA).
Subjects
The sample Finnish Caucasian population has been described in detail elsewhere.32 A total of 516 psychiatrically interviewed subjects included 229 alcoholics and 287 healthy controls were recruited under a human research protocol approved by the National Institutes of Health, Bethesda, MD, the University of Helsinki Department of Psychiatry institutional review board, Helsinki, Finland; and the University of Helsinki Central Hospital institutional review board. All subjects provided written informed consent. All subjects were interviewed by two senior psychiatrists using The Structured Clinical Interview for DSM-III-R (SCID)33 and were diagnosed using DSM-III-R criteria. The alcohol dependent and alcohol abuse subjects were all male criminal offenders undergoing forensic psychiatric evaluation as inpatients in the Department of Psychiatry, University of Helsinki. Therefore, this population was enriched for antisocial personality disorder (ASPD) and type II alcoholism, which was characterized as alcoholism with antisocial personality disorder.34 Among 229 cases, 71% individuals were AD with ASPD. The 287 unaffected controls were unrelated healthy Finnish male volunteers recruited through local newspaper advertisements.
Single nucleotide polymorphism (SNP) selection and genotyping
A total of 43 SNP loci from NTRK2 were selected for genotyping. The markers covered the entire NTRK2 region with a mean distance of 8796 kb (± 5992 kb) between markers. Genotyping was performed by using 5′- nuclease assays (TaqMan®, Applied Biosystems, Foster City, CA). The allele-specific detection probes and primers for each SNP were designed using Assays-by-Design software (ABI) or were order as Assays-on-Demand. Assay identification numbers are available on request. Approximately 5ng DNA from each sample was plated in 384-well format plates for genotyping with 10% randomly duplicated samples for detecting genotyping error. Genotyping was performed using an Applied Biosystems 7900 Sequence Detector with a 384 well plate format. Three genotype groups were consistently obtained for each biallelic marker based on its relative fluorescence intensity and analyzed by SDS software, version 2.2 (ABI). To access genotype accuracy genotypes were duplicated in approximately 10% of the samples and were randomly selected. Overall genotyping accuracy was 99% with greater than 95% of genotypes completed.
Statistical analyses for linkage disequilibrium, single SNP association, and haplotype-based association
Linkage disequilibrium was estimated based on the formula: D = Pab−PaxPb. D is LD; Pab is the haplotype expectation frequency at loci A and B. The terms Pa and Pb are allele frequencies at two loci. D′ is normalized by the maximum value of possible D. LD was estimated using the Haploview program.35 If D′ values are ≥ 0.98, there is little evidence for historic recombination. Thus, the two markers are considered to be in “strong LD.”36 An LD block was defined according to Gabriel’s definition that less than 5% of comparisons among informative SNP pairs show strong evidence of historic recombine. Five regions of NTRK2 showed strong LD and were defined as LD blocks.
Genotype and allele frequencies were compared between AD and unaffected control subjects using standard χ2 tests. Because pairwise LD values were high across five regions of the NTRK2 region, Bonferroni correction was applied based on five LD blocks. The significance level was set as p ≤ 0.01. Haplotype structure and frequency within the LD block were inferred separately by case and control groups by means of PHASE, which is a program based on a Bayesian algorithm.37 The p values of haplotype-based associations for each block were corrected by the number of haplotypes within the block.
Acknowledgments
This study was supported by intramural research grant Z01-AA00325 from the National Institute on Alcohol Abuse and Alcoholism, National Institutes of Health (RHL).
Footnotes
Web Resources
The URLs for data presented herein are as follows: dbSNP, http://www.ncbi.nlm.nih.gov/SNP
Online Mendelian Inheritance in Man (OMIM), http://www.ncbi.nlm.nih.gov/Omim HapMap Project, http://www.hapmap.org
References
- 1.Reich T, Edenberg HJ, Goate A, Williams JT, Rice JP, Van Eerdewegh P, Foroud T, Hesselbrock V, Schuckit MA, Bucholz K, Porjesz B, Li T-K, Conneally PM, Nurnberger JI, Jr, Tischfield JA, Crowe RR, Cloninger CR, Wu W, Shears S, Carr K, Crose C, Willig C, Begleiter H. Genome-wide search for genes affecting the risk for alcohol dependence. Am Journal of Med Gen. 1998;81:207–215. [PubMed] [Google Scholar]
- 2.Li T-K, Hewitt BG, Grant BF. Alcohol use disorders and mood disorders: A National Institute on Alcohol Abuse and Alcoholism perspective. Biol Psychiatry. 2004;56:718–720. doi: 10.1016/j.biopsych.2004.03.006. [DOI] [PubMed] [Google Scholar]
- 3.True WR, Xian H, Scherrer JF, Madden PAF, Bucholz KK, Heath AC, Eisen SA, Lyons MJ, Goldberg J, Tsuang M. Common genetic vulnerability for nicotine and alcohol dependence in men. Arch Gen Psychiatry. 1999;56:655–661. doi: 10.1001/archpsyc.56.7.655. [DOI] [PubMed] [Google Scholar]
- 4.Liu Q-R, Drgon T, Walther D, Johnson C, Poleskaya O, Hess J, Uhl GR. Pooled association genome scanning: Validation and use to identify addiction vulnerability loci in two samples. PNAS. 2005;102:11864–11869. doi: 10.1073/pnas.0500329102. [DOI] [PMC free article] [PubMed] [Google Scholar]
- 5.Bergen A, Yang X, Bai Y, Beerman M, Goldstein A, Goldin L. Genomic regions linked to alcohol consumption in the Framingham Heart Study. BMC Genetics. 2003;4:S101. doi: 10.1186/1471-2156-4-S1-S101. [DOI] [PMC free article] [PubMed] [Google Scholar]
- 6.Gelernter J, Liu X, Hesselbrock V, Page GP, Goddard A, Zhang H. Results of a genomewide linkage scan: Support for chromosomes 9 and 11 loci increasing risk for cigarette smoking. Amer J Med Genet Part B: Neuropsychiatric Genet. 2004;128B:94–101. doi: 10.1002/ajmg.b.30019. [DOI] [PubMed] [Google Scholar]
- 7.Long JC, Knowler WC, Hanson RL, Robin RW, Urbanek M, Moore E, Bennett PH, Goldman D. Evidence for genetic linkage to alcohol dependence on chromosomes 4 and 11 from an autosome-wide scan in an American Indian population. Amer J Med Genet. 1998;81:216–221. doi: 10.1002/(sici)1096-8628(19980508)81:3<216::aid-ajmg2>3.0.co;2-u. [DOI] [PubMed] [Google Scholar]
- 8.Uhl GR, Liu QR, Walther D, Hess J, Naiman D. Polysubstance abuse-vulnerability genes: genome scans for association, using 1,004 subjects and 1,494 single-nucleotide polymorphisms. Am J Hum Genet. 2001;69:1290–1300. doi: 10.1086/324467. [DOI] [PMC free article] [PubMed] [Google Scholar]
- 9.Ma J, Zhang D, Dupont R, Dockter M, Elston R, Li M. Mapping susceptibility loci for alcohol consumption using number of grams of alcohol consumed per day as a phenotype measure. BMC Genetics. 2003;4:S104. doi: 10.1186/1471-2156-4-S1-S104. [DOI] [PMC free article] [PubMed] [Google Scholar]
- 10.Greene LA, Kaplan DR. Early events in neurotrophin signalling via Trk and p75 receptors. Curr Opin Neurobiol. 1995;5:579–587. doi: 10.1016/0959-4388(95)80062-x. [DOI] [PubMed] [Google Scholar]
- 11.Saarelainen T, Vaittinen S, Castren E. TrkB-receptor activation contributes to the kainate-induced increase in BDNF mRNA synthesis. Cell Mol Neurobiol. 2001;21:429–435. doi: 10.1023/A:1012775808253. [DOI] [PMC free article] [PubMed] [Google Scholar]
- 12.Stoilov P, Castren E, Stamm S. Analysis of the human TrkB gene genomic organization reveals novel TrkB isoforms, unusual gene length, and splicing mechanism. Biochem Biophys Res Commun. 2002;290:1054–1065. doi: 10.1006/bbrc.2001.6301. [DOI] [PubMed] [Google Scholar]
- 13.Eide FF, Vining ER, Eide BL, Zang K, Wang X-Y, Reichardt LF. Naturally occurring truncated TrkB receptors have dominant inhibitory effects on brain-derived neurotrophic factor signaling. J Neurosci. 1996;16:3123–3129. doi: 10.1523/JNEUROSCI.16-10-03123.1996. [DOI] [PMC free article] [PubMed] [Google Scholar]
- 14.Haapasalo A, Koponen E, Hoppe E, Wong G, Castren E. Truncated trkB.T1 is dominant negative inhibitor of trkB.TK+-mediated cell survival. Biochem Biophys Res Commun. 2001;280:1352–1358. doi: 10.1006/bbrc.2001.4296. [DOI] [PubMed] [Google Scholar]
- 15.Hartmann M, Brigadski T, Erdmann KS, Holtmann B, Sendtner M, Narz F, Lessmann V. Truncated TrkB receptor-induced outgrowth of dendritic filopodia involves the p75 neurotrophin receptor. J Cell Sci. 2004;117:5803–5814. doi: 10.1242/jcs.01511. [DOI] [PubMed] [Google Scholar]
- 16.Ninkina NAJ, Fischer A, Pinon LF, Buchman VL, Davies AM. Expression and function of TrkB variants in developing sensory neurons. EMBO J. 1996;15:6385–6393. [PMC free article] [PubMed] [Google Scholar]
- 17.Baxter GT, Radeke MJ, Kuo RC, Makrides V, Hinkle B, Hoang R, Medina-Selby A, Coit D, Valenzuela P, Feinstein SC. Signal transduction mediated by the truncated TrkB receptor isoforms, trkB.T1 and trkB.T2. J Neurosci. 1997;17:2683–2690. doi: 10.1523/JNEUROSCI.17-08-02683.1997. [DOI] [PMC free article] [PubMed] [Google Scholar]
- 18.Steinbeck JAMA. Translational downregulation of the noncatalytic growth factor receptor TrkB.T1 by ischemic preconditioning of primary neurons. Gene Expr. 2005;12:99–106. doi: 10.3727/000000005783992142. [DOI] [PMC free article] [PubMed] [Google Scholar]
- 19.McGough NNH, He D-Y, Logrip ML, Jeanblanc J, Phamluong K, Luong K, Kharazia V, Janak PH, Ron D. RACK1 and brain-derived neurotrophic factor: a homeostatic pathway that regulates alcohol addiction. J Neurosci. 2004;24:10542–10552. doi: 10.1523/JNEUROSCI.3714-04.2004. [DOI] [PMC free article] [PubMed] [Google Scholar]
- 20.Berhow MT, Hiroi N, Nestler EJ. Regulation of ERK (Extracellular Signal Regulated Kinase), part of the neurotrophin signal transduction cascade, in the rat mesolimbic dopamine system by chronic exposure to morphine or cocaine. J Neurosci. 1996;16:4707–4715. doi: 10.1523/JNEUROSCI.16-15-04707.1996. [DOI] [PMC free article] [PubMed] [Google Scholar]
- 21.Dorsey SG, Bambrick LL, Balice-Gordon RJ, Krueger BK. Failure of brain-derived neurotrophic factor-dependent neuron survival in mouse Trisomy 16. J Neurosci. 2002;22:2571–2578. doi: 10.1523/JNEUROSCI.22-07-02571.2002. [DOI] [PMC free article] [PubMed] [Google Scholar]
- 22.The International HapMap Consortium. A haplotype map of the human genome. Nature. 2005;437:1299–1320. doi: 10.1038/nature04226. [DOI] [PMC free article] [PubMed] [Google Scholar]
- 23.Phillips MS, Lawrence R, Sachidanandam R, Morris AP, Balding DJ, Donaldson MA, Studebaker JF, Ankener WM, Alfisi SV, Kuo F-S, Camisa AL, Pazorov V, Scott KE, Carey BJ, Faith J, Katari G, Bhatti HA, Cyr JM, Derohannessian V, Elosua C, Forman AM, Grecco NM, Hock CR, Kuebler JM, Lathrop JA, Mockler MA, Nachtman EP, Restine SL, Varde SA, Hozza MJ, Gelfand CA, Broxholme J, Abecasis GR, Boyce-Jacino MT, Cardon LR. Chromosome-wide distribution of haplotype blocks and the role of recombination hot spots. Nature Genet. 2003;33:382–387. doi: 10.1038/ng1100. [DOI] [PubMed] [Google Scholar]
- 24.Nestler EJ. Is there a common molecular pathway for addiction? Nat Neurosci. 2005;8:1445–1449. doi: 10.1038/nn1578. [DOI] [PubMed] [Google Scholar]
- 25.Tapia-Arancibia L, Rage F, Givalois L, Dingeon P, Arancibia S, Beaugé F. Effects of alcohol on brain-derived neurotrophic factor mRNA expression in discrete regions of the rat hippocampus and hypothalamus. J Neurosci Res. 2001;63:200–208. doi: 10.1002/1097-4547(20010115)63:2<200::AID-JNR1012>3.0.CO;2-Q. [DOI] [PubMed] [Google Scholar]
- 26.Miller R, King MA, Heaton MB, Walker DW. The effects of chronic ethanol consumption on neurotrophins and their receptors in the rat hippocampus and basal forebrain. Brain Res. 2002;950:137–147. doi: 10.1016/s0006-8993(02)03014-7. [DOI] [PubMed] [Google Scholar]
- 27.Kernie SG, Liebl DJ, Parada LF. BDNF regulates eating behavior and locomotor activity in mice. EMBO J. 2000;19:1290–1300. doi: 10.1093/emboj/19.6.1290. [DOI] [PMC free article] [PubMed] [Google Scholar]
- 28.Ribases M, Gratacos M, Badia A, Jimenez L, Solano R, Vallejo J, Fernandez-Aranda F, Estivill X. Contribution of NTRK2 to the genetic susceptibility to anorexia nervosa, Harm avoidance and minimum body mass index. Mol Psychiatry. 2005;10:851–860. doi: 10.1038/sj.mp.4001670. [DOI] [PubMed] [Google Scholar]
- 29.Matsushita S, Kimura M, Miyakawa T, Yoshino A, Murayama M, Masaki T, Higuchi S. Association study of brain-derived neurotrophic factor gene polymorphism and alcoholism. Alcohol Clin Exp Res. 2004;28:1609–1612. doi: 10.1097/01.alc.0000145697.81741.d2. [DOI] [PubMed] [Google Scholar]
- 30.Tsai S-J, Liao D-L, Yu YW-Y, Chen T-J, Wu H-C, Lin C-H, Cheng C-Y, Hong C-J. A study of the association of (Val66Met) polymorphism in the brain-derived neurotrophic factor gene with alcohol dependence and extreme violence in Chinese males. Neurosci Lett. 2005;381:340–343. doi: 10.1016/j.neulet.2005.02.043. [DOI] [PubMed] [Google Scholar]
- 31.Rudolph JGWS, Sokolsky C, Bozak D, Mazzanti C, Lipsky RH, Goldman D. Determination of melting temperature for variant detection using dHPLC: a comparison between an empirical approach and DNA melting prediction software. Genet Test. 2002;6:169–176. doi: 10.1089/109065702761403324. [DOI] [PubMed] [Google Scholar]
- 32.Lappalainen J, Long JC, Eggert M, Ozaki N, Robin RW, Brown GL, Naukkarinen H, Virkkunen M, Linnoila M, Goldman D. Linkage of antisocial alcoholism to the serotonin 5-HT1B receptor gene in 2 populations. Arch Gen Psychiatry. 1998;55:989–994. doi: 10.1001/archpsyc.55.11.989. [DOI] [PubMed] [Google Scholar]
- 33.Spitzer RLWJ, Gibbon M, First MB. American Psychiatric Press; Washington, DC: 1990. Structured Clinical Interview for DSM-III-R–Non-patient Edition (SCID-NP, Version 1.0) [Google Scholar]
- 34.Cloninger C. Neurogenetic adaptive mechanisms in alcoholism. Science. 1987;236:410–416. doi: 10.1126/science.2882604. [DOI] [PubMed] [Google Scholar]
- 35.Barrett JC, Fry B, Maller J, Daly MJ. Haploview: analysis and visualization of LD and haplotype maps. Bioinformatics. 2005;21:263–265. doi: 10.1093/bioinformatics/bth457. [DOI] [PubMed] [Google Scholar]
- 36.Gabriel SB, Schaffner SF, Nguyen H, Moore JM, Roy J, Blumenstiel B, Higgins J, DeFelice M, Lochner A, Faggart M, Liu-Cordero SN, Rotimi C, Adeyemo A, Cooper R, Ward R, Lander ES, Daly MJ, Altshuler D. The Structure of haplotype blocks in the human genome. Science. 2002;296:2225–2229. doi: 10.1126/science.1069424. [DOI] [PubMed] [Google Scholar]
- 37.Stephens M, Smith NJ, Donnelly P. A new statistical method for haplotype reconstruction from population data. Am J Hum Genet. 2001;68:978–989. doi: 10.1086/319501. [DOI] [PMC free article] [PubMed] [Google Scholar]