

Abstract
In neurons, voltage-gated sodium channel β subunits regulate the expression levels, subcellular localization, and electrophysiological properties of sodium channel α subunits. However, the contribution of β subunits to sodium channel function in heart is poorly understood. We examined the role of β1 in cardiac excitability using Scn1b null mice. Compared to wildtype mice, electrocardiograms recorded from Scn1b null mice displayed longer RR intervals and extended QTc intervals, both before and after autonomic block. In acutely dissociated ventricular myocytes, loss of β1 expression resulted in a ~1.6-fold increase in both peak and persistent sodium current while channel gating and kinetics were unaffected. Nav1.5 expression increased in null myocytes ~1.3 fold. Action potential recordings in acutely dissociated ventricular myocytes showed slowed repolarization, supporting the extended QTc interval. Immunostaining of individual myocytes or ventricular sections revealed no discernable alterations in the localization of sodium channel α or β subunits, ankyrinB, ankyrinG, N-cadherin, or connexin-43. Together, these results suggest that β1 is critical for normal cardiac excitability and loss of β1 may be associated with a long QT phenotype.
Keywords: sodium channel, auxiliary subunit, mouse, ventricular myocyte, cell adhesion, QT-interval
Introduction
Voltage-gated sodium channels play critical roles in both the rising phase and the repolarization phase of the cardiac action potential [1, 2]. Mutations in SCN5A encoding Nav1.5, the major cardiac channel, result in Long QT and Brugada syndromes [1]. Sodium channels are heterotrimers, composed of a single, pore-forming α subunit and two β subunits [3]: a non-covalently linked subunit (β1 or β3) [4, 5] and a disulfide-linked subunit (β2 or β4) [6, 7]. β subunits are multi-functional molecules that regulate channel cell-surface expression levels and modulate channel function, affecting channel kinetics and voltage-dependence in vitro [8]. β subunits also function in vitro as homophilic and/or heterophilic cell adhesion molecules that recruit cytoskeletal ankyrin following homophilic cell adhesion [9–11].
While much is known about β1 function in vitro, its physiological roles in vivo are poorly understood. We showed previously, using Scn1b null mice, that β1 plays important roles in the regulation of neuronal excitability in vivo [12]. In the present study, we used Scn1b null mice to investigate the role of β1 in cardiac excitability. Although the cardiac action potential waveform is significantly different in mice compared to humans, the upstroke, reflecting inward current through sodium channels, as well as the molecular correlates of sodium and potassium channels underlying repolarization, are similar in both species [13]. Thus, gene-targeting strategies in mice can yield valuable insights into the understanding of the role of these channels in human heart and in human disease. Here we examined the cardiac electrophysiology of Scn1b null mice. Scn1b null cardiomyocytes showed no differences in the voltage-dependence of sodium channel gating or kinetics compared to wildtype littermate mice. In contrast, both INa and INaP densities increased approximately 50% in the null mutant. Scn5a mRNA and Nav1.5 protein expression increased 51% and 33%, respectively, in the null hearts, consistent with the observed increase in sodium current. Interestingly, [3H]-saxitoxin (STX) binding studies revealed a similar increase in expression levels of tetrodotoxin-sensitive (TTX-S) channels. Surface electrocardiograms (ECGs) showed prolonged QT and RR intervals for Scn1b null mice compared to wildtype, which persisted following block of autonomic innervation, suggesting that these effects are due to the absence of β1 in myocytes. Action potential repolarization was prolonged in Scn1b null ventricular myocytes, consistent with the prolonged QT phenotype. Localization of sodium channel α and β subunits, as well as localization of structural proteins such as ankyrin, cadherin, and connexin, within myocytes were unaffected by the null mutation. Together, these results demonstrate that β1 is critical for regulation of cardiac electrical excitability. In addition, this represents the first report of a sodium channel-dependent QT prolongation that does not result from altered channel kinetics or voltage-dependence.
MATERIALS AND METHODS
Scn1b null mice
Scn1b null and wildtype mice were generated from Scn1b heterozygotes as described [12]. All procedures were performed in accordance with University of Michigan guidelines for animal use and care. The current study was performed on congenic N10–N13 Scn1b null, wildtype, and heterozygous male mice on the C57BL/6 background.
Northern blot analysis
Brains and hearts were dissected from anesthetized adult Sprague-Dawley rats, P17-18 Scn1b wildtype mice, and P17-18 Scn1b null mice. Total RNA was prepared from each sample using Trizol reagent (Invitrogen, Carlsbad, CA), according to the manufacturer’s instructions. Northern blots were prepared and probed with a digoxigenin-labeled antisense Scn1b probe as previously described [12].
Myocyte isolation
Single ventricular myocytes were extracted from P17-19 Scn1b null and wildtype male mice as described [14, 15]. Minor modifications included addition of 0.33 mg/ml heparin to the anesthetic, 50 μM EGTA to solution A, and 25 mg/ml bovine serum albumin to solution C. Only rod-shaped, quiescent cells with smooth striations were selected for examination.
[3H]-STX binding analysis
Ventricular myocytes were isolated from P17 Scn1b null or wildtype male mice. [3H]-STX saturation binding analysis was performed on equal aliquots of homogenized cell protein as described [16]. [3H]-STX (28 Ci/mmol) was obtained from Amersham (Piscataway, NJ).
Quantitative RT-PCR
All instruments were sterilized at 200°C for 3–4 hours and treated with RNase Zap (Ambion, Austin, TX) to remove any residual RNases. Littermate sets consisting of Scn1b wildtype, heterozygous, and null mice were sacrificed at P14 by decapitation. The hearts were carefully dissected and flash frozen on dry ice/ethanol and stored at −80°C until use. Heart tissue was homogenized using a Tissue-Tearor homogenizer and RNA was isolated using the Qiagen RNeasy Mini Kit (Qiagen, Valencia, CA). RNA was stored at −80°C until use. cDNA was generated from previously collected RNA (1:100 dilution) using Invitrogen (Carlsbad, CA) Super Script III First Strand Synthesis System. The cDNA was then amplified using the Applied Biosystems (ABI, Foster City, CA) 7500 Real Time PCR System and the pre-designed assay available from ABI for mouse Scn5a as well as the internal standard 18s [17]. Fold expression was determined using relative quantification (2−ΔΔCt method, [18]) normalized to the mean ΔCt of the wildtypes on each plate and statistics were performed using single factor ANOVA and student’s t-tests, p ≤ 0.01 were considered significant.
Western blot
Heart membrane proteins were isolated using the protocol provided by Alomone Labs (Jerusalem, Israel) and total protein content was quantified using the Bradford assay. 30 μg of heart membrane protein were loaded per lane, separated by 4–20% SDS-PAGE gradient gel, transferred electrophoretically to PVDF-Plus Transfer Membranes, and blotted as described previously [19]. The Scn5a antibody was obtained from Alomone Labs and used at 1:200 dilution. The HRP-conjugated secondary goat anti-rabbit antibody was obtained from Santa Cruz Biotechnology, Inc. (Santa Cruz, CA, antibody # SC-2004) and used at 1:5000 dilution. Antibody detection was performed using Amersham (Piscataway, NJ) ECL Western Blotting Analysis System. Bands were quantified using SynGene (Frederick, MD) Gene Tools gel quantification system, corrected for background, and a paired t-test was performed using the one-tailed p-value to determine significance.
Antibodies
Antibodies were obtained from the following sources: anti-Nav1.5 (for immunocytochemistry), anti-β3, and anti-β4: Dr. W.A. Catterall, University of Washington [9, 20, 21]; anti-Scn5a (ASC-005, for Western blotting): Alomone Labs (Jerusalem, Israel); anti-Nav1.1 (K74/71) and anti-Nav1.6 (K87A/10): UC Davis/NINDS/NIMH Neuromab Facility; anti-Nav1.4: Dr. S. Kraner, University of Kentucky [22]; anti-connexin-43: Chemicon (Temecula, CA); anti-α-actinin: Sigma-Aldrich (St. Louis, MO); anti-N-cadherin: Santa Cruz Biotechnology Inc. (Santa Cruz, CA); Alexa-fluor (546 nm)-conjugated phalloidin and Alexa-fluor secondary antibody conjugates (488 nM and 544 nM): Molecular Probes (Eugene, OR); anti-ankyrinB: Zymed Laboratories Inc. (South San Francisco, CA); anti-ankyrinG: Dr. V. Bennett, Duke University [23]. Anti-β1ex was described previously [12].
Immunochemistry
P17 male mice were anesthetized and perfused and isolated hearts or individual myocytes were prepared for immunocytochemistry as described [11]. Anti-Nav1.5, anti-β3, anti-β4, anti-Nav1.6, anti-β1ex, anti-connexin-43, and anti-ankyrinB were applied at 1:100 dilution; anti-N-cadherin at 1:50; anti-Nav1.1 at 1:50; anti-α-actinin at 1:200; Alexa-fluor (546 nm)-conjugated phalloidin diluted 1:100. Secondary antibodies (Alexa-flour conjugates) were diluted 1:200. Sections were visualized with an Olympus (Center Valley, PA) FluoView 500 confocal laser scanning microscope in the Microscopy and Image Analysis Laboratory Core Facility (MIAL) at the University of Michigan.
Measurement of INa
Voltage-clamp recordings were performed at room temperature in the whole cell configuration using an Axopatch 200B amplifier and pClamp (versions 8.2 and 9.2, Axon Instruments, Foster City, CA) with 1.5–2.5 MΩ patch pipettes. Solutions were prepared as described [20], including 5 mM extracellular NaCl adjusted to pH 7.4 with CsOH. Series resistance was compensated 40–65% and leak subtraction performed by application of a standard P/4 protocol. Holding potential was −100 mV. Activation curves were determined via application of 190 ms pulses from −80 to +35 mV in 5 mV increments. Inactivation curves were generated via application of a 100 ms conditioning pulse from −120 to 0 mV in 5 mV increments followed by a 7.5 ms test pulse to 0 mV. Normalized conductance and inactivation curves were generated as described previously [16]. τfast and τslow were determined by fitting the decay phase of currents with the sum of two exponentials. To determine τrec, Nav1s were inactivated with a 5 ms pulse to 0 mV, followed by a recovery pulse of variable duration to −100 mV, a subsequent test pulse to 0 mV to determine the fraction of recovered channels, and the resultant data fit with a single exponential. INaP amplitude was calculated from the average current amplitude 50–100 ms after the start of the test pulse. Current densities were determined by dividing current amplitude by the cell capacitance (Cm), as determined by application of +10 mV depolarizing test pulses.
Action potential measurements
Acutely isolated left ventricular myocytes were bathed at room temperature in 1x HBSS supplemented with 20 mM HEPES, pH 7.3. Patch pipettes (1.0–3.0 MΩ) were filled with (in mM): 135 KCl, 10 NaCl, 1 CaCl2, 10 EGTA and 10 HEPES, pH 7.4 with KOH. The resting potential (Rp) was determined under current clamp at zero current. The stimulus to elicit an action potential (threshold current) was determined by application of 3 ms test pulses every 2.5 s, starting at 0.2 nA and increasing by 0.05 nA until an action potential was observed. Subsequent action potentials were evoked by application of 12 × 3 ms test pulses at 1.5x threshold. Myocytes were paced at cycle lengths (CLs) of 150, 300, or 1000 ms, data filtered at 5 kHz and sampled at 20 kHz. Action potential amplitudes were measured from Rp to the peak. Action potential durations (APDs) were measured from the start of the stimulatory pulse to 25, 50, 75, and 90% decay of the peak to Rp (APD25, APD50, APD75, or APD90, respectively). Finally, the maximum rates of depolarization and repolarization were measured from the differentiated waveform. Comparison of APDs between wild type and Scn1b null myocytes was carried out using two-way ANOVA (GraphPad Prism 3.0, GraphPad Software Inc., USA.
ECG recording
Standard 3-lead surface ECGs of P17 Scn1b null, heterozygous, and wildtype male mice were recorded as described [15]. Acquisition was performed 8–10 min following anesthesia and data collected for 8 consecutive min at a sampling rate of 5 kHz using a DP304 differential amplifier (Warner Instruments Corp., Hamden, CT). To examine the effects of autonomic block on the ECG, each mouse was subsequently injected (10 μl/g i.p.) with propranolol and atropine (20 mg/kg and 1 mg/kg, respectively) in 0.9% saline. ECGs were then immediately recorded for 15 uninterrupted min. Lead 2 data were analyzed by two independent investigators using two different approaches. The first investigator (Investigator 1) calculated parameters for each individual animal from averages of 20–40 consecutive traces using homemade software (Delphi 5, Borland Int.) [15]. Data were then combined from the averaged measurements for each individual mouse to yield an averaged value for each genotype. QT intervals were calculated for each animal by measuring the interval to the T wave peak (QTPEAK) and to 90% of T wave decay (QT90) to baseline. QTPEAK and QT90 values for each mouse represented averaged measurements from 20–40 consecutive traces. QTPEAK and QT90 values for each genotype represented averaged values from all mice of the corresponding genotype. To correct for the effect of heart rate on QT90 intervals, a heart-rate corrected QT90 (QT90C) was generated, as described previously [24]. Briefly, RR and QT90 intervals for each mouse (where RR and QT90 measurements for each individual mouse each represent the average of measurements from 20–40 consecutive traces) were plotted in the form of (ln(RR/100) vs. ln(QT90). The resultant data from all mice of a given genotype were then subjected to a linear fit where QT90c was calculated as the intercept of the linear fit of the data with the y axis. To confirm the results of the first analysis, a second investigator (Investigator 2) analyzed a minimum of 150 individual cycles within an observation period of 2 min, using EMKA-software (Emka Technologies, Paris, France). The value of each ECG parameter of each single cycle was assessed and data averaged.
RESULTS
Molecular characterization of Scn1b null mice
We showed previously that Scn1b null mice lack Scn1b mRNA in brain [12]. Fig. 1 demonstrates the complete absence of Scn1b mRNA in heart as well as brain in these mice. Consistent with previous work [25], mice have lower levels of Scn1b mRNA in heart compared to brain, and this difference in transcript levels is species-specific, as levels of Scn1b mRNA in rat brain and rat heart are similar.
Fig. 1. Northern blot analysis of Scn1b null brain and heart.
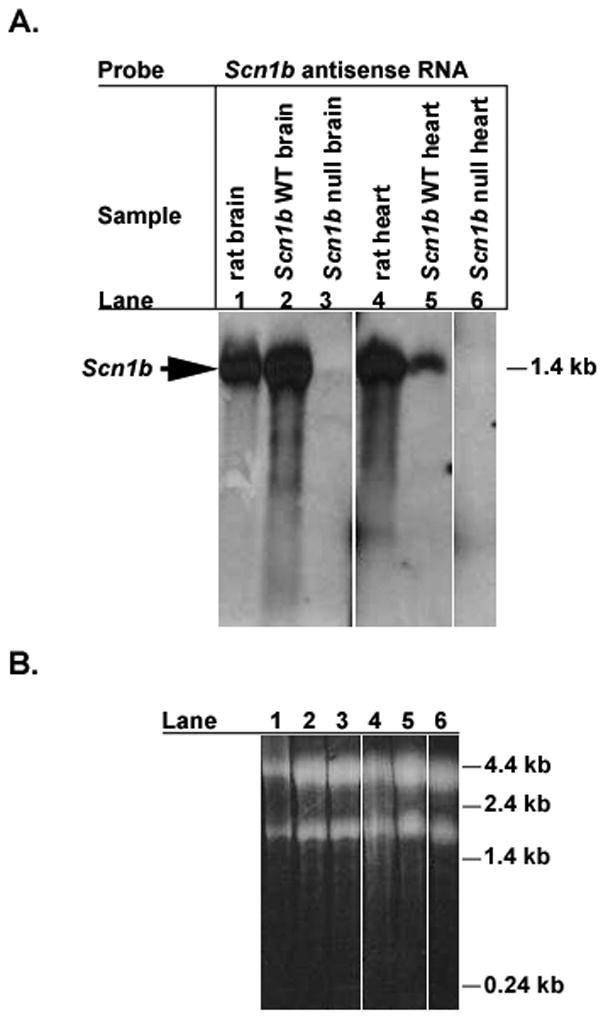
Total RNA was isolated from adult rat brain, adult rat heart, P17-18 Scn1b wildtype brain, P17-18 Scn1b wildtype heart, P17-18 Scn1b null brain, and P17-18 Scn1b null heart, as indicated in panel A. Equal aliquots of RNA (10 μg for brain samples, lanes 1–3; 20 μg for heart samples, lanes 4–6) were separated on agarose-formaldehyde gels and probed with a digoxigenin-labeled antisense Scn1b mRNA probe. A. Northern blot. Arrow indicates position of ~1.4 kilobase band corresponding to Scn1b. B. Ethidium bromide stained gel prior to transfer of RNA, showing approximately equal loading of RNA samples. 18S and 28S ribosomal RNAs are stained.
Loss of β1 does not alter sodium channel voltage-dependence or kinetics
Consistent with previous studies of Scn1b null hippocampal and cerebellar Purkinje neurons [12, 26], no significant differences were detected in the voltage-dependence of sodium channel activation or inactivation (Fig. 2B), time-course of inactivation (Fig. 2C, Table 1), or recovery from inactivation (Fig. 2D) in Scn1b null myocytes. In contrast, a ~1.6-fold increase in both INa (Fig. 2A and 3A) and INaP (Fig. 3B) densities was observed for myocytes from null mice compared to wildtype. While we were not able to measure consistent differences in the TTX-S component of INa due to technical issues with current stability over long experiments, [3H]-STX binding revealed a proportionally similar increase (~1.9-fold) in homogenates of ventricular myocytes, suggesting that at least a portion of this effect may be attributable to increased TTX-S channel expression (Fig. 3C). It has been shown previously that the proportion of TTX-S INa in mouse ventricular myocytes is very small and detectable only after activation with β-scorpion toxin [20], likely explaining our inability to reliably measure these currents.
Fig. 2. Comparison of INa recorded from Scn1b wildtype and null ventricular myocytes.

A. Representative INa densities recorded fromScn1b wildtype and null myocytes. Test pulses from −80 to +20 mV, with step of 5 mV. Scale bar: 15 pA/pF and 10 ms.
B. Mean activation (filled symbols) and inactivation (open symbols) curves for INa from Scn1b wildtype mice (circles; Activation: V½ = −30.51 ± 0.6 mV, k = −5.17 ± 0.31 mV, n = 13 cells from 9 mice; Inactivation: V½ = −52.14 ± 0.59, k = 7.07 ± 0.15, n = 12 cells from 9 mice) and Scn1b null mice (triangles; Activation: V½ = −29.70 ± 1.0 mV, k = −5.00 ± 0.77 mV, n = 17 cells from 12 mice; Inactivation: V½ = −52.12 ± 0.82, k = 7.02 ± 0.16, n = 15 cells from 11 mice). Smooth lines were generated by the Boltzmann equation using mean values for V½ and k determined from fits of individual experiments.
C. Current inactivation kinetics as a function of voltage. Mean fast (τfast, open symbols) and slow (τslow closed symbols) time constants of inactivation.
D. Recovery from inactivation. Smooth lines represent a single exponential generated from the mean τrec values determined from fits of individual experiments. For Scn1b wildtype, τrec = 6.14 ± 0.57 ms, n = 8 cells from 5 mice. For Scn1b null τrec = 6.52 ± 0.60 ms, n = 5 cells from 5 mice. For B–D, data from Scn1b wildtype and null mice are represented by circles and triangles, respectively. Inactivation kinetics are summarized in Table 1. *p ≤ 0.05 from Student’s t-test. For this and subsequent figures, error bars show SEM.
Table 1.
INa inactivation kinetics in myocytes as a function of voltage.
| Scn1b null, n= 15 (12) | Scn1b wildtype, n= 12 (9) | |||||||
|---|---|---|---|---|---|---|---|---|
| τslow (ms) | τfast (ms) | A1 | A2 | V-test (mV) | τslow (ms) | τfast (ms) | A1 | A2 |
| 25.2±4.3 | 0.7±0.04* | 0.04±0.01 | 0.96±0.01 | +10 | 22.6±2.6 | 0.8±0.04 | 0.04±0.01 | 0.96±0.01 |
| 17.1±2.0 | 0.9±0.05 | 0.04±0.01 | 0.96±0.01 | +0 | 16.7±2.5 | 1.0±0.05 | 0.05±0.01 | 0.95±0.01 |
| 13.5±1.2 | 1.2±0.06 | 0.06±0.01 | 0.94±0.01 | −10 | 11.7±1.2 | 1.3±0.07 | 0.08±0.01 | 0.92±0.01 |
| 11.9±0.9 | 1.8±0.10 | 0.12±0.01 | 0.88±0.01 | −20 | 10.2±0.7 | 1.7±0.1 | 0.12±0.01 | 0.88±0.01 |
| 15.7±1.4 | 3.1±0.34 | 0.17±0.01 | 0.83±0.01 | −30 | 15.7±0.6 | 2.7±0.18 | 0.15±0.01 | 0.85±0.01 |
τfast and τslow represent the fast and slow components of the current inactivation time-course, respectively (Fig. 1C); A1 and A2 represent their relative amplitudes as measured at different test potentials (V-test).
p ≤ 0.05.
Fig. 3. Loss of β1 results in increased INa and INaP densities, increased 3H-STX binding, and increased Scn5a expression.

A. Average peak INa from ventricular myocytes. Scn1b wildtype (WT) = −33.9 ± 3.2 pA/pF; Scn1b null = −53.6 ± 6.6 pA/pF. Inset for panel A, typical INa traces (test pulse to −20 mV) corrected for cell capacitance recorded from Scn1b null myocytes (left) and Scn1b wildtype myocytes (right). Scale bar: 10 pA/pF and 2.5 ms.
B. INaP from ventricular myocytes. Scn1b wildtype = −0.29 ± 0.04 pA/pF; Scn1b null = −0.46 ± 0.05* pA/pF. Membrane capacitance: Scn1b wildtype = 74.2 ± 5.0 pF, Scn1b null = 52.9 ± 4.1* pF. For Scn1b wildtype n = 13 cells from 9 mice. For Scn1b null n = 17 cells from 12 mice. Inset for panel B, zoomed image of the traces shown in the inset to panel A, showing the current from 50–100 ms following the depolarizing pulse. Solid lines represent averaged amplitudes for this time segment, similar to the analysis performed in B. Scale bar: 0.5 pA/pF and 5 ms.
C. Specific [3H]-STX binding (Scn1b wildtype: 18.9 ± 4.2 fmol/mg protein, n = 3; Scn1b null: 35.3 ± 4.4* fmol/mg protein, n = 3) in homogenized ventricular myocytes. *p ≤ 0.05 for Scn1b wildtype vs. Scn1b null.
D. Upper panel: Scn5a mRNA expression levels in Scn1b heterozygous (+/−, n = 6) and null (−/−, n = 7) heart tissue compared to wildtype (+/+) littermates (normalized to 1, n =7) using the ΔΔCt method to determine fold expression levels and Single Factor ANOVA to determine significance. Scn5a expression is 151% of wildtype in Scn1b null (*p = 0.002) and ~100% in Scn1b heterozygous mice. Lower panel: Western blots of heart membranes prepared from 3 sets of Scn1b wildtype (+/+) and Scn1b null (−/−) littermate pairs showing an increase in Nav1.5 protein in Scn1b null heart (133% of wildtype, p = 0.03). Each lane represents protein from one mouse.
Increased Scn5a mRNA and Nav1.5 in Scn1b null heart tissue
Quantitative RT-PCR in 6 P14 littermate sets (Scn1b wildtype, heterozygous, and null mice) revealed no significant change in Scn5a mRNA expression in heterozygous hearts compared to wildtype. However, a significant increase in Scn5a mRNA expression was observed in Scn1b null hearts compared to wildtype (~1.5 fold, p = 0.002) (Fig. 3D, upper panel). Western blot analysis of heart membrane protein isolated from 3 P14 littermate pairs revealed an increase in Nav1.5 protein in Scn1b null hearts relative to wildtype that was similar to the observed increases in INa and INaP (~1.3 fold, p = 0.03) (Fig. 3D, lower panel). Protein size, as well as splicing assay (RT-PCR) data (not shown), were consistent with the full length, functional splice form of Scn5a previously identified [27]. In similar Western blot experiments, we observed no differences in the expression levels of β2, β3, or β4 in Scn1b null hearts compared to wildtype, indicating that these other sodium channel β subunit proteins did not compensate for the loss of β1 (data not shown).
Surface ECG recordings
ECGs of anesthetized P17-18 male mice were examined. QT intervals were measured to the T wave peak (QTPEAK) and to 90% of T decay (QT90). Scn1b null mice displayed ECGs with prolonged QTPEAK (by ~3 ms, p ≤ 0.001) and QT90 intervals (by ~5 ms, p ≤ 0.001, Table 2) compared to wildtype mice. The RR interval for Scn1b null mice was also longer (by ~20 ms, p = 0.02), indicating a slower heart rate. ECG parameters of Scn1b heterozygous mice were statistically indistinguishable from those of wildtype. Since the longer QT90 interval of Scn1b null mice could reflect alterations in heart rate, a heart-rate corrected QT90 (QT90C) was generated as described [24] (Table 2). As with QT90, QT90C intervals were longer (~1.5-fold) in null mice, indicating that differences in heart rate were not responsible for the prolonged QT interval. No significant differences were observed in other ECG parameters between Scn1b null and wildtype mice.
Table 2.
ECG characteristics of Scn1b wildtype, null, and heterozygous mice.
| CONTROL | |||||||||
|---|---|---|---|---|---|---|---|---|---|
| n | P duration (ms) | QRS (ms) | PR (ms) | QTPeak (ms) | QT90 (ms) | RR (ms) | R-amp (mV) | QT90C (ms) | |
| WT | 27 | 10.61±0.33 | 8.62± 0.32 | 46.60±1.58 | 17.41±0.61 | 27.23±0.96 | 162.1±5.5 | 1.49±0.07 | 19.3±0.07 |
| Null | 29 | 10.39±0.32 | 8.98± 0.29 | 49.18±1.57† | 20.87±0.58* | 32.42±0.99* | 181.8±5.7* | 1.46±0.07 | 33.12±0.10 |
| Het | 48 | 10.00±0.32 | 8.67± 0.22 | 46.22±0.96 | 17.66±0.41 | 27.57±0.63 | 163.3±3.2 | 1.58±0.05 | 22.2±0.08 |
| PROPRANOLOL & ATROPINE | |||||||||
| n | P duration (ms) | QRS (ms) | PR (ms) | QTPeak (ms) | QT90 (ms) | RR (ms) | R-amp (mV) | QT90C (ms) | |
| WT | 8 | 11.81±0.5§ | 10.20±0.8¢ | 48.51±2. 5 | 20.24±1.3¢ | 28.66±1.3 | 174.2±6.8 | 1.37±0.07 | 16.61±0.1 |
| Null | 10 | 11.34±0.6¢ | 9.58±0.5¢ | 47.57±1.4 | 23.91±0.9¢* | 35.41±1.0* | 205.5±4.7§* | 1.30±0.08 | 43.82±0.3 |
| Het | 13 | 11.64±0.3§ | 10.74±0.6¢ | 45.94±1.5 | 20.38±0.6¢ | 28.92±0.9 | 171.9±7.4 | 1.33±0.08 | 23.34±0.1 |
ECG data are tabulated before (control) and after autonomic block. P represents the duration of the P wave, while QTPEAK represents the interval from the onset of the Q wave to the peak of the T wave. QT90 is the time duration from Q to 90% decay of the T wave from peak to baseline. QT90C represents the QT90 duration corrected for heart rate [24]. R-amp denotes the amplitude of the R wave. Data were analyzed as described in Methods (Investigator 1).
p ≤ 0.05 for Scn1b null (Null) vs. both Scn1b wildtype (WT) and Scn1b heterozygous (Het) mice, with p > 0.1 for WT vs. Het.
p ≤ 0.1 for Null vs. Het only, with p > 0.1 for both Null vs. WT, and WT vs. Het.
p ≤ 0.05
p ≤ 0.1 for control vs. propranolol and atropine recordings.
Similar results (not shown) were observed using an alternative analysis protocol (Methods, Investigator 2), which also included measurements of (control) heart rate corrected Q to end of T interval (QT100c); Scn1b wildtype = 50.40 ± 0.17 ms n = 26, Scn1b null =79.04 ± 0.19 ms n = 30, Scn1b heterozygous = 44.93 ± 0.23 ms n = 41.
In view of the neurological effects resulting from the loss of β1 expression [12], it was possible that the altered ECG waveform of Scn1b null mice resulted from impaired cardiac innervation. To examine this, ECGs were recorded following administration of propranolol and atropine to block β-adrenergic and muscarinic receptors, respectively [28]. Following autonomic block, the R wave amplitude and P, QRS, and PR durations remained similar between mice of all three genotypes (Table 2), although compared to control recordings the administration of propranolol and atropine resulted in longer P (by ~1 ms) and QRS (~ 0.5–2 ms) components (Table 2). Compared to control recordings, QTPeak, was also lengthened (~3 ms) but not QT90 however, following autonomic block both QT intervals remained longer for β1−/− mice compared to those of wildtype and heterozygous animals. The RR interval for Scn1b null mice was also longer than control animals and remained significantly longer than those of wildtype and heterozygous mice following block. Furthermore, the difference in QT90C for Scn1b null mice compared to wildtype or heterozygous animals (>10 ms longer under control conditions) was even more pronounced following autonomic block (>20 ms longer).
Loss of β1 results in prolongation of action potential repolarization
Action potentials were compared between Scn1b null and wildtype left ventricular myocytes. No differences were observed in resting membrane potentials (Scn1b null: −80.1 ± 0.9 mV vs. Scn1b wildtype: −80.5 ± 0.5 mV, n =15 for each genotype, p = 0.77), or in the current necessary to elicit an action potential (Scn1b null: 0.53 ± 0.04 nA vs. Scn1b wildtype: 0.62 ± 0.04 nA, n = 15 for each genotype, p = 0.15). To mimic physiological heart rates, stimulus pulses were initially applied every 100 ms. Under these conditions, and for both genotypes, action potentials exhibited dramatic lengthening in duration such that it was not possible to measure APDs of later action potentials (not shown). We found, however, that the use of longer CLs made this analysis possible, as demonstrated below.
Action potentials were elicited by applying test pulses every 150 ms (6.7 Hz), intervals similar to the average RR intervals of anesthetized wildtype mice (Table 2). Repeated stimulation resulted in AP lengthening for successive action potentials for both genotypes, but APs were significantly longer in Scn1b null myocytes (Fig. 4). In particular, in Scn1b null cells APD75 was ~ 20 ms larger at any given AP number (p < 0.0001 using two-way ANOVA). APD25, APD50 and APD90 were also significantly prolonged in Scn1b null cells (p < 0.05, data not shown). In contrast, action potential amplitudes were similar between both sets of myocytes: Scn1b wildtype: 128.9 ± 1.9, Scn1b null: 128.5 ± 0.9 mV (p=0.84).
Fig. 4. Action potentials are prolonged in Scn1b null myocytes.

APD75 values were measured in isolated Scn1b wildtype (n=14) and null (n=15) ventricular myocytes in response to stimulation at a cycle length of 150 ms. Solid lines are linear fits to the data. Analysis of the data using two-way ANOVA shows a significant (p < 0.0001) increase in APD75 in Scn1b null myocytes.
We next analyzed the rate of change in membrane potential (Vm), calculated as the first derivative of Vm, dVm/dt (Fig. 5A). We observed a small but significant 13% reduction in the time required to reach the maximum rate of depolarization in the null myocytes. Scn1b null myocytes reached the maximum rate of depolarization rate earlier than Scn1b wildtype cells (p=0.0021 for CL150, Fig. 5B). We also observed a 25–30% reduction in the maximum rate of repolarization in Scn1b null myocytes compared to wildtype for CL150 and CL300 (Fig. 5C, p < 0.05). (Differences observed for CL1000 were not significant and are not shown). We propose that the observed increase in INaP recorded in Scn1b null myocytes is responsible for this prolongation of ventricular repolarization.
Fig. 5. Analysis of the rate of change in Vm for AP recordings.

A. Details of an averaged trace of the first AP (150 ms CL), top panel; and the corresponding dVm/dt, bottom panel. The arrow indicates the starting point of the stimulation pulse. Vertical solid line indicates the maximal depolarizing rate and dotted line indicates the maximal repolarizing rate. Scale bars: 1.5 ms and 20 mV/ms.
B. Maximum upstroke rate for the first action potential in each train for CL150 recorded from Scn1b wildtype (WT, black) or Scn1b null (Null, gray) myocytes. Analysis of the data using two-way ANOVA shows a significant (p=0.0021) decrease for Scn1b null myocytes.
C. Maximum repolarization rate recorded from Scn1b wildtype (WT, black) or Scn1b null (Null, gray) myocytes for CL150 (circles) or CL300 (squares). *p < 0.05 or #p < 0.10 for Scn1b wildtype vs. Scn1b null mice.
Localization of sodium channel α and β subunits
Sodium channel expression is altered in Scn1b null hippocampus [12]. Thus, we predicted that loss of β1 in heart might similarly perturb sodium channel expression. To test our hypothesis, we examined the localization of sodium channel subunits in acutely dissociated cardiomyocytes and in ventricular slices obtained from Scn1b null and Scn1b wildtype mice. In ventricular sections obtained from male Scn1b null and wildtype mice, α-actinin (Fig. 6A, 6B), ankyrinB (Fig. 7A), and phalloidin (Fig. 6E, 6F) localized to the Z-line/t-tubules while ankyrinG (Fig. 7B), N-cadherin (Fig. 7C), and connexin-43 (Fig. 7C, 6I, 6J) were localized to the intercalated disks, consistent with previous studies [11, 23, 29]. We found similar results in studies on acutely dissociated ventricular myocytes performed in parallel (not shown).
Fig. 6. Loss of β1 does not affect the localization of sodium channels or structural proteins.

A, C, E, G, and I sections from Scn1b wildtype hearts. B, D, F, H, and J sections from Scn1b null hearts.
A and B, Nav1.1 (green) co-localizes with α-actinin (red) at the Z-line/t-tubules in heart sections. Scale bar 50 μm.
C and D, co-localization of Nav1.5 (green) with connexin-43 (Cx-43) (red) at intercalated disks (examples are shown at arrows). Scale bar 50 μm.
E and F, Nav1.6 (green) and phalloidin (red) co-localize at Z-line/t-tubules. Scale bar 20 μm.
G and H, co-localization of β3 (green) and phalloidin (red). Scale bar 20 μm.
I and J, β4 (green) co-localizes with connexin-43 (Cx-43) (red). Scale bar 20 μm.
Fig. 7. Localization of ankyrinB, ankyrinG, connexin-43, and N-cadherin in Scn1b null cardiac myocytes.

A. Co-localization of ankyrinB (green) with phalloidin (red). Scale bar 100 μm.
B. Co-localization of ankyrinG (green) with connexin-43 (Cx-43) (red). Scale bar 20 μm.
C. Co-localization of connexin-43 (Cx-43, green) with N-cadherin (red). Scale bar 20 μm.
In ventricular sections (Fig. 6) and in acutely dissociated myocytes (not shown) obtained from both genotypes, Nav1.1 (Fig. 6A, 6B) and Nav1.6 (Fig. 6E, 6F) were detected at Z-lines/t-tubules, consistent with previous reports [20, 29]. Prominent clustering of Nav1.5 was detected at intercalated disks as well as at the cell surface (Fig. 6C, 6D), consistent with previous observations [20, 21, 29, 30]. No changes in Nav1.5 localization were observed in spite of increased protein expression (Fig. 3). We also examined the localization of β3 and β4 (sufficient anti-β2 was not available for this study). In agreement with previous reports, β3 (Fig. 6G, 6H) and β4 (Fig. 6I, 6J) remained localized at Z-lines/t-tubules and intercalated disks, respectively [21].
Body to heart weight ratio
Scn1b null mice are smaller than age-matched, wildtype littermates, with an average body weight at P17 of 4.79 ± 0.06 g (n = 48) vs. 6.51 ± 0.18 g for Scn1b wildtype mice (n = 34, p < 0.001). We compared the relative ratios of total body weight to heart weight for our two sets of animals. Scn1b wildtype mice showed an average heart weight of 48.3 ± 1.6 mg, with a resultant average ratio of 136 ± 2.3. In contrast, Scn1b null mice displayed an average heart weight of 32.8 ± 0.8 mg (p < 0.001) and an average ratio of 147 ± 2.7 (p < 0.003), suggesting that the Scn1b null mutation may affect heart development, possibly through modulation of electrical excitability and/or through modulation of cell adhesion.
DISCUSSION
To investigate the role of sodium channel β1 subunits in cardiac electrophysiology, surface ECGs, whole cell INa, action potentials, RT-PCR, Western blot analyses, [3H]-STX binding, and channel subunit subcellular localization were compared between Scn1b null and wildtype mice. Although channel kinetics and voltage-dependence were unaffected, loss of β1 resulted in increases in both INa and INaP densities that were supported by similar increases in Nav1.5 expression and [3H]-STX binding. ECGs of Scn1b null mice showed significantly lengthened QT and RR intervals that remained following block of autonomic innervation. Action potential duration was significantly longer in Scn1b null ventricular myocytes and the rate of action potential repolarization was significantly slowed in Scn1b null ventricular myocytes compared to wildtype, consistent with the prolonged QT interval. We propose that increases in INaP underlie in part the observed changes in action potential repolarization in Scn1b null myocytes and that the combination of increased depolarizing INa and increased INaP are responsible in part for QT prolongation [1], although it is possible that the Scn1b null mutation also affects potassium currents, as discussed below. This is the first report of a long QT phenotype involving sodium channels that does not appear to result from changes in Nav1.5 kinetics or voltage-dependence. Alternatively, or in addition, potassium current may play a functional role, as changes in potassium channel availability can dramatically alter the cardiac action potential [31]. Intriguingly, studies using heterologous expression systems have suggested that β1 may associate with and modulate, Kv4.3, which contributes to transient outward current (Ito) in human and mouse ventricle [32, 33]. This interesting possibility will be the focus of future studies.
Coexpression of β1 with TTX-S sodium channel α subunits in heterologous systems in vitro results in increased INa, increased rates of channel activation and inactivation, and shifts in the voltage-dependence of activation and inactivation [4, 34]. Interestingly, results from acutely isolated Scn1b null hippocampal and cerebellar neurons, which express primarily TTX-S channels, showed none of these effects [12, 26], suggesting that the physiological roles of β1 may be cell type specific and, importantly, that heterologous expression systems cannot mimic the situation in neurons. Previous studies describing the effects of β1 on TTX-R Nav1.5 in vitro have yielded variable results, depending on the heterologous expression system utilized. In contrast to TTX-S channels, expression of Nav1.5 in oocytes generates INa that inactivates rapidly in the absence of β subunits [35]. According to some reports, β1 has no observable effect on Nav1.5 function [36, 37]. Other groups have reported that coexpression of β1 and Nav1.5 results in increased INa density with no detectable effects on gating [35, 38]. Some groups have reported modulation of channel sensitivity to lidocaine block with subtle changes in gating properties in response to β1 expression [39], while others have reported significant shifts in the voltage-dependence of steady-state inactivation [29, 40] or the rate of recovery from inactivation [41]. The most interesting result of heterologous expression studies in terms of the present data is the finding that β1 coexpression decreases INaP in HEK cells [42], implying that the loss of β1 expression increases INaP, consistent with our in vivo results. While HEK cells do not accurately mimic the situation in cardiac myocytes, it is interesting to consider the suggestion from these authors that down-regulation of β1 or disruption of α-β1 interactions might contribute to a prolonged QT phenotype. Indeed, the SCN5A D1790G long QT mutation disrupts the ability of Nav1.5 to be modulated by β1 [40]. Cytoskeletal disruption in cardiac myocytes induces sodium channels to exhibit increased INaP [43]. This is also consistent with deletion of β1, a cell adhesion molecule that links sodium channels to the cytoskeleton via ankyrin [9].
Scn1b null mice exhibit significantly prolonged RR intervals in addition to prolonged QT intervals. A group of SCN5A mutations that give rise to INaP not only underlie QT-prolongation, but also result in sinus bradycardia and sinus pauses and have been postulated to be a direct cause of sudden death in some patients [44, 45]. This group of mutations includes the LQT3 mutant, D1790G, which interrupts sodium channel α-β1 interactions [40]. Mutations in ankyrin-B cause a dominantly-associated cardiac syndrome that includes sick sinus syndrome, bradycardia, and risk of sudden cardiac death [46]. This syndrome, originally classified as LQT4, was later renamed, as prolonged QT intervals are not consistent features. Although as yet uninvestigated, it is likely that β1 subunits are expressed in sinoatrial node as well as in ventricle where they may regulate heart rate through INaP and channel-cytoskeletal interactions.
Multiple TTX-S sodium channels are expressed in heart [20, 29, 47]. Several lines of evidence have shown that TTX-S channels are localized at t-tubules in ventricular myocytes [21, 29] and in sinoatrial node [47, 48], although the physiological role of these channels is not well understood [20, 49]. We propose that at least a portion of the increased INaP observed in Scn1b null myocytes may be attributable to one or more TTX-S channels in addition to effects on TTX-R Nav1.5. This conclusion, which is supported by our [3H]-STX binding data, must be tempered by our inability to measure reliable differences in TTX-S INa in Scn1b null myocytes due to technical limitations. Nanomolar concentrations of TTX shorten the mammalian cardiac action potential, as first demonstrated by [50], suggesting that TTX-S channels can generate INaP. Until the contributions of TTX-S currents to the total INa in mouse ventricular myocytes can be resolved, however, the involvement of TTX-S sodium channels in increased INaP in Scn1b null myocytes remains unknown. Nevertheless, it is interesting to consider that the effects of β1 in vivo are cell type specific and may even be subcellular domain specific. Our results, combined with our previous report on Scn1b null mice [12], emphasize the importance of studying ion channels in their native environment.
Acknowledgments
This work was supported by AHA Established Investigator Award 0140133N to LLI, by R01MH059980 to LLI, by R01HL69052 to ANL, by R01NS29709 to JLN, and by the Deutsche Forschungsgemeinschaft to SKGM (Ma 2252). The authors gratefully acknowledge Dr. Penelope Boyden, Dr. Jeanne Nerbonne and Dr. William Brackenbury for many helpful discussions and Meredith McLerie, Emily Slat, and Travis Dickendesher for expert technical assistance.
Footnotes
Publisher's Disclaimer: This is a PDF file of an unedited manuscript that has been accepted for publication. As a service to our customers we are providing this early version of the manuscript. The manuscript will undergo copyediting, typesetting, and review of the resulting proof before it is published in its final citable form. Please note that during the production process errors may be discovered which could affect the content, and all legal disclaimers that apply to the journal pertain.
References
- 1.Tan HL, Bezzina CR, Smits JP, Verkerk AO, Wilde AA. Genetic control of sodium channel function. Cardiovasc Res. 2003 Mar 15;57(4):961–73. doi: 10.1016/s0008-6363(02)00714-9. [DOI] [PubMed] [Google Scholar]
- 2.Meadows LS, Isom LL. Sodium channels as macromolecular complexes: implications for inherited arrhythmia syndromes. Cardiovascular Research. 2005;67:448–58. doi: 10.1016/j.cardiores.2005.04.003. [DOI] [PubMed] [Google Scholar]
- 3.Hartshorne RP, Messner DJ, Coppersmith JC, Catterall WA. The saxitoxin receptor of the sodium channel from rat brain Evidence for two nonidentical beta subunits. JBiolChem. 1982;257:13888–91. [PubMed] [Google Scholar]
- 4.Isom LL, De Jongh KS, Patton DE, Reber BFX, Offord J, Charbonneau H, et al. Primary structure and functional expression of the β1 subunit of the rat brain sodium channel. Science. 1992;256:839–42. doi: 10.1126/science.1375395. [DOI] [PubMed] [Google Scholar]
- 5.Morgan K, Stevens EB, Shah B, Cox PJ, Dixon AK, Lee K, et al. β3: An additional auxiliary subunit of the voltage-sensitive sodium channel that modulates channel gating with distinct kinetics. Proc Natl Acad Sci USA. 2000;97:2308–13. doi: 10.1073/pnas.030362197. [DOI] [PMC free article] [PubMed] [Google Scholar]
- 6.Isom LL, Ragsdale DS, De Jongh KS, Westenbroek RE, Reber BF, Scheuer T, et al. Structure and function of the β2 subunit of brain sodium channels, a transmembrane glycoprotein with a CAM motif. Cell. 1995;83:433–42. doi: 10.1016/0092-8674(95)90121-3. [DOI] [PubMed] [Google Scholar]
- 7.Yu FH, Westenbroek RE, Silos-Santiago I, McCormick KA, Lawson D, Ge P, et al. Sodium channel beta4, a new disulfide-linked auxiliary subunit with similarity to beta2. J Neurosci. 2003 Aug 20;23(20):7577–85. doi: 10.1523/JNEUROSCI.23-20-07577.2003. [DOI] [PMC free article] [PubMed] [Google Scholar]
- 8.Isom LL. Sodium channel β subunits: anything but auxiliary. The Neuroscientist. 2001;7:42–54. doi: 10.1177/107385840100700108. [DOI] [PubMed] [Google Scholar]
- 9.Malhotra JD, Kazen-Gillespie K, Hortsch M, Isom LL. Sodium channel β subunits mediate homophilic cell adhesion and recruit ankyrin to points of cell-cell contact. J Biol Chem. 2000;275:11383–8. doi: 10.1074/jbc.275.15.11383. [DOI] [PubMed] [Google Scholar]
- 10.Malhotra JD, Koopmann MC, Kazen-Gillespie KA, Fettman N, Hortsch M, Isom LL. Structural requirements for interaction of sodium channel β1 subunits with ankyrin. J Biol Chem. 2002;277(29):26681–8. doi: 10.1074/jbc.M202354200. [DOI] [PubMed] [Google Scholar]
- 11.Malhotra JD, Thyagarajan V, Chen C, Isom LL. Tyrosine-phosphorylated and nonphosphorylated sodium channel beta1 subunits are differentially localized in cardiac myocytes. J Biol Chem. 2004 Sep 24;279(39):40748–54. doi: 10.1074/jbc.M407243200. [DOI] [PubMed] [Google Scholar]
- 12.Chen C, Westenbroek RE, Xu X, Edwards CA, Sorenson DR, Chen Y, et al. Mice lacking sodium channel beta1 subunits display defects in neuronal excitability, sodium channel expression, and nodal architecture. J Neurosci. 2004 Apr 21;24(16):4030–42. doi: 10.1523/JNEUROSCI.4139-03.2004. [DOI] [PMC free article] [PubMed] [Google Scholar]
- 13.Nerbonne JM. Studying cardiac arrhythmias in the mouse--a reasonable model for probing mechanisms? Trends Cardiovasc Med. 2004 Apr;14(3):83–93. doi: 10.1016/j.tcm.2003.12.006. [DOI] [PubMed] [Google Scholar]
- 14.Lopatin AN, Shantz LM, Mackintosh CA, Nichols CG, Pegg AE. Modulation of potassium channels in the hearts of transgenic and mutant mice with altered polyamine biosynthesis. J Mol Cell Cardiol. 2000 Nov;32(11):2007–24. doi: 10.1006/jmcc.2000.1232. [DOI] [PubMed] [Google Scholar]
- 15.McLerie M, Lopatin AN. Dominant-negative suppression of I(K1) in the mouse heart leads to altered cardiac excitability. J Mol Cell Cardiol. 2003 Apr;35(4):367–78. doi: 10.1016/s0022-2828(03)00014-2. [DOI] [PubMed] [Google Scholar]
- 16.Meadows L, Malhotra JD, Stetzer A, Isom LL, Ragsdale DS. The intracellular segment of the sodium channel β1 subunit is required for its efficient association with the channel α subunit. J Neurochem. 2001;76:1871–8. doi: 10.1046/j.1471-4159.2001.00192.x. [DOI] [PubMed] [Google Scholar]
- 17.Burbach GJ, Dehn D, Nagel B, Del Turco D, Deller T. Laser microdissection of immunolabeled astrocytes allows quantification of astrocytic gene expression. J Neurosci Methods. 2004 Sep 30;138(1–2):141–8. doi: 10.1016/j.jneumeth.2004.03.022. [DOI] [PubMed] [Google Scholar]
- 18.Livak KJ, Schmittgen TD. Analysis of relative gene expression data using real-time quantitative PCR and the 2(−Delta Delta C(T)) Method. Methods. 2001 Dec;25(4):402–8. doi: 10.1006/meth.2001.1262. [DOI] [PubMed] [Google Scholar]
- 19.Zicha S, Maltsev VA, Nattel S, Sabbah HN, Undrovinas AI. Post-transcriptional alterations in the expression of cardiac Na+ channel subunits in chronic heart failure. J Mol Cell Cardiol. 2004 Jul;37(1):91–100. doi: 10.1016/j.yjmcc.2004.04.003. [DOI] [PMC free article] [PubMed] [Google Scholar]
- 20.Maier SK, Westenbroek RE, Schenkman KA, Feigl EO, Scheuer T, Catterall WA. An unexpected role for brain-type sodium channels in coupling of cell surface depolarization to contraction in the heart. Proc Natl Acad Sci U S A. 2002 Mar 19;99(6):4073–8. doi: 10.1073/pnas.261705699. [DOI] [PMC free article] [PubMed] [Google Scholar]
- 21.Maier SK, Westenbroek RE, McCormick KA, Curtis R, Scheuer T, Catterall WA. Distinct subcellular localization of different sodium channel alpha and beta subunits in single ventricular myocytes from mouse heart. Circulation. 2004 Mar 23;109(11):1421–7. doi: 10.1161/01.CIR.0000121421.61896.24. [DOI] [PubMed] [Google Scholar]
- 22.Thompson AL, Filatov G, Chen C, Porter I, Li Y, Rich MM, et al. A selective role for MRF4 in innervated adult skeletal muscle: Na(V) 1.4 Na+ channel expression is reduced in MRF4-null mice. Gene Expr. 2005;12(4–6):289–303. doi: 10.3727/000000005783992034. [DOI] [PMC free article] [PubMed] [Google Scholar]
- 23.Mohler PJ, Rivolta I, Napolitano C, LeMaillet G, Lambert S, Priori SG, et al. Nav1.5 E1053K mutation causing Brugada syndrome blocks binding to ankyrin-G and expression of Nav1.5 on the surface of cardiomyocytes. Proc Natl Acad Sci U S A. 2004 Dec 14;101(50):17533–8. doi: 10.1073/pnas.0403711101. [DOI] [PMC free article] [PubMed] [Google Scholar]
- 24.Mitchell GF, Jeron A, Koren G. Measurement of heart rate and Q-T interval in the conscious mouse. Am J Physiol. 1998 Mar;274(3 Pt 2):H747–51. doi: 10.1152/ajpheart.1998.274.3.H747. [DOI] [PubMed] [Google Scholar]
- 25.Grosson CL, Cannon SC, Corey DP, Gusella JF. Sequence of the voltage-gated sodium channel beta1-subunit in wild-type and in quivering mice. Brain Res Mol Brain Res. 1996;42(2):222–6. doi: 10.1016/s0169-328x(96)00123-4. [DOI] [PubMed] [Google Scholar]
- 26.Grieco TM, Malhotra JD, Chen C, Isom LL, Raman IM. Open-channel block by the cytoplasmic tail of sodium channel β4 as a mechanism for resurgent sodium current. Neuron. 2005;45:233–44. doi: 10.1016/j.neuron.2004.12.035. [DOI] [PubMed] [Google Scholar]
- 27.Zimmer T, Bollensdorff C, Haufe V, Birch-Hirschfeld E, Benndorf K. Mouse heart Na+ channels: primary structure and function of two isoforms and alternatively spliced variants. Am J Physiol Heart Circ Physiol. 2002 Mar;282(3):H1007–17. doi: 10.1152/ajpheart.00644.2001. [DOI] [PubMed] [Google Scholar]
- 28.Zhang Z, Xu Y, Song H, Rodriguez J, Tuteja D, Namkung Y, et al. Functional Roles of Ca(v)1.3 (alpha(1D)) calcium channel in sinoatrial nodes: insight gained using gene-targeted null mutant mice. Circ Res. 2002 May 17;90(9):981–7. doi: 10.1161/01.res.0000018003.14304.e2. [DOI] [PubMed] [Google Scholar]
- 29.Malhotra JD, Chen C, Rivolta I, Abriel H, Malhotra R, Mattei LN, et al. Characterization of Sodium Channel α and β subunits in Rat and Mouse Cardiac Myocytes. Circulation. 2001;103:1303–10. doi: 10.1161/01.cir.103.9.1303. [DOI] [PubMed] [Google Scholar]
- 30.Cohen SA. Immunocytochemical localization of rH1 sodium channel in adult rat heart atria and ventricle. Presence in terminal intercalated disks. Circulation. 1996;94(1):3083–6. doi: 10.1161/01.cir.94.12.3083. [DOI] [PubMed] [Google Scholar]
- 31.Ishihara K, Yan DH, Yamamoto S, Ehara T. Inward rectifier K(+) current under physiological cytoplasmic conditions in guinea-pig cardiac ventricular cells. J Physiol. 2002 May 1;540(Pt 3):831–41. doi: 10.1113/jphysiol.2001.013470. [DOI] [PMC free article] [PubMed] [Google Scholar]
- 32.Deschenes I, Tomaselli GF. Modulation of Kv4.3 current by accessory subunits. FEBS letters. 2002 Sep 25;528(1–3):183–8. doi: 10.1016/s0014-5793(02)03296-9. [DOI] [PubMed] [Google Scholar]
- 33.Nerbonne JM, Kass RS. Molecular physiology of cardiac repolarization. Physiol Rev. 2005 Oct;85(4):1205–53. doi: 10.1152/physrev.00002.2005. [DOI] [PubMed] [Google Scholar]
- 34.Isom LL, Scheuer T, Brownstein AB, Ragsdale DS, Murphy BJ, Catterall WA. Functional co-expression of the β1 and type IIA α subunits of sodium channels in a mammalian cell line. J Biol Chem. 1995;270:3306–12. doi: 10.1074/jbc.270.7.3306. [DOI] [PubMed] [Google Scholar]
- 35.Qu Y, Isom LL, Westenbroek RE, Rogers JC, Tanada TN, McCormick KA, et al. Modulation of cardiac Na+ channel expression in Xenopus oocytes by β1 subunits. J Biol Chem. 1995;270:25696–701. doi: 10.1074/jbc.270.43.25696. [DOI] [PubMed] [Google Scholar]
- 36.Makita N, Bennett PB, Jr, George AL., Jr Voltage-gated Na+ channel β1 subunit mRNA expressed in adult human skeletal muscle, heart, and brain is encoded by a single gene. J Biol Chem. 1994;269:7571–8. [PubMed] [Google Scholar]
- 37.Yang JS, Bennett PB, Makita N, George AL, Barchi RL. Expression of the sodium channel β1 subunit in rat skeletal muscle is selectively associated with the tetrodotoxin-sensitive α subunit isoform. Neuron. 1993;11:915–22. doi: 10.1016/0896-6273(93)90121-7. [DOI] [PubMed] [Google Scholar]
- 38.Nuss HB, Chiamvimonvat N, Perez-Garcia MT, Tomaselli GF, Marban E. Functional association of the beta 1 subunit with human cardiac (hH1) and rat skeletal muscle (μ1) sodium channel alpha subunits expressed in Xenopus oocytes. J Gen Physiol. 1995;106:1171–91. doi: 10.1085/jgp.106.6.1171. [DOI] [PMC free article] [PubMed] [Google Scholar]
- 39.Makielski JC, Limberis JT, Chang SY, Fan Z, Kyle JW. Coexpression of beta 1 with cardiac sodium channel alpha subunits in oocytes decreases lidocaine block. Mol Pharmacol. 1996;49(1):30–9. [PubMed] [Google Scholar]
- 40.An RH, Wang XL, Kerem B, Benhorin J, Medina A, Goldmit M, et al. Novel LQT-3 mutation affects Na+ channel activity through interactions between alpha- and beta1-subunits. Circ Res. 1998;83:141–6. doi: 10.1161/01.res.83.2.141. [DOI] [PubMed] [Google Scholar]
- 41.Fahmi AI, Patel M, Stevens EB, Fowden AL, John JE, 3rd, Lee K, et al. The sodium channel beta-subunit SCN3b modulates the kinetics of SCN5a and is expressed heterogeneously in sheep heart. J Physiol. 2001 Dec 15;537(Pt 3):693–700. doi: 10.1111/j.1469-7793.2001.00693.x. [DOI] [PMC free article] [PubMed] [Google Scholar]
- 42.Valdivia CR, Nagatomo T, Makielski JC. Late Na currents affected by alpha subunit isoform and beta1 subunit co-expression in HEK293 cells. J Mol Cell Cardiol. 2002 Aug;34(8):1029–39. doi: 10.1006/jmcc.2002.2040. [DOI] [PubMed] [Google Scholar]
- 43.Undrovinas AI, Shander GS, Makielski JC. Cytoskeleton modulates gating of voltage-dependent sodium channel in heart. Am J Physiol. 1995;269:H203–14. doi: 10.1152/ajpheart.1995.269.1.H203. [DOI] [PubMed] [Google Scholar]
- 44.Schwartz PJ, Priori SG, Spazzolini C, Moss AJ, Vincent GM, Napolitano C, et al. Genotype-phenotype correlation in the long-QT syndrome: gene-specific triggers for life-threatening arrhythmias. Circulation. 2001 Jan 2;103(1):89–95. doi: 10.1161/01.cir.103.1.89. [DOI] [PubMed] [Google Scholar]
- 45.Veldkamp MW, Wilders R, Baartscheer A, Zegers JG, Bezzina CR, Wilde AA. Contribution of sodium channel mutations to bradycardia and sinus node dysfunction in LQT3 families. Circ Res. 2003 May 16;92(9):976–83. doi: 10.1161/01.RES.0000069689.09869.A8. [DOI] [PubMed] [Google Scholar]
- 46.Mohler PJ, Bennett V. Ankyrin-based cardiac arrhythmias: a new class of channelopathies due to loss of cellular targeting. Curr Opin Cardiol. 2005 May;20(3):189–93. doi: 10.1097/01.hco.0000160372.95116.3e. [DOI] [PubMed] [Google Scholar]
- 47.Maier SK, Westenbroek RE, Yamanushi TT, Dobrzynski H, Boyett MR, Catterall WA, et al. An unexpected requirement for brain-type sodium channels for control of heart rate in the mouse sinoatrial node. Proc Natl Acad Sci U S A. 2003 Mar 18;100(6):3507–12. doi: 10.1073/pnas.2627986100. [DOI] [PMC free article] [PubMed] [Google Scholar]
- 48.Lei M, Jones SA, Liu J, Lancaster MK, Fung SS, Dobrzynski H, et al. Requirement of neuronal- and cardiac-type sodium channels for murine sinoatrial node pacemaking. J Physiol. 2004 Sep 15;559(Pt 3):835–48. doi: 10.1113/jphysiol.2004.068643. [DOI] [PMC free article] [PubMed] [Google Scholar]
- 49.Brette F, Orchard CH. No apparent requirement for neuronal sodium channels in excitation-contraction coupling in rat ventricular myocytes. Circ Res. 2006 Mar 17;98(5):667–74. doi: 10.1161/01.RES.0000209963.02720.70. [DOI] [PubMed] [Google Scholar]
- 50.Dudel J, Peper K, Rudel R, Trautwein W. Effect of tetrodotoxin on membrane currents in mammalian cardiac fibres. Nature. 1967 Jan 21;213(73):296–7. doi: 10.1038/213296a0. [DOI] [PubMed] [Google Scholar]