

Abstract
Elevated exposure to manganese is known to cause neurodegeneration in the basal ganglia and to induce movement abnormalities called manganism. However, the underlying mechanism of action is not fully understood. Activation of the resident immune cells in the brain, microglia that release a variety of neurotoxic factors, has been implicated to contribute to neurodegeneration. Of the various neurotoxic factors released by activated microglia, reactive oxygen species such as superoxide and hydrogen peroxide are particularly detrimental to the survival of the oxidative damage-prone neurons. In this study, we report that exposure of rat microglia to manganese chloride (MnCl2) resulted in a time- and concentration-dependent release of hydrogen peroxide (H2O2). The MnCl2-stimulated microglial H2O2 release was sensitive to inhibitors of mitogen-activated protein kinases (MAPK) but not that of NADPH oxidase. MnCl2 induced a rapid activation of the extracellular signal-regulated kinase (ERK) and p38-MAPK in microglia that appeared to precede the MnCl2-induced H2O2 release, suggesting that ERK and p38-MAPK influenced the MnCl2-induced H2O2 release in microglia. In summary, these results demonstrate that manganese chloride is capable of activating microglia to release ROS and MAPK may, in part, be key regulators of the process. These findings may shed significant light on the potential role of microglia in the manganese-induced neurotoxicity.
Keywords: dopamine neuron, microglia, Parkinsonism, reactive oxygen species
Introduction
Overexposure to manganese under certain occupational or dietary conditions is known to result in significant neurotoxicity to the extrapyramidal system and the development of Parkinson disease (PD)-like movement disorders called manganism (Barbeau 1984; Aschner et al., 2005; Martin 2006). In animal models of manganese neurotoxicity, administration of manganese has been shown to lead to elevated levels of manganese in the brain, depletion of dopamine in the striatum, damage to neurons in the basal ganglia, and/or the development of movement disorders in rats, mice and monkeys (Autissier et al., 1982; Bonilla and Prasad 1984; Bird et al., 1984; Eriksson et al., 1987; Komura and Sakamoto 1992). One of the proposed mechanisms for excessive manganese in the brain to induce neurotoxicity is the induction of oxidative stress in dopamine neurons (Donaldson et al., 1982; HaMai and Bondy 2004). For example, depletion of glutathione, the major intracellular anti-oxidant molecule, by inhibition of its biosynthesis potentiates the manganese-induced toxicity in the human SK-NS-H neuroblastoma and the rat pheochromocytoma PC12 cells (Desole et al., 1997; Stokes et al., 2000; Dukhande et al., 2006). Replenishment of glutathione protects SK-N-SH neuroblastoma cells from manganese-induced toxicity (Stredrick et al., 2004). Neuron death has been attributed to manganese-induced free radical generation, glutathione depletion, and dopamine oxidation inside the affected neurons. (Donaldson et al., 1981; Shi and Dalal 1990; Mainho and Manso 1993; Desole et al., 1997; Stokes et al., 2000; HaMai and Bondy 2004; Stredrick et al., 2004; Dukhande et al., 2006).
Increasing evidence indicates that the resident brain immune cells, microglia, contribute to neurodegeneration through the release of neurotoxic factors that include various types of reactive oxygen species (ROS) (Vila et al., 2001; Liu and Hong 2003; McGeer and McGeer 2004; Liu 2006). Of the various pro-inflammatory and cytotoxic factors released by activated microglia, free radicals are particular deleterious to neurons. Accumulation of microglia-originated free radicals leads to neuronal damage through structural and functional modification of proteins, DNA and RNA, and induction of lipid peroxidation that results in the eventual demise of the affected neurons (Facchinetti et al., 1998). Furthermore, studies have shown that the distribution of microglia in the brain is not uniform and the midbrain region that encompasses the basal ganglia is particularly enriched in microglia (Lawson et al., 1990; Kim et al., 2000). Therefore, the combination of susceptibility to oxidative stress and the abundance of microglia in the midbrain region may render basal ganglial neurons particularly vulnerable to ROS generated from activated microglia.
In this study, we determined the effects of micromolar concentrations of MnCl2 on the release of hydrogen peroxide (H2O2) in immortalized rat microglial cells and primary microglia. Pharmacological inhibition and immunoblotting analysis were performed to determine the potential underlying mechanisms of action.
Materials and methods
Materials
Heat-inactivated fetal bovine serum (FBS), Dulbecco’s modified Eagle’s medium (DMEM), phenol red-free DMEM, DMEM/nutrient mixture F12 (1:1, DMEM/F12), supplements, and 8–16% SDS polyacrylamide gels were from Invitrogen (Carlsbad, CA). Poly-D-lysine and manganese chloride (MnCl2) and hydrogen peroxide (30%) were obtained from Fisher Scientific (Fair Lawn, NJ). Fluoro H2O2 detection kit was from Cell Technology (Mountain View, CA). Superoxide dismutase (SOD) and catalase were from EMD Biosciences (San Diego, CA). Monoclonal antibodies against phospho-p44/42 (Thr202/Tyr204) extracellular signal-regulated kinase (ERK1/2), phospho-p38 (Thr180/Tyr182) mitogen-activated protein kinase (MAPK) and phospho-stress-activated protein kinase (SAPK)/c-Jun N-terminal kinase (JNK) (Thr183/Tyr185), polyclonal antibodies against total ERK1/2, p-38 MAPK, and SAPK/JNK, horseradish peroxidase (HRP)-conjugated anti-rabbit and anti-mouse secondary antibodies, and pre-stained protein molecular weight standards were from Cell Signaling Technology (Beverly, MA). MAPK inhibitors U0126, SB202190, and SP600125 were from Alexis Biochemicals (San Diego, CA), prepared as 50 mM stock solutions in dimethyl sulfoxide (DMSO) and stored at −20°C in dark. Diphenylene iodonium (DPI) was from Molecular Probes (Eugene, OR) and stored at −20°C in dark as a 20 mM stock solution in DMSO. Apocynin was from Fluka (Milwaukee, WI) and prepared fresh and sterile for each treatment as a 200 mM stock solution in double distilled water. SuperSignal West Dura extended detection substrate and the Micro BCA protein assay kit were from Pierce (Rockford, IL). The Complete mini protease inhibitor cocktail tablets were from Roche (Indianapolis, IN). All other reagents were from Sigma (St. Louis, MO).
Microglial cell line culture
The rat microglial HAPI cells (Cheepsunthorn et al., 2001) were maintained at 37°C in DMEM supplemented with 5% FBS, 50 U/ml penicillin and 50 µg/ml streptomycin in a humidified environment with 5% CO2 and 95% air as we previously described (Wang et al., 2004). For treatment, HAPI cells were seeded at 5 × 10⁴/well of 96-well plates (for H2O2 detection) or 7.5 × 10⁵/dish of 6-cm culture dishes (for Western blot) and grew for 2 days before treatment.
Primary microglia and astroglial cultures
Rat primary microglia and astroglia were prepared from the brains of 1-day-old Fisher F344 rat pups (Charles River Laboratories, Wilmington, MA) as previously described (Liu et al., 2001). All procedures were performed in compliance with the protocol approved by the University of Florida Institutional Animal Care and Use Committee. Briefly, whole brains, devoid of meninges and blood vessels, were dispersed by a mil mechanical trituration. Cells (2 × 10⁷) were seeded to poly-D-lysine-coated 175 cm² culture flasks and maintained in DMEM/F12 supplemented with 10% FBS, 2 mM L-glutamine, 1 mM sodium pyruvate, 100 µM non-essential amino acids, 50 U/ml penicillin and 50 µg/ml streptomycin at 37°C in 5% CO2 and 95% air. The medium was changed 4 days after seeding and the cultures (mixed glia) were ready for harvesting microglia 10 days later. Microglia were gently shaken off the mixed glia cultures, collected by centrifugation and seeded at 7.5 × 10⁴/well of poly-D-lysine-coated 96-well plates (for H2O2 detection) or 2 × 10⁶/well of poly-D-lysine-coated 6-well plates (for Western blot) and grew overnight in DMEM supplemented with 10% FBS, 50 U/ml penicillin and 50 µg/ml streptomycin in a humidified environment with 5% CO2 and 95% air before use. To obtain astroglia, the post microglia harvest mixed glia cultures were passaged five consecutive times and then seeded at 7.5 × 10⁴/well of poly-D-lysine-coated 96-well plates and grew overnight in DMEM supplemented with 10% FBS, 50 U/ml penicillin and 50 µg/ml streptomycin in a humidified environment with 5% CO2 and 95% air before treatment. The purity of the microglia and astroglia was ≥98% as determined by immunostaining for cell type-specific markers as we previously described (Liu et al. 2001).
Treatment
For each treatment, a stock solution (1 M) of MnCl2 was prepared fresh in sterile de-ionized and distilled water and sterilely filtered (0.2 µm). Secondary stock solutions (1000 fold) were then prepared in sterile de-ionized and distilled water. The de-ionized water was freshly collected from a Model D11931 NANOpure Diamond UV/UF de-ionization system (Barnstead International, Dubuque, IA) using distilled water as the source. The residual levels of metals such as arsenic, cadmium, chromium, lead, manganese, and nickel are less than 0.005, 0.003, 0.004, 0.003, 0.002, and 0.004 ppb, respectively. Calculated quantities of the secondary stock solution were mixed with treatment medium to achieve the desired final concentrations. For treatment, cells were rinsed twice with, and conditioned for 2 hr, in warm treatment media. Treatment media used for treatment periods that were ≤ 6 hr was serum-free phenol red-free DMEM, and for the 24-hr time point, phenol red-free DMEM containing 1% FBS. For inhibitor studies, cells were pretreated in serum-free and phenol red-free DMEM for 30 min with vehicle control or inhibitors prior to treatment with MnCl2. The total volume of treatment media was 100 µl/well for 96-well plates, 2 ml/well for 6-well plates, and 3 ml/dish for 6-cm dishes. Treatment was performed at 37°C with 5% CO2 and 95% air in a humidified environment.
Measurement of H2O2 release
The Fluoro H2O2 detection kit is based on a peroxidase catalyzed oxidation by H2O2 of the non-fluorescent substrate 10-acetyl-3,7-dihydroxyphenoxazine to a fluorescent resorufin following the manufacturer’s suggested protocol (Zhou et al., 1997). Briefly, following treatment, 50 µl of supernatant from each well of the 96-well plate was mixed, in an opaque 96-well assay plate, with 100 µl of freshly prepared reaction cocktail diluted in the same media that was used to treat the cells. The reaction mixture was incubated in dark for 10 min at room temperature. Fluorescent intensities were measured at 530 nm (excitation)/590 nm (emission) using a Synergy HT multi-well plate reader (BioTek Instruments, Winooski, VT). The amounts of H2O2 in the supernatants were derived from a seven-point standard curve generated with known concentrations of H2O2 (0.125 – 4 µM final concentration) freshly diluted in the same media as the samples in triplicate.
Preparation of total cell lysate
Following treatment, HAPI cells in 6-cm dishes or primary microglia in 6-well plates were rinsed three times with ice-cold phosphate buffered saline (PBS). Cells were then scraped into 300 µl of cold lysis buffer consisting of 50 mM Tris-HCl, pH 7.4, 150 mM sodium chloride, 1% NP-40, 0.5% SDS, 0.5% sodium deoxycholate, 2 mM EDTA, 0.5 mM EGTA, 1 mM sodium fluoride, 1 mM sodium molybdate, 1 mM sodium orthovanadate, 5 mM β-glycerolphosphate and the Complete mini protease inhibitor cocktail as previously described (Liu et al., 2001). Cells were homogenized (10 passes) with a Teflon pestle glass homogenizer and the homogenates were centrifuged at 4°C for 1 hr at 20,000 × g. The supernatants were saved and stored at −80°C. Protein concentrations were determined using the Micro BCA protein assay reagents using bovine serum albumin (BSA) as a standard as previously described (Liu et al., 2001).
Western blot analysis for MAPK activation
Proteins (20 µg/lane) were mixed with 5X SDS sample buffer and separated on 8–16% Tris-Glycine SDS-PAGE gels and transferred, electrophoretically, to nitrocellulose membranes as previously described (Zhang et al., 2000). After blocking for 2 hr in PBS-0.1% Tween-20 (T-PBS) containing 5% milk (blocking solution), the membranes were incubated overnight at 4°C with a monoclonal antibody against phospho-ERK, phospho-p38 MAPK, or phospho-JNK diluted (1:1000) in T-PBS containing 3% BSA. After washing with T-PBS, the membranes were incubated for 1 hr at room temperature with HRP-conjugated goat-anti-mouse IgG diluted (1:5000) in blocking solution. After washing with T-PBS, the bound antibody was visualized with the SuperSignal West Dura chemiluminescent reagents. Images were recorded using a Bio-Rad ChemiDoc XRS digital imaging system and the intensities of phospho-MAPK bands were quantified with the BioRad Quantity One software. For equal loading verification, in addition to loading the same amount of total proteins for each lane and confirming the total protein transfer efficiency with Ponceau S (0.1%) staining of the transferred nitrocellulose membranes, the probed membranes were striped and re-probed with corresponding antibodies against total ERK, total p38 MAPK, or total JNK. Briefly, the probed membranes were incubated for 20 min at 55°C with a stripping buffer (65 mM Tris-HCl, pH 6.7, 100 mM β-mercaptoethanol and 2% SDS). Afterwards, the membranes were washed extensively with T-PBS, blocked for 2 hr with blocking solution, and incubated overnight at 4°C with a polyclonal antibody against total ERK, p-38 MAPK or JNK diluted (1:2000) in T-PBS containing 3% BSA. Bound primary antibodies were detected by incubation for 1 hr with HRP-conjugated goat anti-rabbit IgG diluted (1:7500) in blocking solution, detected with the SuperSignal West Dura chemiluminescent reagents, and recorded with the BioRad ChemiDoc XRS digital imaging system.
Statistical Analysis
For statistical significance, data were analyzed with one-way ANOVA followed by Bonferroni/Dunn post hoc analysis using the StatView program (SAS Institute, Cary, NC). A p value of < 0.05 was considered statistically significant.
Results
MnCl2 stimulates HAPI cells to release H2O2
To determine whether MnCl2 would stimulate microglia to release of H2O2, HAPI cells in 96-well culture plates were treated with 0 (vehicle: 0.1% water), 0.33, 1, 3.33, 10, or 33 µM of MnCl2 for 0.25, 1, 3, 6, or 24 hr. Portions of the supernatants were removed and the amounts of H2O2 in the supernatants were determined with the Fluoro H2O2 reagents. As shown in Figure 1, MnCl2 stimulated a time- and MnCl2 concentration-dependent increase in the H2O2–specific fluorescent intensity in the supernatants from MnCl2-treated HAPI cells. At the 0.25-hr time point, levels of H2O2 in the supernatants from the vehicle-treated control cells did not differ significantly from those treated with any concentration of MnCl2 used in the study. However, by 1 hr after MnCl2 treatment, compared to the vehicle-treated control cells, significantly elevated amount of H2O2 was observed in the supernatant from cells treated with 1 µM or a higher concentration of MnCl2. The MnCl2-stimulated elevation in H2O2 in the supernatants continued to increase and by 6 hr post MnCl2 treatment, the amount of H2O2 in the supernatant from cells treated with the lowest concentration (0.33 µM) of MnCl2 used in this study was significantly greater than that of the time-matched control cells (Fig. 1). After the 6-hr time point, the MnCl2-stimulated elevation in H2O2 seemed to have reached a plateau, although significantly elevated levels of H2O2 were still detected at 24 hr, the longest time point examined (Fig. 1). The viability of the cells, as judged by the MTT assay (Liu et al., 2001) was not significantly affected by treatment with those concentrations of MnCl2 for up to 24 hr (data not shown).
Fig. 1.
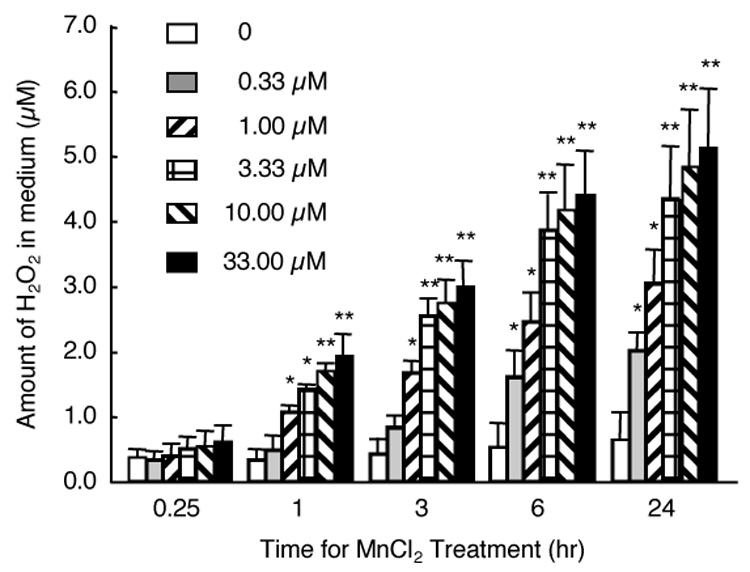
Time course and concentration-dependence for MnCl2-stimulated H2O2 release in HAPI cells. Cells seeded in 96-well culture plates were treated (in quadruplicate) with vehicle control (0), or indicated concentrations of MnCl2 for indicated timed periods and the amounts of H2O2 in the supernatants were determined as described in the Experimental Procedures. Results are mean ± SEM from three separate experiments. *, p < 0.05; **, p < 0.005 compared to the time-matched control cells.
To further ascertain the identity of the MnCl2-stimulated fluorescent signals detected by the Fluoro H2O2 reagents, we next pretreated HAPI cells for 15 min with increasing concentrations of catalase (0.4 – 50 units/ml) prior to treating the cells with vehicle control or 10 µM MnCl2. Six hours later, the amounts of H2O2 in the supernatants were determined. As shown in Fig. 2A, compared to the cells treated with 10 µM MnCl2 alone, pretreatment of HAPI cells with catalase dose-dependently reduced the amounts of H2O2 detected. Pretreatment with 50 U/ml catalase reduced the amount of H2O2 detected to that of the control cells (Fig. 2A). In contrast, pretreatment of HAPI cells with 10 or 50 units/ml SOD prior to treatment with 10 µM MnCl2 for 6 hr, did not have any significant effect on the amount of H2O2 detected in the supernatant, compared to that found from cells stimulated with 10 µM MnCl2 alone (Fig. 2B). No significant effects on the basal levels of H2O2 were observed when cells were treated with 50 U/ml of catalase or SOD alone (Fig. 2).
Fig. 2.
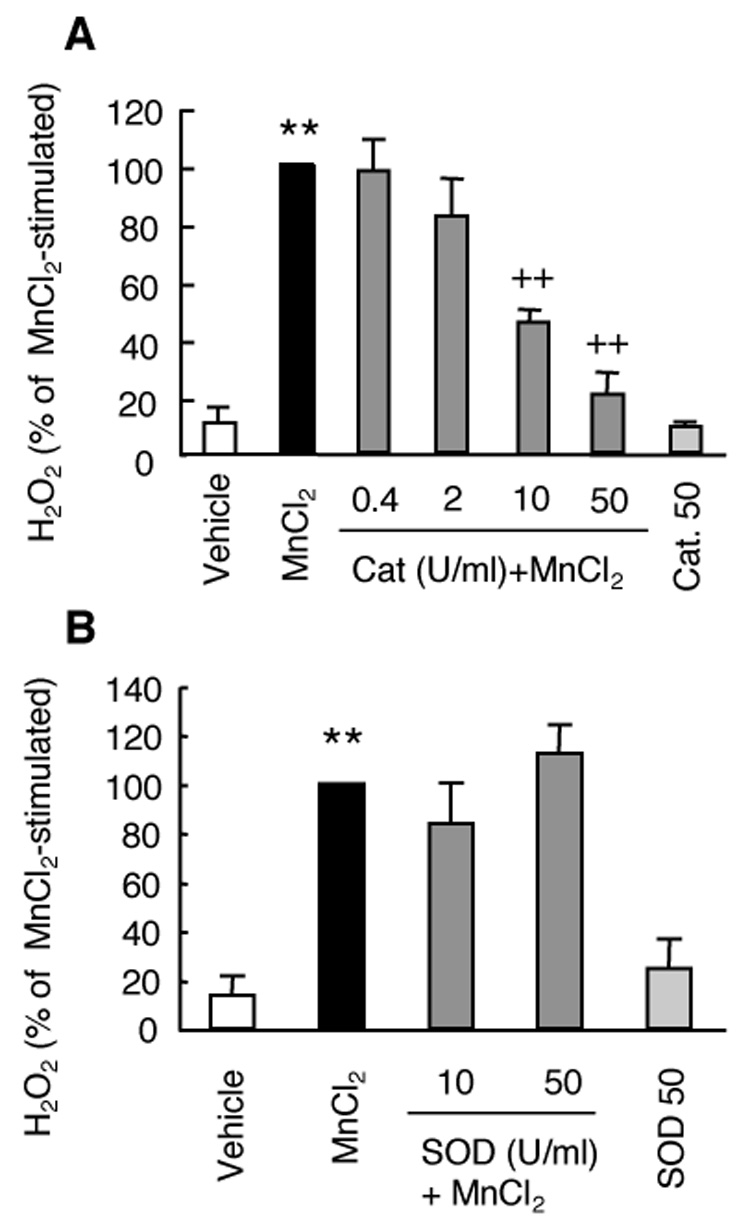
Effect of catalase or SOD on MnCl2-stimulated H2O2 release in HAPI cells. Cells were pretreated for 15 min with vehicle control, or indicated units (U)/ml of catalase (cat, A) or SOD (B) prior to treatment for 6 hr with MnCl2 (10 µM) and the amounts of H2O2 in the supernatants were determined. Results are expressed as a percentage of the MnCl2-stimulated cells and are mean ± SEM from three experiments performed in quadruplicate. **, p < 0.005 compared to the vehicle-treated control cells; ++, p < 0.005 compared to the MnCl2-treated cells;
Effect of NADPH oxidase and MAPK inhibitors on MnCl2-stimulated release H2O2 in HAPI cells
To elucidate the potential mechanism of action responsible for the MnCl2-stimulated H2O2 release in HAPI cells, we first tested the effect of NADPH oxidase inhibitors since NADPH oxidase is the primary enzyme system for ROS generation in immune cells of the brain and peripheral system (Babior 2004). Preincubation of HAPI cells for 15 min with 2 or 10 µM of DPI which inhibits the catalytic activity of NADPH oxidase (Irani et al., 1997) prior to stimulation with 10 µM of MnCl2 for 6 hr did not have any significant effect on the MnCl2-stimulated release of H2O2 (Fig. 3A). Furthermore, no significant effect on MnCl2-stimulated (10 µM, 6 hr) release of H2O2 was observed when HAPI cells were preincubated with 20 or 100 µM apocynin which prevents the assembly of the NADPH oxidase complex (Stolk et al., 1994).
Fig. 3.
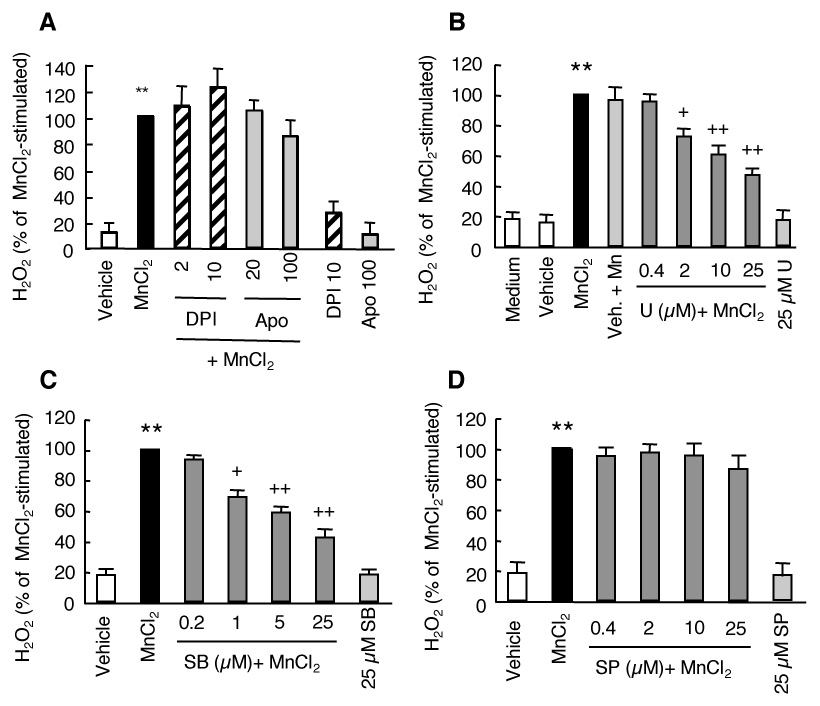
Effect of inhibitors of NADPH oxidase or MAPK on MnCl2-stimulated H2O2 release in HAPI cells. A. Cells were pretreated for 15 min with vehicle control (0.05% DMSO), or indicated concentrations of DPI or apocynin (Apo) prior to treatment for 6 hr with MnCl2 (10 µM) and the amounts of H2O2 in the supernatants were determined. B–D. Cells were pretreated for 15 min with medium, vehicle (0.05% DMSO), or indicated concentrations of U0126 (U), SB202190 (SB), or SP600125 (SP) prior to treatment for 3 hr with MnCl2 (10 µM) and the amounts of H2O2 in the supernatants were determined. Results are expressed as a percentage of the MnCl2-stimulated cells and are mean ± SEM from three experiments performed in quadruplicate. **, p < 0.005 compared to the vehicle-treated control cells; +, p < 0.05; ++, p < 0.005 compared to the MnCl2-treated cells.
Since members of the MAPK play important roles in a wide range of cellular functions in response to various extracellular insults (Johnson and Lapadat 2002), we next examined whether inhibitors of MAPK had any effect on the MnCl2-stimulated release of H2O2 in HAPI cells. We used U0126, SB202190, and SP600125 that are selective inhibitors of ERK, p38 MAPK, and JNK respectively (Favata et al., 1998; Davies et al., 2000; Bennett et al., 2001). Preincubation of cells for 15 min with U0126 (0.4–25 µM) prior to stimulation with 10 µM MnCl2 for 3 hr dose dependently reduced the MnCl2-stimulated release of H2O2 (Fig. 3B). Compared to that of the MnCl2-stimulated cells, pretreatment with 2, 10 and 25 µM U0126 reduced the MnCl2-stimulated release of H2O2 by 28%, 39% and 54%, respectively (Fig. 3B). In addition, the MnCl2-stimulated release of H2O2 in HAPI cells was also dose-dependently reduced by pretreatment of cells with SB202190 (Fig. 3C). A reduction of 31%, 42% and 58% was observed in cells pretreated with 1, 5 and 25 µM SB202190, respectively (Fig. 3C). In contrast, no significant effect on the MnCl2-stimulated release of H2O2 in HAPI cells was observed when cells were pretreated with 0.4–25 µM SP600125. Inclusion of vehicle (0.05% DMSO) did not have a significant effect on either the basal or MnCl2-stimulated release of H2O2 (Fig. 3B). Similarly, treatment with 25 µM of any of the three MAPK inhibitors did not have a significant effect on the basal levels of H2O2 release (Fig. 3B–C).
MnCl2-stimulated release of H2O2 in primary microglia
Besides the HAPI microglial cell line, we next determined the effect of MnCl2 on the release of H2O2 in primary rat microglia. As shown in Fig. 4, treatment of primary microglia for 6 hr (Fig. 4A) or 24 hr (Fig. 4B) with 1 and 10 µM MnCl2 resulted in a significant release of H2O2. Interestingly, in rat primary astrocytes stimulated with MnCl2 under the same conditions, a time and concentration-dependent increase in H2O2 release was observed (Fig. 4A and 4B). However, the increases were statistically insignificant compared to the control.
Fig. 4.
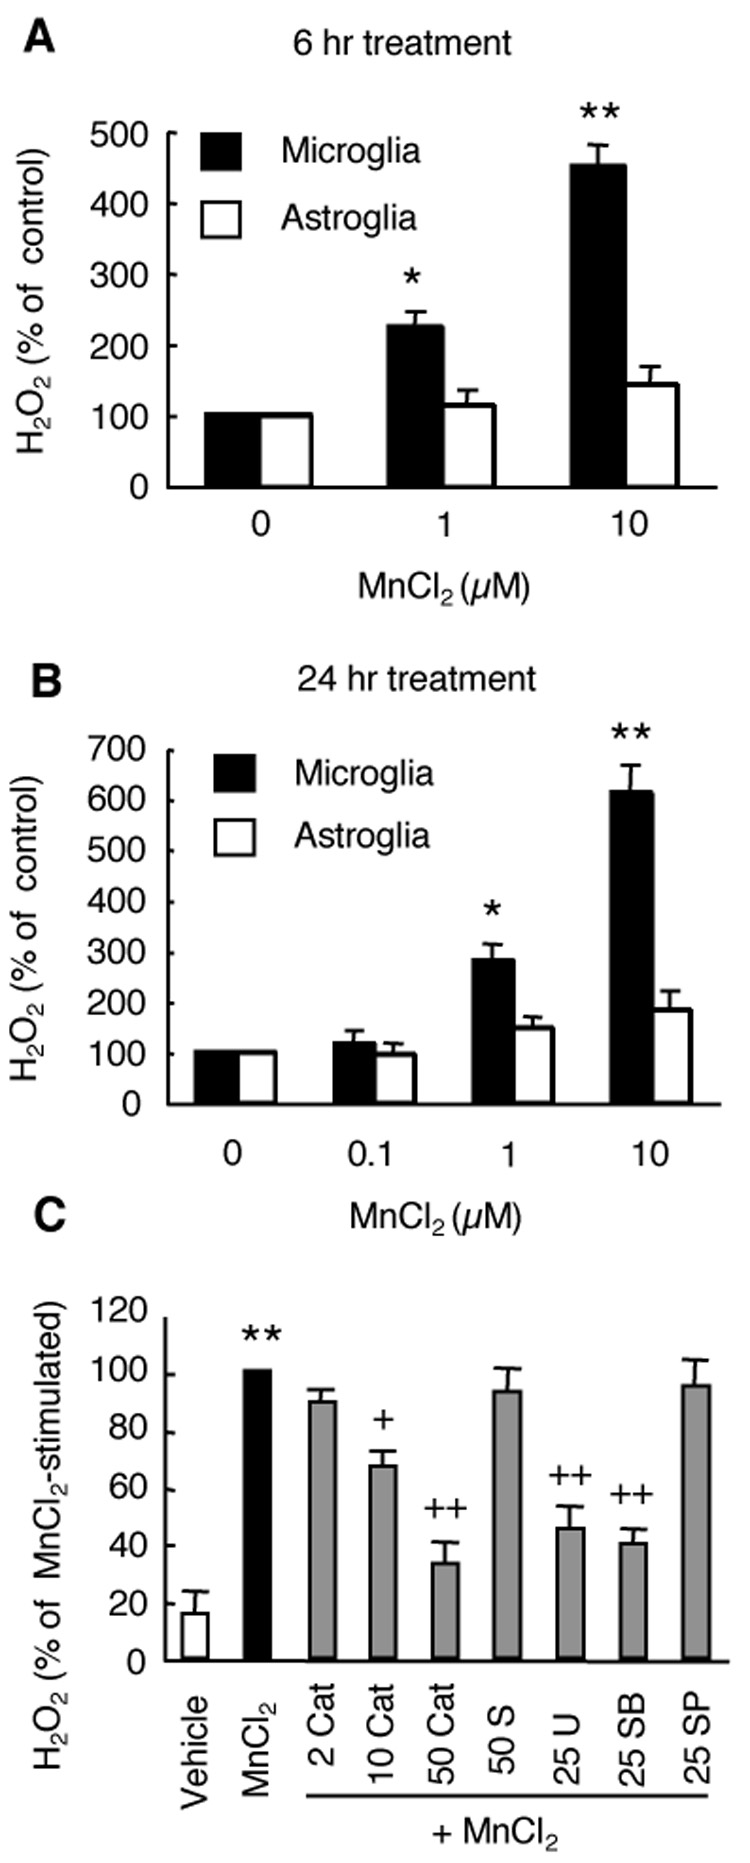
MnCl2-stimulated H2O2 release in primary microglia. A and B. Primary microglia or astroglia were treated for 6 hr (A) or 24 hr (B) with vehicle control (0), or indicated concentrations of MnCl2 and the amounts of H2O2 in the supernatants were determined. Results are expressed as a percentage the vehicle-treated cells. C. Primary microglia were pretreated for 15 min with vehicle control (0.05% DMSO), or indicated concentrations of catalase (Cat, U/ml), SOD (S, U/ml), U0126 (U, µM), SB202190 (SB, µM), or SP600125 (SP, µM) prior to treatment for 3 hr with MnCl2 (10 µM) and the amounts of H2O2 in the supernatants were determined. Results are expressed as a percentage the MnCl2-stimulated cells. Data are mean ± SEM from three experiments performed in triplicate. *, p < 0.05; **, p < 0.005 compared to the vehicle-treated control cells; +, p < 0.05; ++, p < 0.005 compared to the MnCl2-treated cells.
Similar to that observed for the HAPI microglial cell line (Fig. 2 and 3), the MnCl2-stimulated release of H2O2 in primary microglia was significantly reduced by preincubation with catalase (10 and 50 U/ml), U0126 (25 µM), or SB202190 (25 µM), but not SOD (50 U/ml) and SP600125 (25 µM) (Fig. 4C). A 35%, 67%, 55% and 60% inhibition of the MnCl2-stimulated H2O2 was observed in microglia pretreated with 10 U/ml catalase, 50 U/ml catalase, 25 µM U0126, and 25 µM SB202190, respectively.
MnCl2 induces a rapid activation of ERK in HAPI cells
To further explore the relationship between MnCl2-stimulated release of H2O2 and MAPK activation, we first determined the time course for ERK activation in HAPI cells following MnCl2 stimulation. MnCl2 induced a time-dependent activation of ERK, as determined by Western blot analysis for phospho-ERK (p42/p44). At 0.25 hr following stimulation with 10 µM MnCl2, the degree of ERK activation increased by 2 fold over of that of the control cells (Fig. 5A). MnCl2-stimulated ERK activation continued to increase with increasing treatment time until it reached a plateau at 2 hr, at which time point, MnCl2 (10 µM)-induced ERK activation was 10 fold of that of the control cells. Afterwards, the magnitude of the MnCl2-induced ERK activation started to gradually decline but remained significantly elevated at 6 hr post stimulation (Fig. 5A). In HAPI cells stimulated with 0–10 µM MnCl2 for 3 hr, significant ERK activation was observed in cells stimulated with the lowest (1 µM) concentration used (Fig. 5B).
Fig. 5.
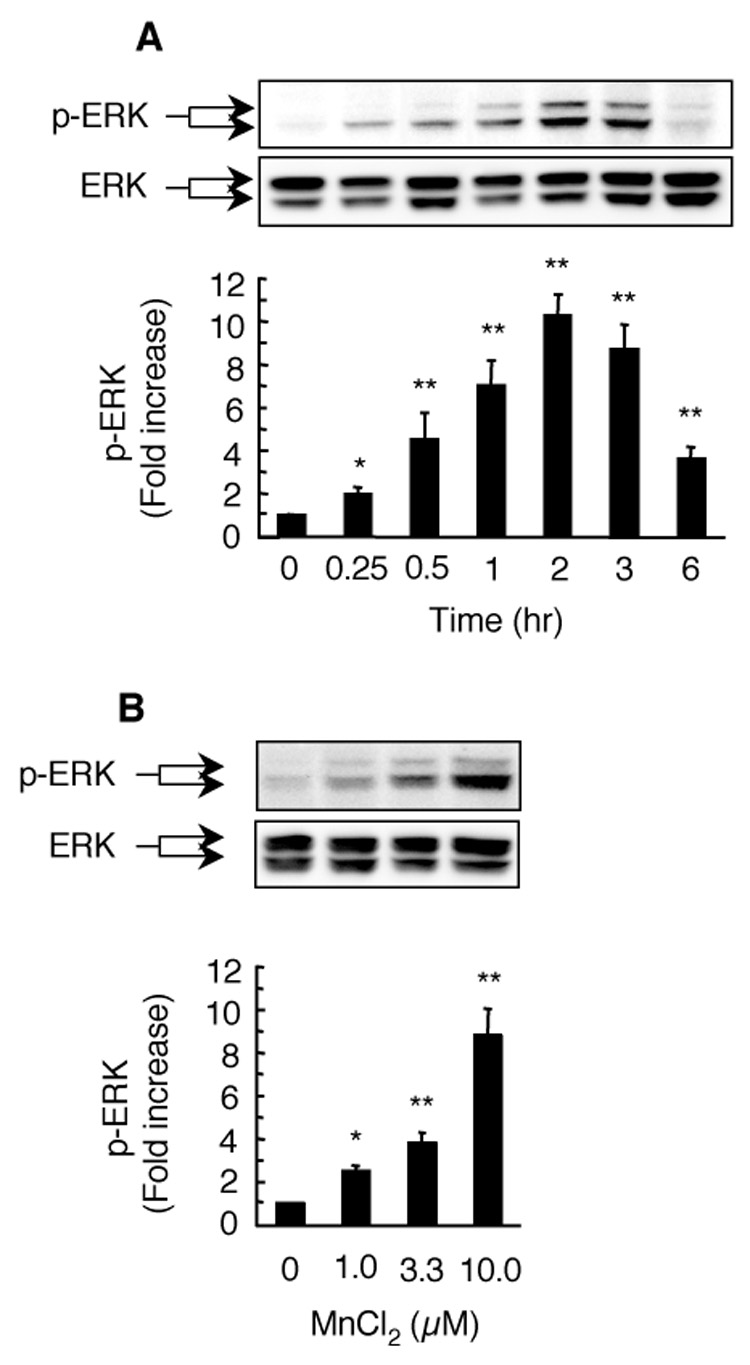
Time course and concentration dependence for MnCl2-stimulated ERK activation in HAPI cells. For time course study (A), cells were left untreated (0) or treated with 10 µM MnCl2 for the indicated timed intervals. For concentration dependence study (B), cells were stimulated for 3 hr with vehicle control (0) or indicated concentrations of MnCl2. Total cellular proteins (20 µg/lane) were separated on 8–16% SDS-PAGE gels, and immuno-blotted for phospho-ERK-p42/p44 (p-ERK) followed by chemiluminescence detection as described in the Experimental Procedures. Images were recorded and quantified with Bio-Rad Quantity One imaging software. Afterwards, the membranes were stripped and re-probed for total ERK (ERK). Presented in the top panels are representative Western blots of phospho-ERK (p-ERK) and corresponding total ERK (ERK) from one experiment. Presented at the bottoms are intensities of the phospho-ERK bands. Results are expressed as a fold increase over that of the control cells (0) and are mean ± SEM from four (A) or three (B) experiments. *, p < 0.05; **, p < 0.005 compared to the vehicle-treated control cells.
Preincubation of HAPI cells with the ERK inhibitor U0126 prior to stimulation with 10 µM MnCl2 for 3 hr dose-dependently inhibited the MnCl2-stimulated ERK activation (Fig. 6A). U0126 at 2, 10, and 25 µM reduced the MnCl2-stimulated ERK activation by 36%, 74% and 89%, respectively. The degree of inhibition (89%) by 25 µM U0126 for the MnCl2-stimulated ERK activation was more prominent that (46%) for the MnCl2-stimulated H2O2 release (Fig. 3B). No significant effect on the basal level of MnCl2-stimulated ERK activation was observed in cells exposed to the vehicle (0.05% DMSO) alone.
Fig. 6.
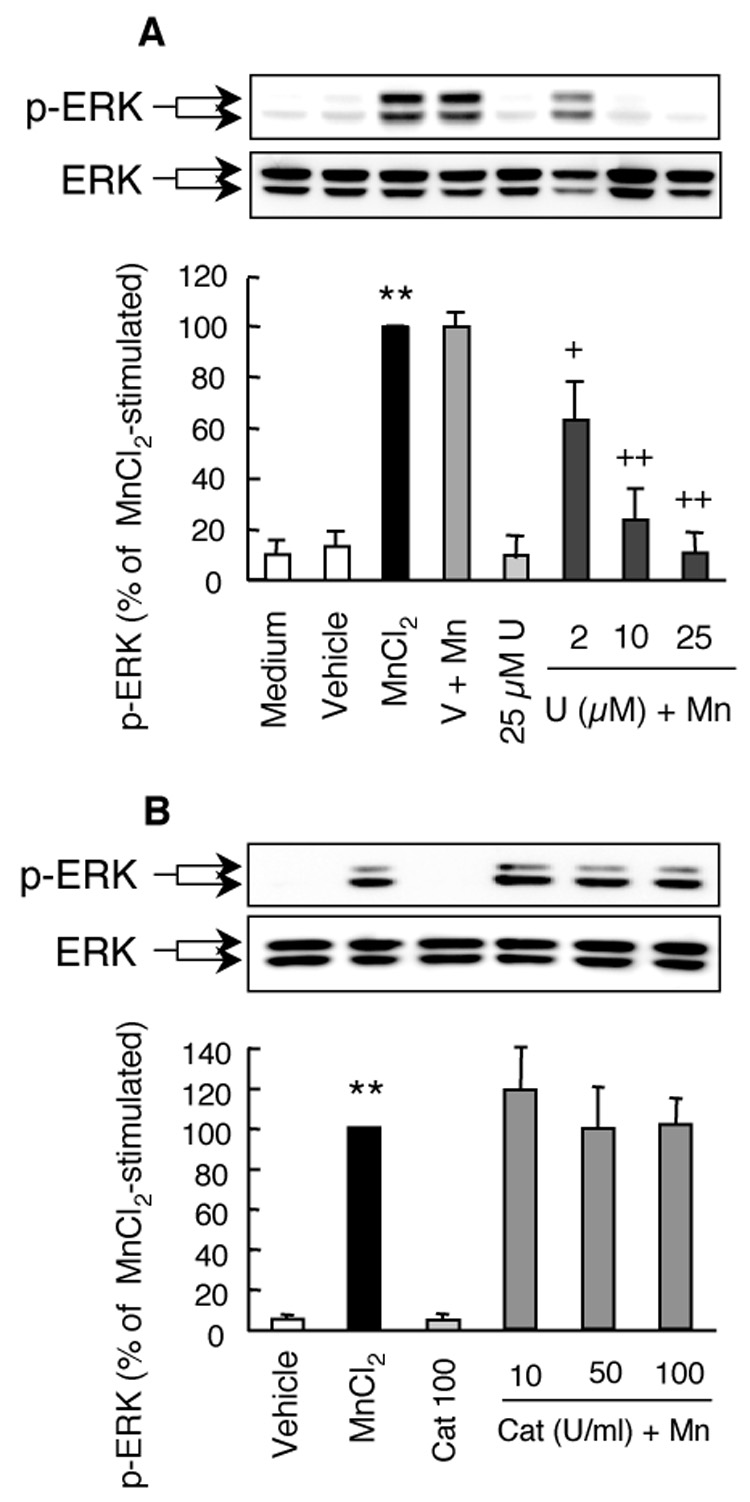
Effects of U0126 and catalase on the MnCl2-stimulated ERK activation in HAPI cells. Cells were pretreated for 15 min with vehicle control (V, 0.05% DMSO), indicated concentrations of U0126 (U; A), or catalase (Cat; B) prior to treatment for 3 hr with 10 µM MnCl2. The representative Western blots of phospho-ERK (p-ERK) and corresponding total ERK (ERK) in the top panel were from one experiment. The bar graphs in the bottom panel were intensities of the phospho-ERK bands expressed as a percentage of that of the MnCl2-stimulated cells and are mean ± SEM from three experiments. **, p < 0.005 compared to the medium- or vehicle-treated control cells; +, p < 0.05; ++, p < 0.005 compared to the MnCl2-treated cells.
To determine the relationship between ERK activation and the released H2O2, HAPI cells were pretreated with catalase prior to stimulation with 10 µM MnCl2 for 3 hr. As shown in Fig. 6B, preincubation of cells with 10-100 U/ml of catalase did not have any significant effect on the MnCl2-stimulated ERK activation.
Effect of MnCl2 on the activation of p38 MAPK in HAPI cells
Next we determined the relationship between MnCl2-stimulated H2O2 release and p38 MAPK activation. HAPI cells were stimulated with 10 µM MnCl2 for 0–6 hr and the activation of p38 MAPK was analyzed by Western blot for phospho-p38 MAPK. As shown in Fig. 7A, MnCl2 treatment induced a time-dependent activation of p38 MAPK in HAPI cells. At 0.25 hr following MnCl2 stimulation, the band intensity of phopho-p38 MAPK increased by 1.5 fold over the 0 hr time point, though the increase was statistically insignificant. Significant activation of p38MAPK was evident by 0.5 hr following MnCl2 stimulation and the degree of p38 MAPK activation continued to increase over time until it reached a plateau by 2–3 hr following MnCl2 stimulation, at which time point, a 4 fold increased over control cells was observed (Fig. 7A). By 6 hr after MnCl2 stimulation, the degree of p38 MAPK activation had declined markedly but remained significant compared to the 0 hr time point. In HAPI cells treated with 0–10 µM MnCl2 for 3 hr, a concentration-dependent p38 MAPK activation was observed (Fig. 7B). Compared to the time course for the MnCl2-stimulated H2O2 release (Fig. 1), the MnCl2-stimulated p38 MAPK activation (Fig. 7A) occurred slightly ahead of the former.
Fig. 7.
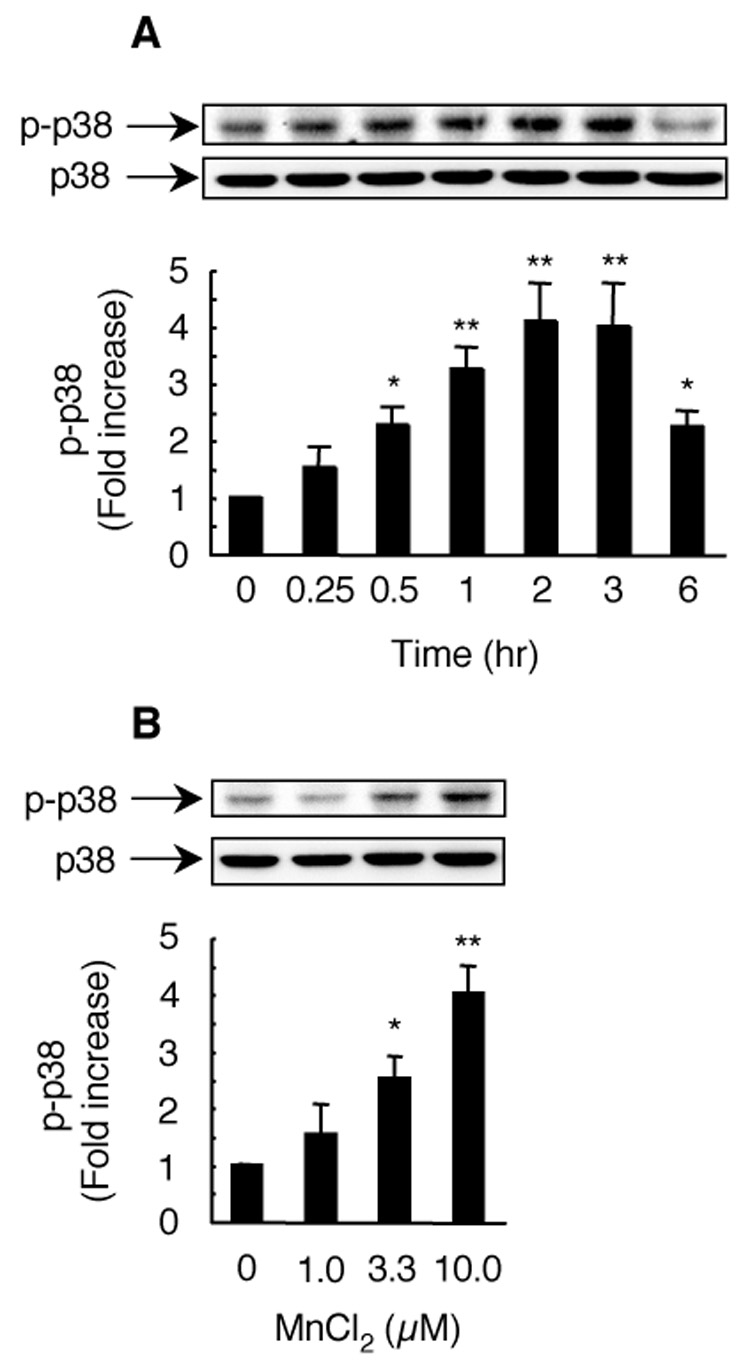
Time course and concentration dependence for MnCl2-stimulated p38 MAPK activation in HAPI cells. For time course study (A), cells were left untreated (0) or treated with 10 µM MnCl2 for the indicated timed intervals. For concentration dependence study (B), cells were stimulated for 3 hr with vehicle control (0) or indicated concentrations of MnCl2. Total cellular proteins (20 µg/lane) were separated on SDS-PAGE gels and immuno-blotted for phospho-p38 MAPK (p-p38). Afterwards, the membranes were stripped and re-probed for total p38 MAPK (p38). Top, representative Western blots of phospho-p38 MAPK (p-p38) and corresponding total p38 MAPK (p38) from one experiment. Bottoms: intensities of the phospho-p38 MAPK bands. Results are expressed as a fold increase over that of the control cells (0) and are mean ± SEM from four (A) or three (B) experiments. *, p < 0.05; **, p < 0.005 compared to the vehicle-treated control cells; +, p < 0.05; ++, p < 0.005 compared to the MnCl2-treated cells.
Preincubation of HAPI cells with the p38 MAPK inhibitor SB202190 prior to stimulation with 10 µM MnCl2 for 3 hr dose-dependently inhibited the MnCl2-stimulated ERK activation (Fig. 8A). The MnCl2-stimulated ERK activation was reduced by 40% and 75% in cells treated with 5 and 25 µM SB202190, respectively. Similar to that observed for the ERK inhibitor U0126, SB202190 (25 µM) was more effective in the inhibition the MnCl2-stimulated p38 MAPK activation (75%) than that in the MnCl2-stimulated H2O2 release (58%, Fig. 3C). No significant effect on the basal p38 MAPK activation was observed in cells exposed to the vehicle (0.05% DMSO). In addition, inclusion of catalase (10–100 U/ml) did not have any significant effect on the MnCl2-stimulated p38 MAPK activation (Fig. 8B).
Fig. 8.
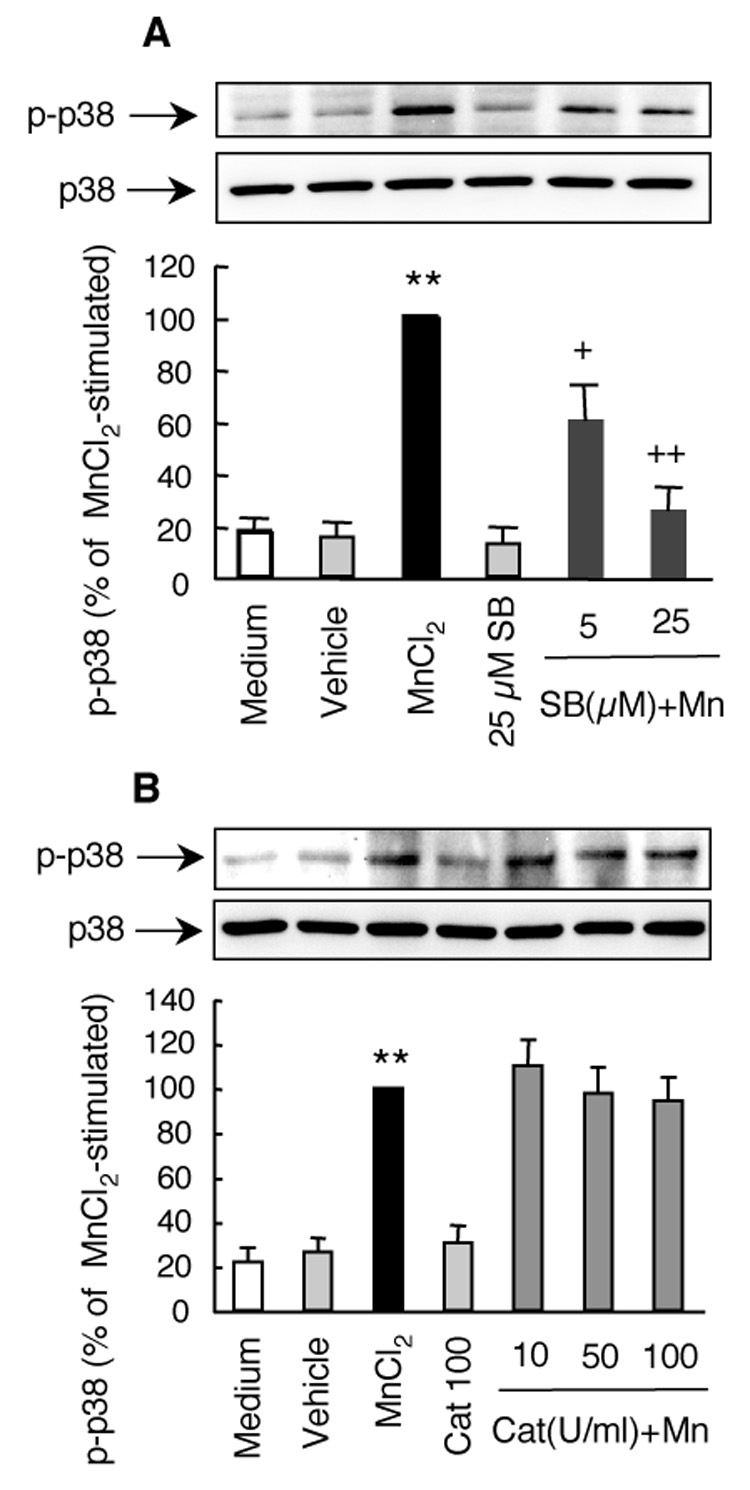
Effects of SB202190 and catalase on the MnCl2-stimulated p38 MAPK activation in HAPI cells. Cells were pretreated for 15 min with indicated concentrations of SB202190 (SB; A), or catalase (Cat; B) prior to treatment for 3 hr with 10 µM MnCl2. Control cells were treated with medium with vehicle control (0.05% DMSO). The representative Western blots of phospho-p38 MAPK (p-p38) and corresponding total p38 MAPK (p38) in the top panel were from one experiment. The bar graphs in the bottom panel were intensities of the phospho- p38 MAPK bands expressed as a percentage of that of the MnCl2-stimulated cells and are mean ± SEM from four (A) or three (B) experiments. **, p < 0.005 compared to the medium- or vehicle-treated control cells; +, p < 0.05; ++, p < 0.005 compared to the MnCl2-treated cells.
MnCl2-stimulated MAPK activation in primary microglia
Stimulation of microglia for 3 hr with 0–10 µM MnCl2 resulted in a concentration-dependent activation of ERK and p38 MAPK (Fig. 9). Similar to that observed for HAPI cells (Fig. 5B), stimulation with 1, 3.3, and 10 µM MnCl2 led to a respective and statistically significant 2.1, 2.8, and 3.7 fold increase in ERK activation in primary microglia (Fig. 9A). Significant activation of p38 MAPK was observed in primary microglia stimulated for 3 hr with 3.3 and 10 µM MnCl2, but not with 1 µM MnCl2 (Fig. 9B), similar to that observed in HAPI cells (Fig. 7B). Preincubation of primary microglia with 25 µM U0126 or SB202190 prior to stimulation with 10 µM MnCl2 for 3 hr nearly completely inhibited the MnCl2-stimulated activation of ERK (Fig. 9C) or p38 MAPK (Fig. 9D). The degree of inhibition by U0126 or SB202190 for MnCl2-stimulated activation of ERK or p38 MAPK observed here was more pronounced than that observed for MnCl2-stimulated H2O2 release (Fig. 4C).
Fig. 9.
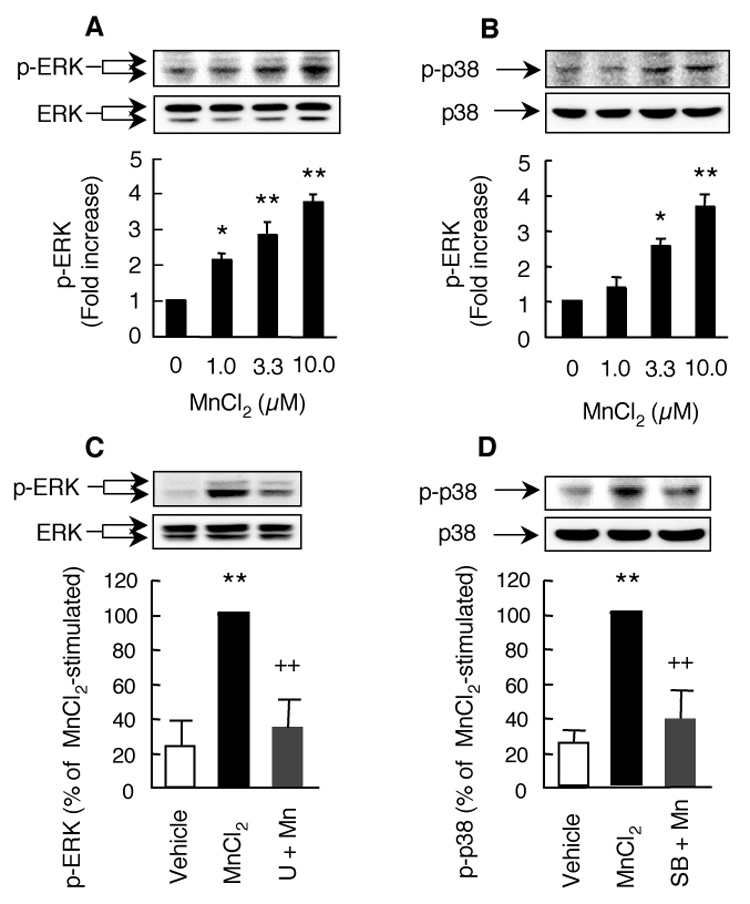
MnCl2-stimulated ERK and p38 MAPK activation in primary microglia. A and B. Microglia were stimulated with medium (0), or indicated concentrations MnCl2 for 3 hr and the activation of ERK (A) or p38 MAPK (B) was determined by Western blotting for phospho-ERK or phospho-p38 MAPK. C and D. Cells were pretreated for 15 min with 25 µM U0126 (U, C) or SB202190 (SB, D) prior to treatment for 3 hr with 10 µM MnCl2. Top panels are representative Western blots of phospho-ERK (p-ERK) or p38 MAPK (p-p38) and corresponding total ERK (ERK) or total p38 MAPK (p38) obtained from one experiment. The bar graphs were intensities of the phospho-EKR or phospho-p38 MAPK bands expressed as a fold over that of the control cells and are mean ± SEM from three experiments. *, p < 0.05; **, p < 0.005 compared to the control cells; ++, p < 0.005 compared to the MnCl2-treated cells.
Discussion
In this study, we have demonstrated that MnCl2, at low micromolar concentrations, stimulates a concentration- and time-dependent release of hydrogen peroxide (H2O2) in rat microglial cells and primary microglia (Fig. 1 and 4). Second, the ability for catalase to reduce, in a dose dependent manner, the H2O2 production (Fig. 2A) and the inability for SOD to affect H2O2 production (Fig. 2B) indicates that the predominant form of ROS released by MnCl2-stimulated microglia was hydrogen peroxide, but not superoxide free radical. Third, the absence of inhibitory effects by DPI and apocynin on the MnCl2-stimulated release of H2O2 in HAPI cells (Fig. 3) suggests a lack of direct involvement of NADPH oxidase, the major contributor to ROS generation in immune cells of the brain and peripheral system (Babior, 2004). Fourth, pharmacological inhibitor studies and immunoblotting analysis (Fig. 4–9) have revealed that ERK and p38 MAPK are intimately involved in the MnCl2-stimulated release of H2O2 in microglia. Fifth, the MnCl2-stimulated H2O2 release predominantly occurs in microglia but not astroglia. These results imply that activation of microglia may contribute to MnCl2-induced neurodegeneration through microglial generation of ROS and ERK and P38 MAPK play an important role in the modulation of the manganese-induced microglial activation.
MAPK kinases (ERK, JNK and p38 MAPK) play important roles in mediating a variety of cellular processes including differentiation, proliferation, and inflammatory responses through the coupling of extracellular signals to various intracellular pathways (Cuschieri and Maier 2005). ROS are known activators of members of the MAPK family, that is, MAPK activation is a downstream event of ROS production (McCubrey et al., 2006). In this study, however, the activity of ERK and p38-MAPK are found to exert a prominent influence on the MnCl2-induced H2O2 release in microglia. Inhibitors of ERK and p38-MAPK significantly reduced the MnCl2-induced H2O2 release (Fig. 3B, 3C). Analysis of the time courses for MnCl2-stimulated significant ERK and p38 MAPK activation (0.25 and 0.5 hr respectively; Fig. 5A, 7A) and that for MnCl2-stimulated H2O2 release (1 hr; Fig. 1) suggests that significant MAPK activation precedes significant H2O2 release. Although the detailed mechanisms responsible for the observed ERK- and p38-MAPK-influenced of H2O2 release in microglia stimulated with MnCl2 remains to be elucidated, we hypothesize that a slight and initial rise in intracellular ROS (possibly originated from mitochondria, see below) following manganese entry triggers the activation of ERK and p38-MAPK, perhaps similar to that observed for UVB-induced mitochondrial ROS generation and MAPK activation (Rezvani et al., 2007). Activation of MAPK has been shown to further enhance the production of ROS by mitochondria, thus creating a sefl-feeding loop of MAPK activation of ROS production inside the cells (Emre et al., 2007). Therefore, inhibition of MAPK activity would reduce the amount of ROS produced (this study; Martins Chaves et al., 2007). One of the consequences of prolonged elevation of intracellular ROS in microglia leads to the release of ROS in the form of H2O2 that could impact on neurons to induce oxidative stress. Extracellular ROS (i.e., H2O2) from MnCl2-stimulated microglia (this study), together with the rise in intra-neuronal ROS as a result of direct effect of manganese entry (Donaldson et al., 1982; HaMai and Bondy 2004) will eventually cause the demise of the affected neurons, contributing to the development of the movement disorders in manganesim.
One of the potential molecular mechanisms responsible for the MnCl2-stimulated release H2O2 in microglia may be the interference with mitochondrial oxidative phosphorylation. Gavin et al reported that manganese (Mn2+) directly interferes with oxidative phosphorylation through interaction with the F1 ATPase and complex I in the mitochondria (1992 and 1997). Inhibition of mitochondrial complex I is known to induce ROS generation (Greenamyre et al., 1999; Brookes 2005; Jezek and Hlavata, 2005). For example, Benard et al detected significant generation of superoxide in mitochondria and accumulation of H2O2 in the cytosol of cells treated with rotenone, a potent complex I inhibitor (2007). Whether mitochondrial complex I is the direct target of MnCl2 for H2O2 release in microglia remained to be determined. Furthermore, it should be also pointed out that although DPI and apocynin did not appear to affect the MnCl2-stimulated release H2O2 in microglia in this study, the involvement of NADPH oxidase inhibitors could not be ruled completely out. The use of microglia from NADPH oxidase gene knocked out mice will certainly provide additional evidence.
In this study, microglia are more responsive than astroglia to manganese-stimulated release of H2O2 (Fig. 4A). Whereas further studies are warranted to determine the underlying mechanisms for this difference, the known differential features of these two types of glia may offer some insight. First, astroglia are key to provide trophic support to neurons (Farina et al., 2006) and they appear to have an exceptionally elevated anti-oxidant capacity that can neutralize intracellular ROS without allowing ROS to be released to harm neurons (Langeveld et al., 1996; Sun et al., 2006). Astroglia can efficiently clear toxins such as methylmercury and peroxides through conjugation with glutathione (Fujiyama et al., 1994; Dringen et al., 1998). Second, astroglia and microglia may have different capacities to sequester manganese. Astroglia are known to have a high affinity transport system for manganese that may effectively sequester manganese as well as other essential or xenobiotic metals (Aschner et al., 1992; Tiffany-Castiglion and Qian 2001).
Manganese-induced parkinsonism has distinct features such as primary damage sites, clinical presentations and response to levo-dopa treatment compared to idiopathic PD (Olanow 2004). Nevertheless, a number of epidemiological studies have suggested that elevated environmental exposure to manganese in early life may promote the development of PD in late life by either increasing overall incidence of PD or reducing the onset age of the disease (Gorell et al., 1997 and 1999; Tan et al., 2003; Rachette et al., 2001 and 2005). This notion may bear more relevance in light of the potential multi-factorial etiology for this complex degenerative disease whereby chronic exposure to multiple environmental agents may promote the disease development process (Kidd 2000; Carvey et al., 2006).
In summary, this study provides evidence that highlights the potential role of microglial activation, through the release of free radicals, in the interaction between manganese and immune cells in the brains. Moreover, this study offers new insight into the potential mechanism of action for manganese-induced neurotoxicity.
Acknowledgements
This work was supported by a grant (ES013265) from the National Institute of Environmental Health Sciences of the National Institutes of Health. The authors declare that there exists no conflict of interest.
Abbreviations
- DMEM
Dulbecco’s modified Eagle’s medium
- DMEM/F12
DMEM/nutrient mixture F12 (1:1)
- DMSO
dimethyl sulfoxide
- DPI
diphenylene iodonium
- ERK
extracellular signal-regulated kinase
- FBS
fetal bovine serum
- HRP
horseradish peroxidase
- PBS
phosphate buffered saline
- PD
Parkinson’s disease
- SAPK/JNK
stress-activated protein kinase/c-Jun N-terminal kinase
- MAPK
mitogen-activated protein kinase
- SOD
superoxide dismutase
Footnotes
Publisher's Disclaimer: This is a PDF file of an unedited manuscript that has been accepted for publication. As a service to our customers we are providing this early version of the manuscript. The manuscript will undergo copyediting, typesetting, and review of the resulting proof before it is published in its final citable form. Please note that during the production process errors may be discovered which could affect the content, and all legal disclaimers that apply to the journal pertain.
References
- Aschner M, Gannon M, Kimelberg HK. Manganese uptake and efflux in cultured rat astrocytes. J. Neurochem. 1992;58:730–735. doi: 10.1111/j.1471-4159.1992.tb09778.x. [DOI] [PubMed] [Google Scholar]
- Aschner M, Erikson KM, Dorman DC. Manganese dosimetry: species differences and implications for neurotoxicity. Crit. Rev. Toxicol. 2005;35:1–32. doi: 10.1080/10408440590905920. [DOI] [PubMed] [Google Scholar]
- Autissier N, Rochette L, Dumas P, Beley A, Loireau A, Bralet J. Dopamine and norepinephrine turnover in various regions of the rat brain after chronic manganese chloride administration. Toxicology. 1982;24:175–182. doi: 10.1016/0300-483x(82)90055-5. [DOI] [PubMed] [Google Scholar]
- Babior BM. NADPH oxidase. Curr. Opin. Immunol. 2004;16:42–47. doi: 10.1016/j.coi.2003.12.001. [DOI] [PubMed] [Google Scholar]
- Barbeau A. Manganese and extrapyramidal disorders. Neurotoxicology. 1984;5:13–35. [PubMed] [Google Scholar]
- Benard G, Bellance N, James D, Parrone P, Fernandez H, Letellier T, Rossignol R. Mitochondrial bioenergetics and structural network organization. J. Cell Sci. 2007;120:838–848. doi: 10.1242/jcs.03381. [DOI] [PubMed] [Google Scholar]
- Bennett BL, Sasaki DT, Murray BW, O'Leary EC, Sakata ST, Xu W, Leisten JC, Motiwala A, Pierce S, Satoh Y, Bhagwat SS, Manning AM, Anderson DW. SP600125, an anthrapyrazolone inhibitor of Jun N-terminal kinase. Proc. Natl. Acad. Sci. U. S. A. 2001;98:13681–13686. doi: 10.1073/pnas.251194298. [DOI] [PMC free article] [PubMed] [Google Scholar]
- Bird ED, Anton AH, Bullock B. The effect of manganese inhalation on basal ganglia dopamine concentrations in rhesus monkey. Neurotoxicology. 1984;5:59–65. [PubMed] [Google Scholar]
- Bonilla E, Prasad AL. Effects of chronic manganese intake on the levels of biogenic amines in rat brain regions. Neurobehav. Toxicol. Teratol. 1984;6:341–344. [PubMed] [Google Scholar]
- Brookes PS. Mitochondrial H(+) leak and ROS generation: an odd couple. Free Radic. Biol. Med. 2005;38:12–23. doi: 10.1016/j.freeradbiomed.2004.10.016. [DOI] [PubMed] [Google Scholar]
- Carvey PM, Punati A, Newman MB. Progressive dopamine neuron loss in Parkinson's disease: the multiple hit hypothesis. Cell Transplant. 2006;15:239–250. doi: 10.3727/000000006783981990. [DOI] [PubMed] [Google Scholar]
- Cheepsunthorn P, Radov L, Menzies S, Reid J, Connor JR. Characterization of a novel brain-derived microglial cell line isolated from neonatal rat brain. Glia. 2001;35:53–62. doi: 10.1002/glia.1070. [DOI] [PubMed] [Google Scholar]
- Cuschieri J, Maier RV. Mitogen-activated protein kinase (MAPK) Crit. Care Med. 2005;33:417–419. doi: 10.1097/01.ccm.0000191714.39495.a6. [DOI] [PubMed] [Google Scholar]
- Davies SP, Reddy H, Caivano M, Cohen P. Specificity and mechanism of action of some commonly used protein kinase inhibitors. Biochem. J. 2000;351:95–105. doi: 10.1042/0264-6021:3510095. [DOI] [PMC free article] [PubMed] [Google Scholar]
- Desole MS, Esposito G, Migheli R, Sircana S, Delogu MR, Fresu L, Miele M, de Natale G, Miele E. Glutathione deficiency potentiates manganese toxicity in rat striatum and brainstem and in PC12 cells. Pharmacol. Res. 1997;36:285–292. doi: 10.1006/phrs.1997.0197. [DOI] [PubMed] [Google Scholar]
- Donaldson J, LaBella FS, Gesser D. Enhanced autoxidation of dopamine as a possible basis of manganese neurotoxicity. Neurotoxicology. 1981;2:53–56. [PubMed] [Google Scholar]
- Donaldson J, McGregor D, LaBella F. Manganese neurotoxicity: a model for free radical mediated neurodegeneration? Can. J. Physiol. Pharmacol. 1982;60:1398–1405. doi: 10.1139/y82-208. [DOI] [PubMed] [Google Scholar]
- Dringen R, Kussmaul L, Hamprecht B. Rapid clearance of tertiary butyl hydroperoxide by cultured astroglial cells via oxidation of glutathione. Glia. 1998;23:139–145. doi: 10.1002/(sici)1098-1136(199806)23:2<139::aid-glia5>3.0.co;2-1. [DOI] [PubMed] [Google Scholar]
- Dukhande VV, Malthankar-Phatak GH, Hugus JJ, Daniels CK, Lai JC. Manganese-induced neurotoxicity is differentially enhanced by glutathione depletion in astrocytoma and neuroblastoma cells. Neurochem. Res. 2006;31:1349–1345. doi: 10.1007/s11064-006-9179-7. [DOI] [PubMed] [Google Scholar]
- Emre Y, Hurtaud C, Nubel T, Criscuolo F, Ricquier D, Cassard-Doulcier AM. Mitochondria contribute to LPS-induced MAPK activation via uncoupling protein UCP2 in macrophages. Biochem. J. 2007;402:271–278. doi: 10.1042/BJ20061430. [DOI] [PMC free article] [PubMed] [Google Scholar]
- Eriksson H, Magiste K, Plantin LO, Fonnum F, Hedstrom KG, Theodorsson-Norheim E, Kristensson K, Stalberg E, Heilbronn E. Effects of manganese oxide on monkeys as revealed by a combined neurochemical, histological and neurophysiological evaluation. Arch. Toxicol. 1987;61:46–52. doi: 10.1007/BF00324547. [DOI] [PubMed] [Google Scholar]
- Facchinetti F, Dawson VL, Dawson TM. Free radicals as mediators of neuronal injury. Cell. Mol. Neurobiol. 1998;18:667–682. doi: 10.1023/A:1020685903186. [DOI] [PMC free article] [PubMed] [Google Scholar]
- Farina C, Aloisi F, Meinl E. Astrocytes are active players in cerebral innate immunity. Trends Immunol. 2006;28:138–145. doi: 10.1016/j.it.2007.01.005. [DOI] [PubMed] [Google Scholar]
- Favata MF, Horiuchi KY, Manos EJ, Daulerio AJ, Stradley DA, Feeser WS, Van Dyk DE, Pitts WJ, Earl RA, Hobbs F, Copeland RA, Magolda RL, Scherle PA, Trzaskos JM. Identification of a novel inhibitor of mitogen-activated protein kinase kinase. J. Biol. Chem. 1998;273:18623–18632. doi: 10.1074/jbc.273.29.18623. [DOI] [PubMed] [Google Scholar]
- Fujiyama J, Hirayama K, Yasutake A. Mechanism of methylmercury efflux from cultured astrocytes. Biochem. Pharmacol. 1994;47:1525–1530. doi: 10.1016/0006-2952(94)90527-4. [DOI] [PubMed] [Google Scholar]
- Gavin CE, Gunter KK, Gunter TE. Mn2+ sequestration by mitochondria and inhibition of oxidative phosphorylation. Toxicol. Appl. Pharmacol. 1992;115:1–5. doi: 10.1016/0041-008x(92)90360-5. [DOI] [PubMed] [Google Scholar]
- Gavin CE, Gunter KK, Gunter TE. Manganese and calcium transport in mitochondria: implications for manganese toxicity. Neurotoxicology. 1999;20:445–453. [PubMed] [Google Scholar]
- Gorell JM, Johnson CC, Rybicki BA, Peterson EL, Kortsha GX, Brown GG, Richardson RJ. Occupational exposures to metals as risk factors for Parkinson's disease. Neurology. 1997;48:650–658. doi: 10.1212/wnl.48.3.650. [DOI] [PubMed] [Google Scholar]
- Gorell JM, Johnson CC, Rybicki BA, Peterson EL, Kortsha GX, Brown GG, Richardson RJ. Occupational exposure to manganese, copper, lead, iron, mercury and zinc and the risk of Parkinson's disease. Neurotoxicology. 1999;20:239–247. [PubMed] [Google Scholar]
- Greenamyre JT, MacKenzie G, Peng TI, Stephans SE. Mitochondrial dysfunction in Parkinson's disease. Biochem. Soc. Symp. 1999;66:85–97. doi: 10.1042/bss0660085. [DOI] [PubMed] [Google Scholar]
- HaMai D, Bondy SC. Oxidative basis of manganese neurotoxicity. Ann. N. Y. Acad. Sci. 2004;1012:129–141. doi: 10.1196/annals.1306.010. [DOI] [PubMed] [Google Scholar]
- Irani K, Xia Y, Zweier JL, Sollott SJ, Der CJ, Fearon ER, Sundaresan M, Finkel T, Goldschmidt-Clermont PJ. Mitogenic signaling mediated by oxidants in Ras-transformed fibroblasts. Science. 1997;275:1649–1652. doi: 10.1126/science.275.5306.1649. [DOI] [PubMed] [Google Scholar]
- Jezek P, Hlavata L. Mitochondria in homeostasis of reactive oxygen species in cell, tissues, and organism. Int. J. Biochem. Cell Biol. 2005;37:2478–2503. doi: 10.1016/j.biocel.2005.05.013. [DOI] [PubMed] [Google Scholar]
- Johnson GL, Lapadat R. Mitogen-activated protein kinase pathways mediated by ERK, JNK, and p38 protein kinases. Science. 2002;298:1911–1912. doi: 10.1126/science.1072682. [DOI] [PubMed] [Google Scholar]
- Kidd PM. Parkinson's disease as multifactorial oxidative neurodegeneration: implications for integrative management. Altern. Med. Rev. 2000;5:502–529. [PubMed] [Google Scholar]
- Kim WG, Mohney RP, Wilson B, Jeohn GH, Liu B, Hong JS. Regional difference in susceptibility to lipopolysaccharide-induced neurotoxicity in the rat brain: role of microglia. J. Neurosci. 2000;20:6309–6316. doi: 10.1523/JNEUROSCI.20-16-06309.2000. [DOI] [PMC free article] [PubMed] [Google Scholar]
- Komura J, Sakamoto M. Effects of manganese forms on biogenic amines in the brain and behavioral alterations in the mouse: long-term oral administration of several manganese compounds. Environ. Res. 1992;57:34–44. doi: 10.1016/s0013-9351(05)80017-9. [DOI] [PubMed] [Google Scholar]
- Langeveld CH, Schepens E, Jongenelen CA, Stoof JC, Hjelle OP, Ottersen OP, Drukarch B. Presence of glutathione immunoreactivity in cultured neurons and astrocytes. Neuroreport. 1996;7:1833–1836. doi: 10.1097/00001756-199607290-00029. [DOI] [PubMed] [Google Scholar]
- Lawson LJ, Perry VH, Dri P, Gordon S. Heterogeneity in the distribution and morphology of microglia in the normal adult mouse brain. Neuroscience. 1990;39:151–170. doi: 10.1016/0306-4522(90)90229-w. [DOI] [PubMed] [Google Scholar]
- Liu B, Wang K, Gao HM, Mandavilli B, Wang JY, Hong JS. Molecular consequences of activated microglia in the brain: overactivation induces apoptosis. J. Neurochem. 2001;77:182–189. doi: 10.1046/j.1471-4159.2001.t01-1-00216.x. [DOI] [PubMed] [Google Scholar]
- Liu B, Gao HM, Hong JS. Parkinson's disease and exposure to infectious agents and pesticides and the occurrence of brain injuries: role of neuroinflammation. Environ. Health Perspect. 2003;8:1065–1073. doi: 10.1289/ehp.6361. [DOI] [PMC free article] [PubMed] [Google Scholar]
- Liu B. Modulation of microglial pro-inflammatory and neurotoxic activity for the treatment of Parkinson's disease. AAPS J. 2006;8:606–621. doi: 10.1208/aapsj080369. [DOI] [PMC free article] [PubMed] [Google Scholar]
- Marinho CR, Manso CF. O2 generation during neuromelanin synthesis. The action of manganese Acta Med. Port. 1993;6:547–554. [PubMed] [Google Scholar]
- Martin CJ. Manganese neurotoxicity: connecting the dots along the continuum of dysfunction. Neurotoxicology. 2006;27:347–349. doi: 10.1016/j.neuro.2005.11.002. [DOI] [PubMed] [Google Scholar]
- Martins Chaves M, Caldeira Costa D, Costa Telhado Pereira C, Andrade TR, Horta BC, Nogueira-Machado JA. Role of inositol 1,4,5-triphosphate and p38 mitogen-activated protein kinase in reactive oxygen species generation by granulocytes in a cyclic AMP-dependent manner: an age-related phenomenon. Gerontology. 2007;53:228–233. doi: 10.1159/000100960. [DOI] [PubMed] [Google Scholar]
- McCubrey JA, Lahair MM, Franklin RA. Reactive oxygen species-induced activation of the MAP kinase signaling pathways. Antioxid. Redox Signal. 2006;8:1775–1789. doi: 10.1089/ars.2006.8.1775. [DOI] [PubMed] [Google Scholar]
- McGeer PL, McGeer EG. Inflammation and neurodegeneration in Parkinson's disease. Parkinsonism Relat. Disord. 2004;10:S3–S7. doi: 10.1016/j.parkreldis.2004.01.005. [DOI] [PubMed] [Google Scholar]
- Olanow CW. Manganese-induced parkinsonism and Parkinson's disease. Ann. N. Y. Acad. Sci. 2004;1012:209–223. doi: 10.1196/annals.1306.018. [DOI] [PubMed] [Google Scholar]
- Racette BA, McGee-Minnich L, Moerlein SM, Mink JW, Videen TO, Perlmutter JS. Welding-related parkinsonism: clinical features, treatment, and pathophysiology. Neurology. 2001;56:8–13. doi: 10.1212/wnl.56.1.8. [DOI] [PubMed] [Google Scholar]
- Racette BA, Tabbal SD, Jennings D, Good L, Perlmutter JS, Evanoff B. Prevalence of parkinsonism and relationship to exposure in a large sample of Alabama welders. Neurology. 2005;64:230–235. doi: 10.1212/01.WNL.0000149511.19487.44. [DOI] [PubMed] [Google Scholar]
- Rezvani HR, Dedieu S, North S, Belloc F, Rossignol R, Letellier T, de Verneuil H, Taieb A, Mazurier F. Hypoxia-inducible factor-1{alpha}, a key factor in the keratinocyte response to UVB exposure. J. Biol. Chem. 2007;282:16413–16422. doi: 10.1074/jbc.M611397200. [DOI] [PubMed] [Google Scholar]
- Shi XL, Dalal NS. The glutathionyl radical formation in the reaction between manganese and glutathione and its neurotoxic implications. Med. Hypotheses. 1990;33:83–87. doi: 10.1016/0306-9877(90)90184-g. [DOI] [PubMed] [Google Scholar]
- Stokes AH, Lewis DY, Lash LH, Jerome WG, Grant KW, Aschner M, Vrana KE. Dopamine toxicity in neuroblastoma cells: role of glutathione depletion by L-BSO and apoptosis. Brain Res. 2000;858:1–8. doi: 10.1016/s0006-8993(99)02329-x. [DOI] [PubMed] [Google Scholar]
- Stolk J, Hiltermann TJ, Dijkman JH, Verhoeven AJ. Characteristics of the inhibition of NADPH oxidase activation in neutrophils by apocynin, a methoxy-substituted catechol. Am. J. Respir. Cell. Mol. Biol. 1994;11:95–102. doi: 10.1165/ajrcmb.11.1.8018341. [DOI] [PubMed] [Google Scholar]
- Stredrick DL, Stokes AH, Worst TJ, Freeman WM, Johnson EA, Lash LH, Aschner M, Vrana KE. Manganese-induced cytotoxicity in dopamine-producing cells. Neurotoxicology. 2004;25:543–553. doi: 10.1016/j.neuro.2003.08.006. [DOI] [PubMed] [Google Scholar]
- Sun X, Shih AY, Johannssen HC, Erb H, Li P, Murphy TH. Two-photon imaging of glutathione levels in intact brain indicates enhanced redox buffering in developing neurons and cells at the cerebrospinal fluid and blood-brain interface. J. Biol. Chem. 2006;281:17420–17431. doi: 10.1074/jbc.M601567200. [DOI] [PubMed] [Google Scholar]
- Tan EK, Tan C, Fook-Chong SM, Lum SY, Chai A, Chung H, Shen H, Zhao Y, Teoh ML, Yih Y, Pavanni R, Chandran VR, Wong MC. Dose-dependent protective effect of coffee, tea, and smoking in Parkinson's disease: a study in ethnic Chinese. J. Neurol. Sci. 2003;216:163–167. doi: 10.1016/j.jns.2003.07.006. [DOI] [PubMed] [Google Scholar]
- Tiffany-Castiglion E, Qian Y. Astroglia as metal depots: molecular mechanisms for metal accumulation, storage and release. Neurotoxicology. 2001;22:577–592. doi: 10.1016/s0161-813x(01)00050-x. [DOI] [PubMed] [Google Scholar]
- Vila M, Jackson-Lewis V, Guegan C, Wu DC, Teismann P, Choi DK, Tieu K, Przedborski S. The role of glial cells in Parkinson's disease. Curr. Opin. Neurol. 2001;14:483–489. doi: 10.1097/00019052-200108000-00009. [DOI] [PubMed] [Google Scholar]
- Wang T, Qin L, Liu B, Liu Y, Wilson B, Eling TE, Langenbach R, Taniura S, Hong JS. Role of reactive oxygen species in LPS-induced production of prostaglandin E2 in microglia. J. Neurochem. 2004;88:939–947. doi: 10.1046/j.1471-4159.2003.02242.x. [DOI] [PubMed] [Google Scholar]
- Zhang P, Wang YZ, Kagan E, Bonner JC. Peroxynitrite targets the epidermal growth factor receptor, Raf-1, and MEK independently to activate MAPK. J. Biol. Chem. 2000;275:22479–22486. doi: 10.1074/jbc.M910425199. [DOI] [PubMed] [Google Scholar]
- Zhou M, Diwu Z, Panchuk-Voloshina N, Haugland RP. A stable nonfluorescent derivative of resorufin for the fluorometric determination of trace hydrogen peroxide: applications in detecting the activity of phagocyte NADPH oxidase and other oxidases. Anal. Biochem. 1997;253:162–168. doi: 10.1006/abio.1997.2391. [DOI] [PubMed] [Google Scholar]