

Abstract
Context
Given the seemingly disparate nature of popular weight-loss diets (WLDs), consumers may have a difficult time choosing one. We hypothesized that because most of these diets differ greatly from the way most Americans spontaneously eat, the choice of a WLD may be less critical than the decision to adopt any WLD.
Objective
To assess the degree of similarity among several popular WLDs and that between average diets of Americans and the WLDs as a whole.
Design
One-day menus were randomly selected or constructed from 16 popular diet books (resulting in 17 distinct diets). Usual dietary intakes of individuals were derived from the Continuing Survey of Food Intakes by Individuals (CSFII) 1994–96, 1998.
Main Outcome Measures
Euclidean distances, based on 12 dietary variables, were calculated among the popular WLDs, as well as between the WLDs and intakes from the CSFII.
Results
Euclidean distances among the WLDs ranged from 1.99 to 15.24, with a mean of 6.12 ± 2.83. Mean distance between individuals' intakes from the CSFII and the closest WLD was 3.63 ± 1.24, while the mean distance between individuals' intakes and the farthest WLD was 10.58 ± 1.10. Mean distance between individuals' intakes and the WLDs considered together was 6.04 ± 1.10.
Conclusions
While the mean Euclidean distances between individuals' intakes and popular WLDs demonstrated meaningful differences, the differences among the WLDs were slightly greater and, in multivariate space, surrounded the diets consumed by Americans. This may have implications for the selection of a WLD in persons seeking to lose weight.
Introduction
The prevalence of obesity has increased dramatically over the past 30 years. Approximately two thirds (66.2%) of US adults age 20–74 years were overweight or obese in the period 2003–04, compared with 47.1% in the period 1976–80. Almost one third of US adults were obese as of 2003–04, compared with only 15.0% in 1976–80.[1] A proliferation of popular weight-loss diets (WLDs) has coincided with the increased prevalence of overweight/obesity. Popular diet books are purchased by millions of Americans, as evidenced by their almost constant presence on the New York Times Best Sellers List for advice books.[2] Even though these diets may vary greatly in macronutrient content and in other dimensions, it is not clear how much the WLDs actually differ from one another relative to the degree to which they differ (when considered together) from the usual diets of Americans.
There are substantial differences among popular WLDs. Some diets severely restrict fat intake,[3] while others restrict carbohydrate intake while allowing liberal intake of fat.[4] Still others are selective in the types of carbohydrates that they allow.[5] In reaction, consumers and media pundits have expressed the view that deciding on a course of action for weight loss is all but impossible because of the difficulty in choosing among seemingly widely disparate popular diets.
However, despite some marked disparities in rhetoric, virtually all WLDs have important features in common. For example, we know of no popular diet that recommends or allows unlimited consumption of foods such as French fried potatoes, candy, or ice cream. Because of the common aspects of all popular WLDs, we conjectured that if the average American randomly picked any popular WLD, it would likely be more similar to any other popular WLD than their current diet. Were this the case, those trying to lose weight could be advised that any WLD may be more effective than the diet they are currently consuming. Specifically, we hypothesized that the differences among popular WLDs would be relatively small compared with the differences between usual individual intakes and the WLDs considered together. This would suggest that the choice of a specific WLD would be less critical to weight loss efforts than simply the decision to go on any WLD. Using statistical methods, we assessed the similarities among several popular diets and the similarity between average diets of Americans and the popular diets.
Material and Methods
Diets
We included 16 diet books and 17 WLDs (both vegetarian and non-vegetarian versions of Eat to Live) in the analysis (Table 1). Diets were included on the basis of the availability of a popular book published within the previous 10 years, authored by an “expert” (liberally defined) in the field.[3–18]
Table 1.
Popular Weight-Loss Diets Included in the Analysis
| Title of Book | Author(s) | Year published |
|---|---|---|
| The South Beach Diet: The Delicious, Doctor-Designed, Foolproof Plan for Fast and Healthy Weight Loss | Arthur Agatston, MD | 2003 |
| Weigh Less, Live Longer: Dr. Lou Aronne's “Getting Healthy” Plan for Permanent Weight Control | Louis J. Aronne, MD | 1997 |
| Dr. Atkins' New Diet Revolution | Robert C. Atkins, MD | 2002 |
| The LEARN Program for Weight Control | Kelly D. Brownell, PhD | 2000 |
| Losing Weight for Good: Developing Your Personal Plan of Action | Lawrence J. Cheskin, MD | 1997 |
| Eat to Live: The Revolutionary Formula for Fast and Sustained Weight Loss | Joel Fuhrman, MD | 2003 |
| The Resolution Diet: Keeping the Promise of Permanent Weight Loss | David Heber, MD, PhD | 1999 |
| Mayo Clinic on Healthy Weight | Donald D. Hensrud, MD | 2000 |
| Dr. Kushner's Personality Type Diet | Robert F. Kushner, MD Nancy Kushner, MSN, RN | 2003 |
| Eat More, Weigh Less: Dr. Dean Ornish's Life Choice Program for Losing Weight Safely While Eating Abundantly | Dean Ornish, MD | 1997 |
| The Pritikin Weight Loss Breakthrough: Five Easy Steps to Outsmart Your Fat Instinct | Robert Pritikin | 1998 |
| The Volumetrics Weight-Control Plan: Feel Full on Fewer Calories | Barbara Rolls, PhD Robert A. Barnett | 2000 |
| The Zone | Barry Sears, PhD | 2000 |
| The New Sugar Busters! Cut Sugar to Trim Fat | H. Leighton Steward Sam S. Andrews, MD Morrison C. Bethea, MD Luis A. Balart, MD | 2003 |
| Balance Your Body, Balance Your Life: Dr. Taub's 28-Day Permanent Weight Loss Plan | Edward A. Taub, MD | 1999 |
| EatRight Heart Smart | Roland L. Weinsier, MD, DrPH | 1998 |
Diet Analysis
A 1-day menu for each diet was randomly selected from the sample menus (within a randomly selected phase of a diet, where applicable) presented in the diet books. When sample menus were not available, a representative 1-day menu based on the particular diet's guidelines and recommendations was constructed by the investigators. The diets were compared on 12 variables: energy, percent of energy from fat, percent of energy from saturated fatty acids, percent of energy from monounsaturated fatty acids, percent of energy from polyunsaturated fatty acids, cholesterol, total dietary fiber, calcium, vitamin E, total folate, sodium, and glycemic load (GL). These variables were chosen on the basis of their associations with disease risk in previous studies,[19,20] their inclusion in well-known dietary guidelines,[21] or stated importance in many weight-loss plans.
With the exception of GL, nutrient analyses of the sample menus of each diet were conducted using the Nutrition Data System for Research (NDS-R), version 4.05_33 (2002), developed by the Nutrition Coordinating Center at the University of Minnesota.[22] NDS-R uses the United States Department of Agriculture (USDA) Nutrient Database for Standard Reference and its periodic revisions as the primary data source and is supplemented by information from the scientific literature and food manufacturers. The output provides values for more than 130 nutrients.
The investigators used published methods to calculate GL.[23] Briefly, to determine GL for a 1-day menu, all carbohydrate-containing foods were identified. Each food was assigned a glycemic index (GI) value from a published table of GI values,[24] using glucose as the reference food. For foods with no published GI values, values were imputed on the basis of published values of foods judged to be similar. Foods with no published GI values containing little carbohydrate (eg, meats, poultry, fish, cheese, eggs, and salad vegetables) were not included in the GL calculations due to their minimal glycemic effect. When there were multiple GI values listed for a given food in the GI table, the mean GI value was assigned. An exception to this was in the case of brand-name foods: if a GI value for a brand-name food was available, this was used instead of a mean value. The GL of an individual food was calculated by multiplying the GI value of the food by the number of grams of available carbohydrate per serving size specified by the diet and then dividing by 100.[24] The GLs of all carbohydrate-containing foods in the menu were summed, resulting in the overall GL for the 1-day menu.[23]
Assessment of Usual Dietary Intake of Individuals
Usual dietary intake for individuals was derived from the Continuing Survey of Food Intakes by Individuals (CSFII) 1994–96, 1998. The CSFII is a national survey conducted by the Agricultural Research Service of the USDA . The CSFII 1994–96, 1998 provided information on 2-day food and nutrient intakes by 20,607 persons of all ages. Data collection in the 1994 to 1996 portion of the survey included persons of all ages in a nationally representative sample of noninstitutionalized persons residing in households in the United States, in each of 40 analytic domains defined by sex, age, and income level. Information on dietary intake was obtained with the use of 2 nonconsecutive 24-hour dietary recalls administered in person by a trained interviewer.[25] The nutrient database for the CSFII 1994–96, 1998 contains values for more than 50 nutrients, including the nutrients of interest in this analysis. GL values for foods reported on the survey were recently added as part of a study to add GI and GL values to the nutrient database for a commonly used dietary assessment instrument, the National Cancer Institute's Diet History Questionnaire.[26]
Statistical Analysis
For the purposes of this study, only CSFII data for individuals 18 years of age and older were included. This resulted in a CSFII sample size of 9582 individuals. The 2 days of intake data for each individual were averaged.
Because we were interested in measuring the distance between reported dietary intake from the CSFII and recommended dietary intake based on the 17 popular WLDs, as well as the distances among the WLDs, Euclidean distances were calculated. Euclidean distance measures the distance from one multivariate observation to another without regard to the correlations among the variables (see reference 27 for further clarification).
We began by calculating the sample mean and standard deviation for each nutrient intake variable based upon the 9582 individuals from the CSFII. Each variable was standardized using its respective sample mean and standard deviation. Specifically, a standardized variable (Zij) for the ith subject on the jth variable was calculated as:
where Yij represents the value of the jth nutrient value for individual i,  represents the sample mean of the jth nutrient variable, and
  represents the sample standard deviation of the jth nutrient variable. Similarly, a standardized variable (Zkj) for the kth diet was calculated as:
where Ykj represents the recommended value of the jth nutrient as estimated from the sample menu for the kth diet, represents the sample mean of the jth nutrient variable based on the person level information from the CSFII data, and represents the sample standard deviation of the jth nutrient variable based on person information. Euclidean distance between a person's reported intake and a popular diet's recommended intake was then calculated as:
 |
These distances were used to rank the closeness of individuals' reported intakes to those recommended by the WLDs. The distance between 2 WLDs, k and k', was calculated as:
To compare the median recommended nutrient intake to the median reported dietary intake of nutrients, Wilcoxon rank sum tests were used. A Bonferroni correction was applied to control the experiment-wise Type I error rate.
Results
Comparison of the WLDs and CSFII Data
A comparison of the 12 dietary variables of interest showed that the WLDs varied widely among the variables analyzed (Table 2). For example, energy intake varied from 753 kcal/d (Eat to Live, vegetarian for aggressive weight loss) to 2221 kcal/d (Zone); saturated fat intake ranged from 2.3% (Ornish) to 23.7% (Atkins); and calcium varied from 441 mg/d (Atkins) to 1676 mg/d (Zone). In addition, for the most part there was a wide discrepancy in mean amounts calculated from sample menus of the WLDs and actual intake by individuals calculated using CSFII 1994–96, 1998 data (Table 3). Dietary factors positively associated with disease risk in previous studies ranged from 18.5% (total fat) to 55.9% (GL) higher in individuals compared with the WLDs. Dietary factors inversely associated with disease risk ranged from 40.3 % (dietary fiber) to 52.7% (folate) lower in individuals compared with the WLDs. There were no statistically significant differences in energy, polyunsaturated fat, cholesterol, vitamin E, calcium, or sodium between individuals' intakes and the WLDs.
Table 2.
A Comparison of the Popular Weight-Loss Diets
| Variable | SoB1 | Ar2 | At3 | LE | Ch4 | EL5 | EL6 | Re | Ma7 | Ku | Or | Pr8 | Vo | Zo | SB | Ta | ER9 |
|---|---|---|---|---|---|---|---|---|---|---|---|---|---|---|---|---|---|
| Energy, kcal/d | 1263 | 1082 | 1766 | 1574 | 1311 | 753 | 1701 | 1251 | 1048 | 1303 | 1815 | 1837 | 1461 | 2221 | 1377 | 2190 | 1388 |
| Total fat, % en | 50.7 | 15.8 | 68.0 | 19.5 | 21.7 | 25.6 | 23.8 | 18.2 | 20.0 | 23.0 | 14.7 | 17.1 | 16.4 | 50.8 | 39.9 | 25.8 | 26.1 |
| SFA, % en | 14.6 | 3.9 | 23.7 | 7.2 | 6.2 | 3.5 | 3.8 | 4.4 | 3.7 | 10.2 | 2.3 | 4.7 | 4.5 | 13.4 | 12.9 | 6.1 | 9.4 |
| MUFA, % en | 26.2 | 6.0 | 30.4 | 7.3 | 9.9 | 7.6 | 6.9 | 7.4 | 7.8 | 7.9 | 3.2 | 4.6 | 5.3 | 18.5 | 13.7 | 11.7 | 7.3 |
| PUFA, % en | 5.9 | 4.1 | 8.5 | 2.5 | 3.5 | 12.1 | 10.2 | 4.2 | 6.7 | 3.3 | 7.5 | 6.1 | 4.5 | 15.1 | 9.4 | 5.8 | 7.4 |
| Cholesterol, mg/d | 612 | 84 | 730 | 258 | 136 | 0 | 51 | 135 | 69 | 69 | 2 | 160 | 100 | 336 | 519 | 120 | 86 |
| Dietary fiber, g/d | 7.4 | 26.0 | 8.3 | 31.7 | 18.2 | 25.3 | 49.1 | 24.6 | 17.7 | 18.2 | 51.5 | 21.1 | 31.9 | 23.5 | 24.1 | 39.3 | 29.8 |
| Vitamin E, mg/d | 12.3 | 6.9 | 9.7 | 6.3 | 4.5 | 2.9 | 4.9 | 17.0 | 3.9 | 26.5 | 6.2 | 4.8 | 7.4 | 11.0 | 7.0 | 7.5 | 11.5 |
| Folate, µg/d | 372 | 365 | 384 | 732 | 206 | 410 | 857 | 721 | 271 | 312 | 1318 | 374 | 237 | 744 | 594 | 756 | 410 |
| Calcium, mg/d | 887 | 806 | 441 | 1341 | 975 | 555 | 1027 | 984 | 805 | 1610 | 1449 | 556 | 888 | 1676 | 652 | 702 | 1033 |
| Sodium, mg/d | 4281 | 2041 | 3794 | 2923 | 4804 | 1115 | 1641 | 1787 | 1808 | 3183 | 3280 | 4323 | 3776 | 5586 | 2319 | 3964 | 3517 |
| Glycemic load | 4.5 | 57.8 | 4.6 | 101.8 | 98.2 | 26.3 | 87.6 | 115.4 | 85.0 | 87.4 | 115.1 | 173.2 | 122.8 | 38.1 | 42.8 | 124.4 | 63.9 |
SoB = South Beach; Ar = Aronne; At = Atkins; LE = LEARN; Ch = Cheskin; EL = Eat to Live; Re = Resolution; Ma = Mayo; Ku = Kushner; Or = Ornish; Pr = Pritikin; Vo = Volumetrics; Zo = Zone; SB = Sugar Busters; Ta = Taub; ER = EatRight; SFA = saturated fatty acids; MUFA = monounsaturated fatty acids; PUFA = polyunsaturated fatty acids.
Phase one.
Menu plan I (1200 kcal/d).
Induction phase.
Menu 1 (1200–1400 kcal/d).
Meal plan 1 (vegetarian; for aggressive weight loss).
Meal plan 2 (non-vegetarian; for moderate weight loss).
1200 kcal/d diet.
“Better Still” menu plan.
Meal pattern 1.
Table 3.
A Comparison of the Popular Weight-Loss Diets and Dietary Intake in Individuals From the CSFII 1994–96, 19981
| Popular diets (n = 17) | CSFII 1994–96, 1998 (n = 9582) | |||||
|---|---|---|---|---|---|---|
| Variable | Mean ± SD (median) | Min-Max | Mean ± SD (median) | Min-Max | % Difference of CSFII from popular diets | P |
| Energy, kcal/d | 1491 ± 394 (1388) | 753–2221 | 1952 ± 848 (1805) | 184–13,297 | 30.9 | .0129 |
| Total fat, % en | 28.1 ± 15.2 (23.0) | 14.7–68.0 | 33.3 ± 7.9 (33.5) | 1.1–67.8 | 18.5 | .0018* |
| Saturated fat, % en | 7.9 ± 5.6 (6.1) | 2.3–23.7 | 11.1 ± 3.4 (11.0) | 0.2–29.9 | 40.5 | .0007* |
| Monounsaturated fat, % en | 10.7 ± 7.6 (7.6) | 3.2–30.4 | 12.7 ± 3.5 (12.8) | 0.5–29.0 | 18.7 | .0013* |
| Polyunsaturated fat, % en | 6.9 ± 3.4 (6.1) | 2.5–15.1 | 6.8 ± 2.6 (6.5) | 0.3–26.5 | −1.4 | .7543 |
| Cholesterol, mg/d | 204 ± 218 (120) | 0–730 | 270 ± 184 (224) | 0–2701 | 32.4 | .0132 |
| Dietary fiber, g/d | 26.3 ± 12.1 (24.6) | 7.4–51.5 | 15.7 ± 8.6 (14.1) | 0.6–120 | −40.3 | < .0001* |
| Vitamin E, mg/d | 8.8 ± 5.8 (7.0) | 2.9–26.5 | 8.1 ± 6.1 (6.9) | 0.2–155.9 | −8.3 | .5788 |
| Folate, µg/d | 533 ± 289 (410) | 206–1318 | 252 ± 159 (217) | 10–2273 | −52.7 | < .0001* |
| Calcium, mg/d | 964 ± 366 (887) | 441–1676 | 734 ± 430 (648) | 47–4904 | −23.9 | .0054 |
| Sodium, mg/d | 3185 ± 1249 (3280) | 1115–5586 | 3296 ± 1570 (3046) | 69–22,266 | 3.5 | .9516 |
| Glycemic load | 79.4 ± 46.2 (87.4) | 4.5–173.2 | 123.8 ± 58.0 (114) | 7.6–662.1 | 55.9 | .0021* |
Significant after a Bonferroni correction.
Euclidean Distances Among the WLDs
The Euclidean distances among the WLDs ranged from 1.99 (Aronne and Volumetrics) to 15.24 (Atkins and Ornish) (Table 4). EatRight was closest to the other diets, with a mean Euclidean distance from the other diets of 4.59 ± 2.21, while Atkins was farthest, with a mean distance from the other diets of 10.92 ± 2.62. The mean distance among all diets was 6.12 ± 2.83.
Table 4.
Euclidean Distances Between the Popular Weight-Loss Diets
| Diet | Ar | At | LE | Ch | EL1 | EL2 | Re | Ma | Ku | Or | Pr | Vo | Zo | SB | Ta | ER | Mean ± SD |
|---|---|---|---|---|---|---|---|---|---|---|---|---|---|---|---|---|---|
| SoB | 9.01 | 4.06 | 8.64 | 7.53 | 8.85 | 10.22 | 8.88 | 8.42 | 8.03 | 12.59 | 9.26 | 9.30 | 5.86 | 5.12 | 8.17 | 7.67 | 8.22 ± 2.01 |
| Ar | – | 12.29 | 3.33 | 2.86 | 3.62 | 4.96 | 3.06 | 1.83 | 4.53 | 7.20 | 2.94 | 1.99 | 8.82 | 5.80 | 4.28 | 2.88 | 4.96 ± 2.95 |
| At | – | – | 11.74 | 10.89 | 11.61 | 12.79 | 12.11 | 11.63 | 11.25 | 15.24 | 12.28 | 12.47 | 7.42 | 7.39 | 10.95 | 10.60 | 10.92 ± 2.62 |
| LE | – | – | – | 4.12 | 5.43 | 4.15 | 2.62 | 4.29 | 4.82 | 5.33 | 3.97 | 3.70 | 7.73 | 5.22 | 2.95 | 3.38 | 5.09 ± 2.40 |
| Ch | – | – | – | – | 4.85 | 6.48 | 4.49 | 2.59 | 4.33 | 8.66 | 2.87 | 2.47 | 7.96 | 5.52 | 4.63 | 3.14 | 5.21 ± 2.47 |
| EL1 | – | – | – | – | – | 4.47 | 4.88 | 2.85 | 6.41 | 7.68 | 4.55 | 4.46 | 7.57 | 5.10 | 5.03 | 3.65 | 5.69 ± 2.25 |
| EL2 | – | – | – | – | – | – | 4.40 | 5.45 | 7.14 | 3.82 | 5.49 | 5.26 | 7.54 | 5.89 | 3.30 | 4.45 | 5.99 ± 2.49 |
| Re | – | – | – | – | – | – | – | 3.86 | 4.05 | 5.80 | 3.90 | 3.83 | 8.11 | 5.60 | 3.50 | 3.44 | 5.16 ± 2.52 |
| Ma | – | – | – | – | – | – | – | – | 4.88 | 8.09 | 2.84 | 2.62 | 8.27 | 5.43 | 4.75 | 3.09 | 5.06 ± 2.74 |
| Ku | – | – | – | – | – | – | – | – | – | 8.82 | 5.27 | 4.53 | 7.98 | 6.27 | 5.79 | 3.61 | 6.11 ± 2.08 |
| Or | – | – | – | – | – | – | – | – | – | – | 7.42 | 7.46 | 9.57 | 8.60 | 5.31 | 7.04 | 8.04 ± 2.78 |
| Pr | – | – | – | – | – | – | – | – | – | – | – | 2.17 | 8.57 | 5.98 | 4.14 | 3.45 | 5.32 ± 2.79 |
| Vo | – | – | – | – | – | – | – | – | – | – | – | – | 8.82 | 6.21 | 4.20 | 2.85 | 5.15 ± 2.99 |
| Zo | – | – | – | – | – | – | – | – | – | – | – | – | – | 4.68 | 6.68 | 6.50 | 7.63 ± 1.22 |
| SB | – | – | – | – | – | – | – | – | – | – | – | – | – | – | 4.71 | 4.18 | 5.73 ± 1.08 |
| Ta | – | – | – | – | – | – | – | – | – | – | – | – | – | – | – | 3.46 | 5.12 ± 2.04 |
| ER | – | – | – | – | – | – | – | – | – | – | – | – | – | – | – | – | 4.59 ± 2.21 |
SoB = South Beach; Ar = Aronne; At = Atkins; LE = LEARN; Ch = Cheskin; EL1 = Eat to Live (vegetarian); EL2 = Eat to Live (non-vegetarian); Re = Resolution; Ma = Mayo; Ku = Kushner; Or = Ornish; Pr = Pritikin; Vo = Volumetrics; Zo = Zone; SB, Sugar Busters; Ta = Taub; ER = EatRight.
Euclidean Distances Between the WLDs and Individuals' Intakes
The mean Euclidean distance between individuals' usual intakes from the CSFII and the closest WLD (whichever diet that may have been for each individual) was 3.63 ± 1.24, while the mean distance between individuals' usual intakes and the farthest diet (whichever diet that may have been for each individual) was 10.58 ± 1.10. The mean distance between individuals' intakes and the WLDs considered together was 6.04 ± 1.10. The smallest average Euclidean distance between individuals' intakes and the WLDs was with Cheskin (mean distance of 4.36 ± 1.61) (Table 5). The greatest average distance between individuals' intakes and the WLDs was with Ornish (mean distance of 9.84 ± 1.39). More than 54% of CSFII participants had diets that were closest to Cheskin or Sugar Busters compared with the other diets, while less than 1% were closest to Ornish (Figure). The proportion of individuals' diets with a Euclidean distance of > 15.24 (the greatest distance between WLDs) from at least 1 diet was 0.0033.
Table 5.
Average Euclidean Distances Between Dietary Intake in Individuals From the CSFII 1994–1996, 1998 and the Popular Weight-Loss Diets
| Diet | Euclidean distance fromCSFII to each diet1 |
|---|---|
| Cheskin | 4.36 ± 1.61 |
| EatRight | 4.53 ± 1.40 |
| Mayo | 4.73 ± 1.86 |
| Sugar Busters | 4.77 ± 1.26 |
| Pritikin | 5.06 ± 1.65 |
| Volumetrics | 5.28 ± 1.68 |
| Aronne | 5.39 ± 1.81 |
| Taub | 5.64 ± 1.32 |
| Kushner | 5.65 ± 1.17 |
| Eat to Live (vegetarian) | 5.78 ± 1.65 |
| LEARN | 5.87 ± 1.43 |
| Resolution | 5.93 ± 1.46 |
| South Beach | 6.47 ± 1.53 |
| Zone | 6.96 ± 1.29 |
| Eat to Live (non-vegetarian) | 7.34 ± 1.33 |
| Atkins | 9.02 ± 1.72 |
| Ornish | 9.84 ± 1.39 |
Mean ± SD.
Figure.
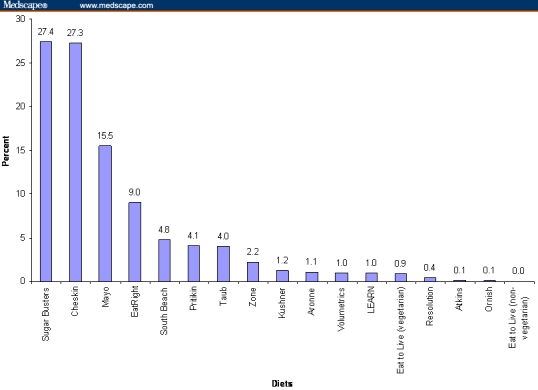
Percentage of individuals from the CSFII with self-reported dietary intakes closest to one of the popular weight-loss diets.
Sensitivity Analyses
Sensitivity analyses were performed, which (1) included percent of energy from protein; (2) substituted absolute amount of fat for percent of energy from fat; (3) eliminated micronutrients with little purported association with body weight (vitamin E, folate, and sodium); (4) included only obese persons; and (5) used Mahalanobis distance instead of Euclidean distance. The results of each of these analyses did not differ appreciably from the results reported above.
Discussion
This study comparing popular WLDs with the usual dietary intakes of Americans resulted in several important findings. First, popular WLDs promulgated over the past 10 years varied greatly in their macronutrient composition and micronutrient content. In addition, when taken as a whole, the WLDs varied substantially from the usual intake of Americans in several important ways. However, when compared on the basis of Euclidean distances, this study demonstrated that the usual diets of a representative sample of Americans were actually closer to the dietary recommendations of the 17 popular WLDs taken as a whole than the WLDs were to each other.
Our results indicate that the 17 diets included in this study varied widely with regard to many of the nutrient variables included in the analysis. For example, individual fatty acid contents (saturated, monounsaturated, and polyunsaturated) varied by at least a factor of 6, and most nutrients varied by at least a factor of 4 among the diets. Of interest (considering that these were all weight-loss diets), diets differed by a factor of 3 in energy content, varying from just over 750 kcal/d (Eat to Live, vegetarian for aggressive weight loss) to greater than 2200 kcal/d (Zone).
The mean nutrient composition of the WLDs was in greater agreement with published dietary guidelines[21,28] than mean intakes for individuals calculated from CSFII data. While mean intakes of polyunsaturated fat, vitamin E, and sodium from CSFII were very close to the mean values calculated from the WLDs, mean intakes of several nutrients associated with a higher risk of disease in previous studies (energy, saturated fat, cholesterol, and GL) were substantially higher in individuals based on CSFII data. Conversely, mean intakes of several nutrients associated with a reduced risk of disease (dietary fiber, folate, and calcium) were much lower in individuals compared with the WLDs.
Despite the apparent differences in nutrient composition of the WLDs considered together and nutrient intakes of individuals (and contrary to what we hypothesized), this study demonstrated that the usual diets of a representative sample of Americans were actually more similar to the WLDs taken as a whole than the WLDs were to each other. We originally speculated that based on Euclidean distances, the popular diets included in this study would be clustered at a considerable distance from a second cluster representing the usual intakes of Americans. However, this proved not to be the case. In fact, the probability that an individual's diet had a distance from at least 1 of the WLDs that was greater than the distance between the 2 most dissimilar WLDs was less than 1%.
What are the possible ramifications of these findings? Because we initially speculated that the WLDs would form a cluster at some distance from the usual diets of Americans, we postulated that an individual seeking to lose weight could choose any one of the popular diets at random and (assuming one of the WLD diets was optimal for that person) be closer to consuming their optimal diet than if they stayed on their current diet. In other words, the choice of diets would be a far less critical factor than would simply adopting one of the diets.
The results of this study indicated otherwise. Because the distance between the usual diets of Americans and the WLDs considered together (6.04) was similar to the mean distance among the popular diets (6.12), the choice of a WLD may, in fact, be more critical than we hypothesized. Assuming that one of the diets is best for an individual, he/she might be more successful in losing weight by selecting a diet that is most dissimilar to his/her usual diet than in selecting one that is very similar. An individual trying to lose weight without success that is already ‘near’ (a small Euclidean distance from) one of these WLDs may be more successful by choosing a diet that is farther (a larger Euclidean distance) from his/her usual diet. There is evidence from previous studies that when individuals trying to lose weight adopt new dietary patterns that vary markedly from their spontaneous eating patterns, weight loss may be enhanced.[29] When one couples this with data suggesting that WLDs varying radically in composition do not produce radically different weight losses on average,[30] a subject (baseline diet)-by-treatment (recommended WLD) interaction seems quite plausible. That is, subjects eating, for example, in an Atkins-like way may do best on an Ornish-like diet, and vice versa. While acknowledging that it may be challenging for individuals to radically alter life-long dietary patterns, we believe this hypothesis deserves consideration for future research.
Within this article, we calculated Euclidean distances instead of the more traditional statistical measure of Mahalanobis distance. Our justification for this approach was 2-fold. First, all dietary variables were standardized prior to calculating distances. Mahalanobis distance is preferable when variables are measured in different units and have differing variances.[27] However, since we standardized the variables prior to calculating distances, all variables were “unit-less” and the variances were set to 1 for all variables. Our second justification for using Euclidean distances was that we were not interested in the distances with regard to the association among the variables. Mahalanobis distance takes into account the correlation structure among the variables studied. For the purposes of this article, we were concerned with simple distances, not distances relative to a pattern of association. We did conduct a sensitivity analysis using Mahalanobis distances, and none of our results changed appreciably using this measure.
Our conclusions are limited by the absence of indication in the CSFII data regarding how many individuals were actively trying to lose weight, whether they were successful in doing so, or whether they were attempting to follow any particular dietary pattern. The impact of such data on our results, however, is likely to be limited, because individuals' statements of intention to lose weight correlate poorly with adherence to weight-loss dietary patterns and with actual weight loss.[31] It should also be noted (as discussed previously) that some of the diet books did not include sample menus. In those cases, we carefully constructed sample menus in strict accordance with the respective diet's macronutrient recommendations, as presented in its book. Finally, we analyzed the WLDs as presented in the books rather than assessing dietary intake in persons on each diet. Our objective was to analyze the WLDs as recommended in each book, not how compliant persons following the diets might be.
In summary, based on Euclidean distances, the popular WLDs included in this study were more similar to the spontaneous diets of a representative sample of Americans than originally hypothesized. This could have important implications with regard to the choice of diets for individuals attempting to lose weight. Further studies are needed to determine the impact on weight loss of adopting diets of varying Euclidean distances from spontaneous eating patterns.
Footnotes
Readers are encouraged to respond to the author at jshikany@dopm.uab.edu or to Paul Blumenthal, MD, Deputy Editor of MedGenMed, for the editor's eyes only or for possible publication via email: pblumen@stanford.edu
Contributor Information
James M. Shikany, Division of Preventive Medicine, School of Medicine, University of Alabama at Birmingham, Author's email address: jshikany@dopm.uab.edu.
Jennifer Barash, School of Public Health, University of Alabama at Birmingham.
David T. Redden, Department of Biostatistics, School of Public Health, University of Alabama at Birmingham.
Andrew O. Westfall, Department of Biostatistics, School of Public Health, University of Alabama at Birmingham.
Douglas C. Heimburger, Department of Nutrition Sciences, University of Alabama at Birmingham.
C. Suzanne Henson, Department of Human Nutrition & Hospitality Management, University of Alabama.
David B. Allison, Department of Biostatistics, University of Alabama at Birmingham.
References
- 1.Ogden CL, Carroll MD, Curtin LR, McDowell MA, Tabak CJ, Flegal KM. Prevalence of overweight and obesity in the United States, 1999–2004. JAMA. 2006;295:1549–1555. doi: 10.1001/jama.295.13.1549. [DOI] [PubMed] [Google Scholar]
- 2.New York Times homepage. New York Times; c2007 [cited 2007 Feb 1]. Paperback Advice Best Sellers. Available from: http://www.nytimes.com/2007/02/04/books/bestseller/0204bestpaperadvice.html?_r=1&oref=slogin.
- 3.Ornish D. Eat More, Weigh Less: Dr. Dean Ornish's Life Choice Program for Losing Weight Safely While Eating Abundantly. New York: HarperCollins; 1997. pp. 1–544. [Google Scholar]
- 4.Atkins RC. Dr. Atkins' New Diet Revolution. New York: Avon Books; 2002. pp. 1–540. [Google Scholar]
- 5.Agatston A. The South Beach Diet: The Delicious, Doctor-Designed, Foolproof Plan for Fast and Healthy Weight Loss. New York: Rodale; 2003. pp. 1–310. [Google Scholar]
- 6.Aronne LJ. Weigh Less, Live Longer: Dr. Lou Aronne's “Getting Healthy” Plan for Permanent Weight Control. Indianapolis: John Wiley & Sons, Inc.; 1997. pp. 1–292. [Google Scholar]
- 7.Brownell KD. The LEARN Program for Weight Control. 10th ed. Dallas: American Health Publishing Company; 2000. pp. 1–356. [Google Scholar]
- 8.Cheskin LJ. Losing Weight for Good: Developing Your Personal Plan of Action. Baltimore: The Johns Hopkins University Press; 1997. pp. 1–268. [Google Scholar]
- 9.Fuhrman J. Eat to Live: The Revolutionary Formula for Fast and Sustained Weight Loss. Boston: Little, Brown and Company; 2003. pp. 1–292. [Google Scholar]
- 10.Heber D. The Resolution Diet: Keeping the Promise of Permanent Weight Loss. Garden Park City, NY: Avery Publishing Group; 1999. pp. 1–209. [Google Scholar]
- 11.Hensrud DD. Mayo Clinic on Healthy Weight. Rochester, Minnesota: Mayo Clinic Health Information; 2000. pp. 1–208. [Google Scholar]
- 12.Kushner RF, Kushner N. Dr. Kushner's Personality Type Diet. New York: St. Martin's Press; 2003. pp. 1–288. [Google Scholar]
- 13.Pritikin R. The Pritikin Weight Loss Breakthrough: Five Easy Steps to Outsmart Your Fat Instinct. New York: Penguin Group; 1998. pp. 1–306. [Google Scholar]
- 14.Rolls B, Barnett RA. The Volumetrics Weight-Control Plan: Feel Full on Fewer Calories. New York: HarperCollins; 2000. pp. 1–336. [Google Scholar]
- 15.Sears B. The Zone. New York: HarperCollins; 2000. pp. 1–336. [Google Scholar]
- 16.Steward HL, Andrews SS, Bethea MC, Balart LA. The New Sugar Busters! Cut Sugar to Trim Fat. New York: Random House; 2003. pp. 1–384. [Google Scholar]
- 17.Taub EA. Balance Your Body, Balance Your Life: Dr. Taub's 28-Day Permanent Weight Loss Plan. New York: Kensington Publishing Corporation; 1999. 1 pp.448 pp. [Google Scholar]
- 18.Weinsier RL. EatRight Heart Smart. Birmingham, Alabama: Oxmoor House, Inc.; 1998. pp. 1–144. [Google Scholar]
- 19.Adams SM, Standridge JB. What should we eat? Evidence from observational studies. South Med J. 2006;99:744–748. doi: 10.1097/01.smj.0000220887.52952.f0. [DOI] [PubMed] [Google Scholar]
- 20.Jenkins DJA, Kendall CWC, Augustin LSA, et al. Glycemic index: overview of implications in health and disease. Am J Clin Nutr. 2002;(76 Suppl):266S–273S. doi: 10.1093/ajcn/76/1.266S. [DOI] [PubMed] [Google Scholar]
- 21.Dietary Guidelines for Americans 2005 [monograph] Bethesda: United States Department of Agriculture; 2005. [cited 2007 Feb 1]. Available from: http://www.health.gov/dietaryguidelines/dga2005/document/ [Google Scholar]
- 22.Schakel SF, Sievert YA, Buzzard IM. Sources of data for developing and maintaining a nutrient database. J Am Diet Assoc. 1988;88:1268–1271. [PubMed] [Google Scholar]
- 23.Liu S, Manson JE, Stampfer MJ, et al. Dietary glycemic load assessed by food-frequency questionnaire in relation to plasma high-density-lipoprotein cholesterol and fasting plasma triacylglycerols in postmenopausal women. Am J Clin Nutr. 2001;73:560–566. doi: 10.1093/ajcn/73.3.560. [DOI] [PubMed] [Google Scholar]
- 24.Foster-Powell K, Holt SH, Brand-Miller JC. International table of glycemic index and glycemic load values: 2002. Am J Clin Nutr. 2002;76:5–56. doi: 10.1093/ajcn/76.1.5. [DOI] [PubMed] [Google Scholar]
- 25.United States Department of Agriculture, Agricultural Research Service. Continuing Survey of Food Intakes by Individuals 1994–96, 1998. 2000. CD-ROM.
- 26.Flood A, Subar AF, Hull SG, Zimmerman TP, Jenkins DJA, Schatzkin A. Methodology for adding glycemic load values to the National Cancer Institute Diet History Questionnaire database. J Am Diet Assoc. 2006;106:393–402. doi: 10.1016/j.jada.2005.12.008. [DOI] [PubMed] [Google Scholar]
- 27.De Maesschalck R, Jouan-Rimbaud D, Massart DL. The Mahalanobis distance. Chemom Intell Lab Syst. 2000;50:1–18. [Google Scholar]
- 28.Bethesda: United States Department of Agriculture; MyPyramid.gov homepage. c2006–07 [cited 2007 Feb 1]. Available from: http://www.mypyramid.gov/ [Google Scholar]
- 29.Schlundt DG, Hill JO, Sbrocco T, Pope-Cordle J, Sharp T. The role of breakfast in the treatment of obesity: a randomized clinical trial. Am J Clin Nutr. 1992;55:645–651. doi: 10.1093/ajcn/55.3.645. [DOI] [PubMed] [Google Scholar]
- 30.Dansinger ML, Gleason JA, Griffith JL, Selker HP, Schaefer EJ. Comparison of the Atkins, Ornish, Weight Watchers, and Zone diets for weight loss and heart disease risk reduction: a randomized trial. JAMA. 2005;293:43–53. doi: 10.1001/jama.293.1.43. [DOI] [PubMed] [Google Scholar]
- 31.Lee JS, Kritchevsky SB, Tylavsky FA, et al. Weight-loss intention in the well-functioning, community-dwelling elderly: associations with diet quality, physical activity, and weight change. Am J Clin Nutr. 2004;80:466–474. doi: 10.1093/ajcn/80.2.466. [DOI] [PubMed] [Google Scholar]