Abstract
The aim of this study was to assess pelvic asymmetry (i.e. to determine whether the right iliac bone and the right part of the sacrum are mirror images of the left), both quantitatively and qualitatively, using three-dimensional measurements. Pelvic symmetry was described osteologically using a common reference coordinate system for a large sample of pelvises. Landmarks were established on 12 anatomical specimens with an electromagnetic Fastrak system. Seventy-one paired variables were tested with a paired t-test and a non-parametric test (Wilcoxon). A Pearson correlation matrix between the right and left values of the same variable was applied exclusively to values that were significantly asymmetric in order to calculate a dimensionless asymmetry index, ABGi, for each variable. Fifteen variables were significantly asymmetric and correlated with the right vs. left sides for the following anatomical regions: sacrum, iliac blades, iliac width, acetabulum and the superior lunate surface of the acetabulum. ABGi values above a threshold of ± 4.8% were considered significantly asymmetric in seven variables of the pelvic area. Total asymmetry involving the right and the left pelvis seems to follow a spiral path in the pelvis; in the upper part, the iliac blades rotate clockwise, and in the lower part, the pubic symphysis rotates anticlockwise. Thus, pelvic asymmetry may be evaluated in clinical examinations by measuring iliac crest orientation.
Keywords: asymmetry, pelvis, physical examination
Introduction
A number of recent studies have examined the relationship between the pelvis and the lower limbs and spine, with regard to both anthropological (LeDamany, 1905; Rickenmann, 1957; Schultz, 1972; Lovejoy, 1981; Endo, 1982; Stewart, 1984; Tague & Lovejoy, 1986; Abitbol, 1987a,b, 1989; Berge, 1991; Coppens, 1991; Lavelle, 1995) and clinical (Rouvière, 1948; Testut & Latarjet, 1948; Bellugue, 1963; Ducroquet et al. 1964, 1965; Farfan, 1978; Kapandji, 1980; Vidal & Marnay, 1983, 1984; During et al. 1985; Itoi, 1991; Duval-Beaupère et al. 1992; Legaye et al. 1993, 1998; Dubousset, 1998; Marty et al. 2002) problems. However, these studies have studied only the equilibrium of the pelvis (i.e. its position in three dimensions). The classic example is pelvic obliquity (Kilfoyle et al. 1965; Bonnett et al. 1975; Duval-Beaupère et al. 1975, 1984; O'Brien et al. 1975; Reimers, 1980; Luque, 1982; McMaster & Ohtsuka, 1982; Hodgkinson et al. 2002) in lumbar scoliosis, which can be observed in children with cerebral palsy and in disabled adults. In these and other cases, however, the issue of pelvic asymmetry has not been documented. Is the right iliac bone the mirror image of the left? Is the right part of the sacrum the mirror image of the left? Symmetry or asymmetry of the pelvis is typically defined according to the morphology of the pelvis as a whole, independent of the position of the pelvis in space. However (im)balance or (dis)equilibrium are concepts that depend upon the anatomical context of the pelvis. The state of balance or equilibrium changes with respect to the position: supine, seated, or standing.
Because imbalance and asymmetry are different, the potential dissociation of asymmetry in pelvic balance/imbalance has several interesting implications. For example, when the pelvis of a subject is unbalanced in a upright position, is this state the same in supine or seated position? Perhaps it is due to unequal lower limb lengths and/or pelvic asymmetry, in which case the symmetry of the pelvis should be examined. Many different kinds of pelvic dysplasia would be easier to understand, assess and treat as a result of such analyses. If only the iliac crest height is assessed clinically, then the positions of the postero-superior iliac spine (PSIS) and the antero-superior spine (ASIS) remain unevaluated. However, once the positions of these bone landmarks are recorded in three-dimensional (3D) space, then it is possible to measure departures from symmetry in the pelvis to determine if they correspond to imbalance and/or asymmetry.
This study assesses 3D pelvic asymmetry on a quantitative and qualitative basis from anatomical specimens. Such an assessment allows for the collection of clinical variables that can lead to a better understanding of the pathophysiology of static and dynamic disorders involving the lower limbs, the pelvis itself and/or the spine.
Materials and methods
Pelvic symmetry was studied in 12 pelvic specimens, with no pathological history, taken from adults aged from 63 to 82 years (mean 72.6 years, SD 6.25 years: seven male and five female). The donated specimens were hand-cleaned to remove the soft tissues and then cleaned and dried according to a previously described method (Boulay et al. 2005). In addition, a preliminary study using 39 descriptive anatomical points from the same anatomical specimen was carried out to confirm that the preparatory methods did not introduce any distortion.
Direct measurement of anatomical specimens was performed by means of an electromagnetic device (Fastrak system), which provided 3D spatial coordinate measurements with low inter- and intra-observer reliability (Maffey-Ward et al. 1996; Willems & Jull, 1996; Swinkels & Dolan, 1998; Jordan et al. 2000). In this study, each anatomical landmark was identified initially according to descriptive anatomy; 476 points were marked on the surface of the specimen. Each point was subsequently defined by its 3D spatial coordinates in relation to a common reference. This reference was defined as follows: the y-axis is defined by the anterior–superior iliac spines, orientated from right to left; the x-axis is perpendicular to the y-axis, passing through the middle point of the upper sacral plate, orientated anteriorly; and the z-axis is the cross product of the y- and x-axes, passing through the origin of the reference, defined by the intersection of the x- and y-axes.
This process allowed us to compile a set of 349 pelvic variables, comprising 270 linear inter-landmark distances and 79 angles. For comparison, each variable was calculated with respect to a common reference point. To test intra-observer reliability using the Fastrak system, the same pelvis was measured six times using a subset of 39 landmarks; each time, it was set at the same position on its support. To test inter-observer reliability test using the Fastrak system, the same pelvis was measured by two different observers.
The homologous (or paired) right–left variables
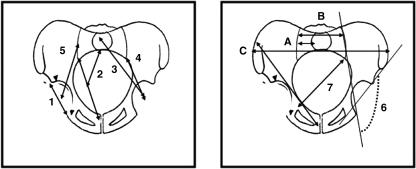
One hundred and forty-two right and left variables (Figs 1–6) were described from 71 paired variables (Table 1). These variables were chosen from anthropological (Ledamany, 1905; Schultz, 1972; Abitbol, 1987a,b, 1989; Berge, 1991), biomechanical (Testut & Latarjet, 1948; Ducroquet et al. 1964, 1965; Kapandji, 1980) and clinical studies (Vidal & Marnay, 1983, 1984; Itoi, 1991; Duval-Beaupère et al. 1992; Legaye et al. 1993, 1998; Marty et al. 2002). Each pelvic osteological area was studied. Only the main areas described are listed, namely:
Fig. 1.
Coronal views of the pelvis. 1, acetabular diameter; 2, sacral–acetabular diameter; 3, upperplate S1-acetabulum; 4, sacroiliac–acetabulum; 5, scalenion–acetabulum; 6, sacroiliac–acetabulum angle; 7, pelvic oblique diameter; 8, lateral sacral mass/pelvic breadth (A/C); 9, lateral sacral mass/sacral breadth (A/B); 10, symphysis pubis–apex iliac crest.
Fig. 6.
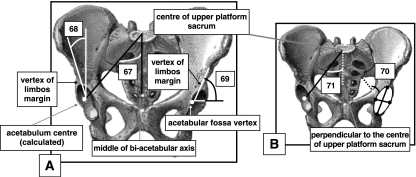
Anterior views (A,B) of pelvis. (A) 67, semi-pelvic spacer; 68, Wiberg angle; 69, Hilgenreiner angle (superior lunate surface obliqueness). (B) 70, acetabulum sphericity; 71, lateral incidence.
Table 1.
Significant homologous variables: evaluation test of the mean of the difference test between right and left by pairing series
| Difference between right and left | Student's t-test | |||||
|---|---|---|---|---|---|---|
| Variable | Mean | SD | min. | max. | P | |
| 1 acetabular diameter | −0.30 | 1.99 | −5.3 | 2.7 | 0.607 | NS |
| 2 sacral–acetabular diameter | −2.01 | 5.05 | −11 | 4.4 | 0.196 | NS |
| 3 upperplate S1–acetabulum | −0.37 | 5.67 | −9.6 | 8.2 | 0.826 | NS |
| 4 sacroiliac–acetabulum (length) | 6.62 | 4.15 | 0.2 | 13 | 0.000 | S*** |
| 5 scalenion–acetabulum | 8.41 | 5.57 | 2.5 | 23 | 0.001 | S*** |
| 6 sacroiliac–acetabulum (angle) | −25.23 | 13.44 | −37 | 6.1 | 0.000 | S*** |
| 7 pelvic oblique diameter | 2.59 | 7.51 | −6.6 | 17 | 0.256 | NS |
| 8 lateral sacral mass/pelvic breadth | −0.20 | 0.02 | −0.3 | −0.2 | 0.000 | S*** |
| 9 lateral sacral mass/sacral breadth | −0.01 | 0.06 | −0.1 | 0.1 | 0.600 | NS |
| 10 symphysis pubis–apex iliac crest | 0.03 | 3.60 | −7 | 5.3 | 0.976 | NS |
| 11 hipbone length | 1.20 | 4.93 | −7.5 | 7.5 | 0.418 | NS |
| 12 symphysis pubis height | 0.86 | 1.08 | −0.7 | 2.9 | 0.019 | S* |
| 13 symphysis pubis slope | 0.10 | 3.59 | −5.7 | 5.6 | 0.922 | NS |
| 14 horizontal greater sciatic notch | 1.74 | 3.89 | −3.1 | 9.4 | 0.148 | NS |
| 15 pelvic general index | −1.12 | 3.23 | −5.7 | 3.6 | 0.253 | NS |
| 16 superior iliac spine length | −0.20 | 2.76 | −7 | 3.9 | 0.803 | NS |
| 17 apex iliac crest–ischial tuberosity | −0.41 | 2.69 | −4.7 | 4.2 | 0.608 | NS |
| 18 antero-superior iliac spine–ischial tuberosity | 0.37 | 2.21 | −4.5 | 3.5 | 0.575 | NS |
| 19 postero-superior iliac spine–ischial tuberosity | 0.66 | 4.65 | −7.2 | 9.2 | 0.631 | NS |
| 20 great axis of obturator foramen | 2.44 | 2.45 | −2.5 | 5.9 | 0.005 | S** |
| 21 antero-superior iliac spine-tubercle of iliac crest | −0.16 | 6.05 | −11 | 7.5 | 0.929 | NS |
| 22 apex of iliac crest–acetabulum | −1.21 | 1.32 | −4.2 | 0.8 | 0.013 | S** |
| 23 minimal ilium breadth | −0.17 | 2.45 | −3.7 | 4.7 | 0.817 | NS |
| 24 pubis length | 1.16 | 2.82 | −3.7 | 4.2 | 0.201 | NS |
| 25 antero-superior iliac spine–acetabulum | 0.79 | 2.74 | −3.3 | 7.1 | 0.360 | NS |
| 26 ilio-ischium angle | 3.05 | 6.67 | −5.1 | 17 | 0.160 | NS |
| 27 ilio-pubic angle | −2.11 | 6.33 | −15 | 7.6 | 0.294 | NS |
| 28 ischio-pubic angle | −0.41 | 5.20 | −8.5 | 10 | 0.798 | NS |
| 29 iliac crest orientation | 14.57 | 10.55 | 41 | 0 | 0.000 | S*** |
| 30 iliac crest tubercle (apex) thickness | −1.02 | 4.15 | −9.1 | 5.8 | 0.415 | NS |
| 31 iliac crest tubercle (anterior) thickness | −2.26 | 4.09 | −8.7 | 7.5 | 0.081 | NS |
| 32 iliac crest tubercle (posterior) thickness | 1.03 | 8.86 | −11 | 22 | 0.695 | NS |
| 33 antero-superior iliac buttress | 0.44 | 1.12 | −1.7 | 2.3 | 0.201 | NS |
| 34 anterior medial iliac buttress | 1.05 | 1.40 | −0.3 | 3.3 | 0.025 | S* |
| 35 antero-inferior iliac buttress | 0.27 | 1.74 | −2 | 3.7 | 0.605 | NS |
| 36 anterior iliac buttress base | −0.77 | 3.39 | −4.1 | 8.7 | 0.448 | NS |
| 37 medio-superior iliac buttress | −0.92 | 1.22 | −2.8 | 1.1 | 0.024 | S* |
| 38 medio-medial iliac buttress | 0.20 | 1.52 | −2 | 2.3 | 0.653 | NS |
| 39 medio-inferior iliac buttress | 0.80 | 1.88 | −1.1 | 5.1 | 0.167 | NS |
| 40 medium iliac buttress base | 1.14 | 3.26 | −3.8 | 6.2 | 0.251 | NS |
| 41 postero-superior iliac buttress | −0.88 | 1.92 | −6.1 | 1 | 0.142 | NS |
| 42 postero-medial iliac buttress | 0.31 | 2.11 | −3.1 | 5 | 0.622 | NS |
| 43 postero-inferior iliac buttress | 2.57 | 3.55 | −2.4 | 9.3 | 0.029 | S* |
| 44 posterior iliac buttress base | 3.01 | 4.74 | −4.3 | 13 | 0.050 | NS (borderline) |
| 45 greater sciatic notch (angle) | −1.04 | 4.15 | −8.5 | 4.2 | 0.426 | NS |
| 46 posterior upper sacral plate–ischial tuberosity | 1.13 | 4.71 | −9.7 | 10 | 0.422 | NS |
| 47 posterior upper sacral plate–ischio-pubic ramus | 0.15 | 4.00 | −9.1 | 5.4 | 0.896 | NS |
| 48 posterior upper sacral plate–ischio-pubic ramus inferior | 0.66 | 4.11 | −8.7 | 6.1 | 0.589 | NS |
| 49 posterior upper sacral plate–obturator foramen | 0.84 | 4.52 | −11 | 6.5 | 0.530 | NS |
| 50 posterior upper sacral plate–ilio-pubic ramus | −0.33 | 4.51 | −8.4 | 6.1 | 0.804 | NS |
| 51 medial upper sacral plate–ischial tuberosity | 0.72 | 4.63 | −9.2 | 11 | 0.600 | NS |
| 52 medial upper sacral plate–ischio-pubic ramus | −0.21 | 3.86 | −8.7 | 4.2 | 0.851 | NS |
| 53 sacral plane breadth | 0.64 | 1.93 | −3.1 | 3.3 | 0.278 | NS |
| 54 lateral sacral mass orientation | 0.50 | 8.08 | −16 | 13 | 0.835 | NS |
| 55 growth vector (x) | 0.09 | 0.16 | −0.1 | 0.5 | 0.112 | NS |
| 56 growth vector (y) | 0.04 | 0.25 | −0.5 | 0.5 | 0.576 | NS |
| 57 growth vector (z) | 0.05 | 0.10 | −0.1 | 0.2 | 0.120 | NS |
| 58 sacro-iliac joint height | 0.57 | 3.78 | −2.9 | 11 | 0.542 | NS |
| 59 auricular surface (angle) | −3.03 | 5.95 | −12 | 5.7 | 0.122 | NS |
| 60 axis of acetabulum | 14.72 | 4.95 | −24 | −9.6 | 0.000 | S*** |
| 61 central cosine of acetabulum axis (x) | 0.01 | 0.07 | −0.1 | 0.1 | 0.651 | NS |
| 62 central cosine of acetabulum axis (y) | 0.02 | 0.10 | −0.2 | 0.2 | 0.607 | NS |
| 63 central cosine of acetabulum axis (z) | −0.03 | 0.08 | −0.1 | 0.1 | 0.216 | NS |
| 64 axis (bis) of acetabulum | −2.34 | 7.67 | −16 | 6.6 | 0.335 | NS |
| 65 slope of iliac blade | 2.28 | 2.08 | −1.9 | 5 | 0.003 | S** |
| 66 ilio-sacral angle | −0.34 | 5.51 | −10 | 7.6 | 0.842 | NS |
| 67 semi-pelvic spacer | 0.18 | 2.08 | −2.8 | 4 | 0.772 | NS |
| 68 Wiberg | −15.47 | 4.33 | −22 | −9 | 0.000 | S*** |
| 69 Hilgenreiner (superior lunate surface obliqueness) | −23.34 | 17.06 | −45 | 2.7 | 0.001 | S*** |
| 70 acetabulum sphericity | −0.84 | 2.52 | −5.8 | 3.3 | 0.297 | NS |
| 71 lateral Incidence | 1.65 | 7.76 | −14 | 19 | 0.496 | NS |
P < 0.05
0.001 < P < 0.01
P < 0.001; alpha = 5%.
the iliac crest, the iliac blade, the vertical iliac bar or acetabulo-cristal buttress or iliac buttress (it is a long prominent area fron the tubercle of the crest to the supra-acetabular region on the lateral surface of ilium), and the pubic symphysis
the acetabulum,
the obturator foramen,
the lateral sacral mass,
the angle between the sacro-iliac joint and the acetabulum,
the width of the ilium.
Statistical methodology
For the preliminary study, the differences between measurements made on the ‘fresh’ and ‘dry’ pelvises (i.e. before and after preparation) in x, y, and z coordinates were compared with intra- and inter-observer reliability tests of the Fastrak system. In terms of pelvic symmetry, the mean coordinates of each right side homologous variable were compared with the left side one using a paired t-test. This comparison made the establishment of asymmetry possible with a significant threshold (P < 0.05) for each homologous variable. Because of the small sample size (n < 30), a non-parametric test (Wilcoxon) was used to complement the parametric paired t-test. Using paired variables increased the capacity to discriminate differences between the right and left side for a homologous variable.
Asymmetry was diagnosed when the difference between the right and the left for a homologous variable was significantly different from zero (P < 0.05). Asymmetry was considered positive when the right side value was greater than the left side value, and negative when the left side value was greater than the right side value. In order to highlight paired and asymmetrical selective variables, a Pearson and a Spearman correlation matrix between the right and the left value for the same variable, solely for those significantly asymmetrical, completed this evaluation. This correlation study measured the extent of the asymmetry for a given variable.
Calculation of an asymmetry index (ABGi or Asymmetry-Based Gradient for the variable i) for each variable determined the real value of the variable expressed in a dimensional unit (millimetres or degrees), worked in a dimensionless unit. Thus, 71 ABGi were calculated from the 71 initial dimensional variables. i.e. ABGi = gradient of asymmetry of the pelvis for the paired variable i (in a dimensionless unit).
This gradient of pelvic asymmetry for each variable (ABGi) was compared, using a paired t-test, to a given theoretical threshold value, both positive and negative. This value constituted a threshold in the sense that a gradient of asymmetry higher than the positive threshold indicates a positive asymmetry. A gradient with an asymmetry inferior to the negative threshold indicates a negative asymmetry. Conventionally, the index of asymmetry is positive when, for a given variable, the right value is greater than that of the left and negative in the reverse case.
This threshold value was determined as the upper and lower confidence limits of perfect symmetry, meaning that an ABGi equalled zero. In this case, the right value equalled the left one for the same variable, so there was therefore perfect symmetry and 0% asymmetry. For the sample of 71 homologous variables, the confidence limits of 0% had an upper boundary of 4.8% (in a positive asymmetry) and a lower boundary of −4.8% (in a negative asymmetry).
A Pearson correlation matrix was used to study the correlations between the different indicators of asymmetry in order to select those ABGi that yield more information than others. The selection filter preliminary to this study of correlation eliminated redundant ABGi variables based on osteological descriptions, and limited the risk of seeing correlations appear as a result of the number of variables. The ultimate goal of the study was to obtain an objective ABGi summarizing pelvic asymmetry through correlation with the others. Normality of data was tested by Kolmogorov–Smirnov normality tests.
Suppliers
The Fastrak device was developed by the Polhemus Society (http://www.polhemus.com; Colchester, VT, USA) and distributed in France by the society Theta Scan (fpi@thetascan.fr; Courtaboeuf, France).
Results
Precision and error
Measurement error of the x, y and z coordinates of each of the 39 descriptive anatomy points on the same pelvis before and after osteological treatment was 0.11 mm (SD 0.43 mm) on the x-axis, −0.67 mm (SD 2.33 mm) on the y-axis and 0.45 (SD 0.39 mm) on the z-axis.
The global average value of imprecision in the measurement of a point for intra-observer reliability was 0.725 mm (SD 1.81 mm). Inter-observer reliability was 0.81 mm (SD 2.4 mm).
Homologous variables right vs. left in dimensional units (mm or degrees)
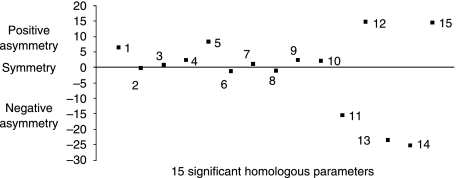
The Kolmogorov–Smirnov normality test showed that the distribution of all variables was normal. The t-tests further indicated that the difference between the right and left values for the same variable was statistically significant for 15 of the 71 variables measured (Table 1). The representation of these differences on a scatter plot clarified the spread of the asymmetric variables (Fig. 7), the most asymmetric paired variables being the furthest from the abscissa axis where, by definition, asymmetry was zero. The plus or minus of pelvic asymmetry determined its direction (Fig. 7). Although the sample was small (n < 30), a Wilcoxon test yielded the same results as a paired t-test in terms of the significance of the asymmetric variables (Table 2).
Fig. 7.
The 15 significant homologous variables on the abscissa axis (among the 71 homologous variables) and the difference between right–left on the ordinate axis: the degree of asymmetry (positive and negative) is displaced with respect to the abscissa axis and the perfect symmetry (or the asymmetry is zero) is the abscissa axis. 1, sacroiliac–acetabulum (length); 2, lateral sacral mass/pelvic breadth; 3, pubis symphysis; 4, great axis obturator foramen; 5, scalenion–acetabulum; 6, apex iliac crest–acetabulum; 7, anterior medial iliac buttress; 8, medio-superior iliac buttress; 9, postero-inferior iliac buttress; 10, wing ilium slope; 11, centre–edge angle of Wiberg; 12, acetabulum axis; 13, Hilgenreiner angle; 14, sacraoiliac–acetabulum (angle); 15, iliac crest orientation.
Table 2.
Significant homologous variables (Wilcoxon non-parametric test)
| Non-parametric test Wilcoxon (pairing series) P | ||
|---|---|---|
| pubis symphysis | 0.028 | S* |
| iliac crest tubercule (anterior) thickness | 0.055 | limit S* |
| anterior medial iliac buttress | 0.158 | NS |
| medio-superior iliac buttress | 0.060 | NS |
| postero-inferior iliac buttress | 0.028 | S* |
| posterior iliac buttress base | 0.055 | limit S* |
| great axis obturator foramen | 0.013 | S* |
| apex iliac crest–acetabulum | 0.010 | S** |
| slope of iliac blade | 0.010 | S** |
| sacroiliac–acetabulum (length) | 0.003 | S** |
| lateral sacral mass/breadth pelvic | 0.002 | S** |
| scalenion–acetabulum | 0.003 | S** |
| Wiberg | 0.003 | S** |
| acetabulum axis | 0.003 | S** |
| Hilgenreiner | 0.003 | S** |
| sacroiliac–acetabulum (angle) | 0.006 | S** |
| Iliac crest orientation | 0.003 | S** |
P < 0.05
0.001 < P < 0.01
*** P < 0.001.
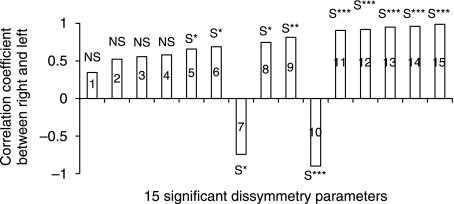
A correlation study between the right and left values, using the significantly asymmetric paired variables, helped to single-out the most asymmetric variables (Table 3), and the extent of asymmetry for each variable. A new hierarchy in the significantly asymmetric variables was therefore obtained according to the correlation coefficients. The classification was based on the rank of the magnitude of the correlation coefficients: the distance linking the apex of the iliac crest with the centre of the acetabulum (rs = 0.98), the symphysis pubis height (rs = 0.97), the slope of the iliac crest (rs = 0.96), the great axis of the obturator foramen (rs = 0.95), the orientation of the iliac crest (rs = −0.845) (Fig. 3) and the superior lunate surface of the acetabulum (Wiberg (Wiberg, 1939) angle, rs = 0.83) (Fig. 6). The iliac width from the anterior point to the sacro-iliac joint to the acetabulum (rs = 0.8) (Fig. 1) predominates with respect to the superior lunate surface obliqueness of the acetabulum [Hilgenreiner (Hensinger, 1986) angle, rs =−0.63] (Fig. 6), the medium iliac buttress (rs = 0.726) (Fig. 3), the acetabulum axis (rs = 0.68) (Fig. 5) and the ratio of the lateral sacral mass to the pelvic breadth (rs = 0.66) (Fig. 1).
Table 3.
Correlations between right and left for the significant homologous variables
| r (Pearson) | P | r(Spearman) | P | |||
|---|---|---|---|---|---|---|
| sacroiliac–acetabulum (length) | 0.819 | 0.004 | S** | 0.8 | 0.00311 | S** |
| lat. sacral mass/breadth pelvic | 0.66 | 0.036 | S* | 0.66 | 0.036 | S* |
| pubis symphysis | 0.97 | < 0.0001 | S*** | 0.97 | < 0.0001 | S*** |
| great axis obturator foramen | 0.916 | < 0.0001 | S*** | 0.95 | < 0.0001 | S*** |
| scalenion–acetabulum | 0.56 | 0.092 | NS | 0.56 | 0.09 | NS |
| apex iliac crest–acetabulum | 0.99 | < 0.0001 | S*** | 0.98 | < 0.0001 | S*** |
| anterior medial iliac buttress | 0.58 | 0.078 | NS | 0.51 | 0.086 | NS |
| medio-superior iliac buttress | 0.74 | 0.014 | S* | 0.726 | 0.0074 | S** |
| postero-inferior iliac buttress | 0.339 | 0.337 | NS | 0.496 | 0.1 | NS |
| wing ilium slope | 0.94 | < 0.0001 | S*** | 0.96 | < 0.0001 | S*** |
| Wiberg | 0.90 | < 0.0001 | S*** | 0.83 | 0.001 | S*** |
| acetabulum axis | 0.686 | 0.029 | S* | 0.68 | 0.036 | S* |
| Hilgenreiner | −0.73 | 0.016 | S* | −0.63 | 0.026 | S* |
| sacroiliac–acetabulum (angle) | 0.53 | 0.114 | NS | 0.42 | 0.189 | NS |
| Iliac crest orientation | −0.896 | < 0.0001 | S*** | −0.845 | 0.0005 | S*** |
P < 0.05
0.001 < P < 0.01
P < 0.001.
Fig. 3.
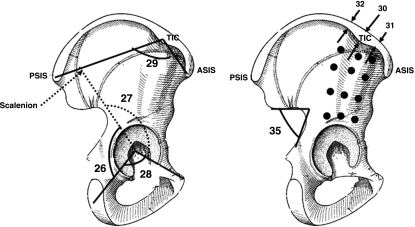
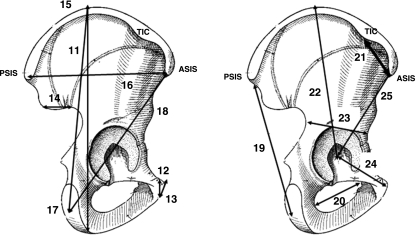
Sagittal views of right iliac bone. 26, ilio-ischium angle; 27, ilio-pubic angle; 28, ischio-pubic angle; 29, orientation of wing ilium; 30, iliac crest tubercle (apex) thickness; 31, iliac crest tubercle (anterior) thickness; 32, iliac crest tubercle (posterior); 33–44 (•), thickness of iliac buttress (anterior, posterior, medium); 45, greater sciatic notch.
Fig. 5.
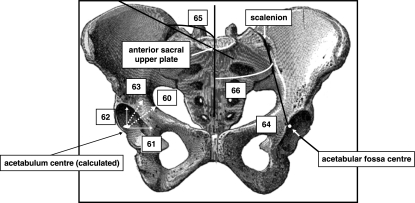
Anterior view of pelvis. 60, acetabulum axis; 61, central cosine of acetabulum axis (x); 62, central cosine of acetabulum axis (y); 63, central cosine of acetabulum axis (z); 64, acetabulum axis (bis); 65, slope of iliac blade; 66, ilio-sacral angle.
Fig. 4.
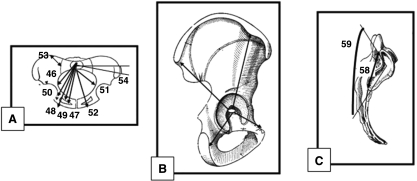
Coronal view of pelvis (A), sagittal view of right iliac bone (B), lateral right view of sacrum (C). (A) 46, postero-medial upper sacral plate–ischial tuberosity; 47, postero-medial upper sacral plate–supero-medial ischio-pubic ramus; 48, postero-medial upper sacral plate–infero-medial ischio-pubic ramus; 49, postero-medial upper sacral plate–obturator foramen; 50, postero-medial upper sacral plate–ilio-pubic ramus; 51, medial upper sacral plate–ischial tuberosity; 52, medial upper sacral plate–ischio-pubic ramus; 53, sacral plane breadth (PSIS-scalenion); 54, lateral sacral mass orientation. (B) 55–57, growth factor (sum of ilium, pubis, ischium and iliac axises). (C) 58, sacro-iliac height; 59, auricular surface angle.
The results of the correlation analysis identified 11 significantly asymmetric (P < 0.05) variables. When viewed in anatomical relationship to each other (Fig. 8), the configuration of the correlations indicates a negative correlation for the angle of the superior lunate surface obliqueness of the acetabulum (Hilgenreiner angle, rs = −0.63) (Fig. 6) and the orientation of the iliac crest (rs = −0.845) (Fig. 3), and positive correlation for the other asymmetric variables.
Fig. 8.
Correlation coefficient between right and left for significant asymmetric variables. 1, sacroiliac–acetabulum (angle); 2, postero-inferior iliac buttress; 3, scalenion–acetabulum; 4, anterio-medial iliac buttress; 5, wing sacral/pelvic breadth; 6, acetabulum axis; 7, Hilgenreiner angle; 8, medio-superior iliac buttress; 9, sacroiliac–acetabulum (length); 10, iliac crest orientation; 11, centre–edge angle of Wiberg; 12, great axis obturator foramen; 13, wing ilium slope; 14, pubis symphysis (height); 15, apex iliac crest-acetabulum.
Homologous variables right vs. left in dimensionless units
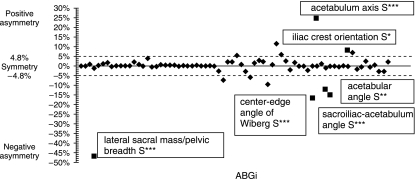
The asymmetry of the statistically significant ABGi variables with respect to a threshold value affected six out of 71 variables (Table 4). The layout of the positive and negative dissymmetries for all of the 71 variables and those statistically significant are shown in Fig. 9 according to the conventions for homologous variables. No significant correlation was shown between the six significant indicators of asymmetry in the study of correlations (Table 5).
Table 4.
Significant ABGi: evaluation test of the ABGi mean with theoretical threshold ABG (unilateral test)
| ABGi | Student's t-test | ||||
|---|---|---|---|---|---|
| Mean | SD | t | t(n − 1; alpha) | ||
| lat sacral mass/pelvic breadth | −0.4702 | 0.0771 | −18.980 | 1.796 | S*** |
| Wiberg | −0.1689 | 0.0651 | −6.430 | 1.796 | S*** |
| acetabulum axis | 0.2474 | 0.1099 | 6.287 | 1.796 | S*** |
| Hilgenreiner | −0.1208 | 0.0883 | −2.855 | 1.796 | S** |
| sacroiliac–acetabulum angle | −0.1521 | 0.0776 | −4.648 | 1.796 | S*** |
| Iliac crest orientation | 0.0813 | 0.0591 | 1.950 | 1.796 | S* |
P < 0.05
0.001 < P < 0.01
P < 0.001; alpha = 5%.
Fig. 9.
The six significant (▪) ABGi positive (acetabulum axis, iliac crest orientation) and negative (Hilgenreiner angle, sacroiliac–acetabulum (angle), Wiberg angle, lateral sacral mass/pelvic breadth) among 71.
Table 5.
Pearson correlation matrix for the six significant ABGi
| ABGi | Lateral sacral mass/pelvic breadth | Wiberg | Acetabulum axis | Hilgenreiner | Sacroiliac–acetabulum angle | Orientation ilium wing |
|---|---|---|---|---|---|---|
| lateral sacral mass/pelvic breadth | – | 0.0024 | 0.2947 | 0.3407 | 0.278 | −0.3166 |
| mass/pelvic | – | P = 0.994 | P = 0.379 | P = 0.305 | P = 0.408 | P = 0.343 |
| breadth | – | NS | NS | NS | NS | NS |
| Wiberg | 0.0024† | – | −0.2918 | 0.1778 | −0.0653 | −0.1738 |
| P = 0.994‡ | – | P = 0.384 | P = 0.601 | P = 0.849 | P = 0.609 | |
| NS§ | – | NS | NS | NS | NS | |
| acetabulum axis | 0.2947 | −0.2918 | – | −0.0024 | 0.4568 | −0.47 |
| P = 0.379 | P = 0.384 | – | P = 0.994 | P = 0.158 | P = 0.145 | |
| NS | NS | – | NS | NS | NS | |
| Hilgenreiner | 0.3407 | 0.1778 | −0.0024 | – | 0.3898 | −0.239 |
| P = 0.305 | P = 0.601 | P = 0.994 | – | P = 0.236 | P = 0.479 | |
| NS | NS | NS | – | NS | NS | |
| sacroiliac–acetabulum angle | 0.278 | −0.0653 | 0.4568 | 0.3898 | – | −0.4701 |
| P = 0.408 | P = 0.849 | P = 0.158 | P = 0.236 | – | P = 0.145 | |
| NS | NS | NS | NS | – | NS | |
| Iliac crest orientation | 0.3166 | 0.1738 | 0.47 | 0.239 | 0.4701 | – |
| P = 0.343 | P = 0.609 | P = 0.145 | P = 0.479 | P = 0.145 | – | |
| NS | NS | NS | NS | NS | – |
Upper column: correlation coefficient.
Middle column: P-value.
Lower column: significance.
* P < 0.05, ** 0.001 < P < 0.01, *** P < 0.001; alpha = 5%.
Discussion
Clinical evaluation of the pelvis typically focuses upon its equilibrium or disequilibrium and can be assessed using positional variables (i.e. those that depend on their orientation in space), which vary by definition according to the subject's position. Therefore, a pelvis in equilibrium can be asymmetric and a pelvis in disequilibrium can be symmetric. The states of (dis)equilibrium (a positional reference) and (a)symmetry (a morphological reference) are dissimilar and must be dissociated. It is important to clarify the condition of symmetry or asymmetry of the pelvis using morphological and anatomical variables, evaluating the osteology of the pelvis, regardless of the position of the pelvis in space. The study of anatomical specimens facilitates this by providing a common reference for all specimens and permitting assessments of the morphology alone.
The 3D Fastrak system of measurement potentially induces two types of error: a systematic error related to the position of a point and a random error related to the pointer. The total imprecision related to the position of a point is the sum of these two types of error. This imprecision cannot be zero, so it is necessary to qualify this error relative to the conditions of the study. Observer fatigue is a potential bias because observers must identify and digitize a large number of points. Currently, there is no other more accurate method for locating and identifying 3D coordinates on an anatomical specimen. Intra- and inter-observer reliability of the Fastrak system is less than 1 mm, which is acceptable and comparable with the accepted imprecision of the point position. The scattering of the values identified on the basis of large standard deviations is probably explained by the size of the anatomical specimen and its geometric complexity, which differ from standards commonly used to evaluate the precision of the Fastrak system.
Measurement of the 39 descriptive anatomical points of a given pelvis, before and after osteological treatment, shows a variability on the x-, y- and z-axes that is lower than the intra- and inter-observer reliability of the Fastrak system. Thus, the use of ‘dry’ anatomical specimens after osteological treatment is compatible with a morphometric study. The clinically stated pelvic asymmetry has thus been assessed and some paired variables display a significant difference between right and left. Iliac width (sacroiliac–acetabulum, scalenion–acetabulum) (Fig. 1) is greater on the right, in contrast to the Velpeau sacro-acetabulum diameter and the oblique diameter (Fig. 1), which do not take the acetabelum into account. This is counterbalanced by a left lateral sacral mass that is more developed on the frontal plan, as demonstrated by the asymmetry of the variable involving the ratio between the lateral sacral mass and the pelvic breadth (Fig. 1). The right iliac blade slope (Fig. 5) is lower in relation to the upper sacral plate, accompanied by a smaller distance between the acetabulum and the apex of the right iliac blade slope (Fig. 2), with the orientation of the iliac crest being more unfolded and more stretched (Figs 10–12).
Fig. 2.
Sagittal views of right iliac bone. 11, hipbone length; 12, symphysis pubis height; 13, symphysis pubis slope; 14, horizontal greater sciatic notch; 15, pelvic general index (C/11); 16, superior iliac spines length; 17, apex iliac crest–ischial tuberosity; 18, anterior–superior iliac spine–ischial tuberosity; 19, postero-superior iliac spine–ischial tuberosity; 20, great axis of obturator foramen; 21, anterior iliac crest; 22, apex iliac crest–acetabulum; 23, minimal ilium breadth; 24, pubis length; 25, antero-superior iliac spine–acetabulum.
Fig. 10.
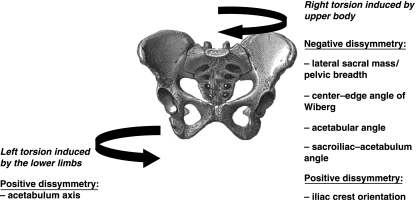
Pelvic asymmetry: a spiral path in the pelvis, the upper part with the iliac blades rotating clockwise and the lower part with the pubic symphysis rotating anticlockwise.
Fig. 12.
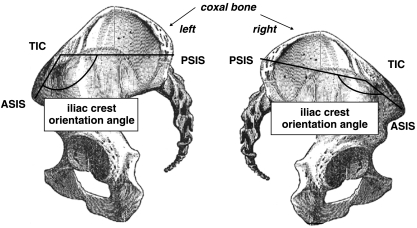
The pelvis clinical asymmetry measurement: the right iliac crest angle is greater than the left. Then the right iliac crest is unfolded whereas the left one is folded. Therefore, the left iliac crest vertex is higher than the right. Thus, pelvis asymmetry can lead to confusion with pelvis imbalance. ASIS, anterior superior iliac spine; PSIS, posterior superior iliac spine; TIC, tubercle of iliac crest.
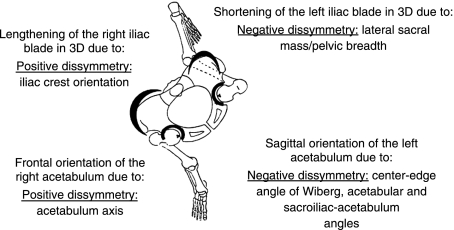
The sacroiliac–acetabulum angle (Fig. 1) is wider on the left, which means that the left acetabelum has a tendency to become more sagittal and the right acetabulum to become more frontal (Fig. 11). These tendencies are confirmed by the acetabulum axis (Fig. 5), which is wider on the right and narrower on the left; this situation leads to a lesser covering of the right superior lunate surface of the acetabulum and on the other side a better covering of the left superior lunate surface of the acetabulum (Wiberg and Hilgenreiner angles) (Fig. 6). The dissymmetries observed in the thickness of the iliac buttresses (Fig. 3) confirm its role in the asymmetric layout of bone matrix within the iliac bone. Simultaneously, the right pubis symphysis is greater in height, as is the great axis of the obturator foramen (Fig. 2). Within the same variable, the study of correlations between the right and left values creates a new hierarchy in the variables mentioned above, which determines pelvic asymmetry. These correlations make it possible to select two variables for which the asymmetry of right vs. left is the most significant: the distance between the apex of the iliac crest and the acetabulum (rs = 0.98) (Fig. 2), and the orientation of the iliac crest (rs = −0.845) (Fig. 3).
Fig. 11.
The pelvis in the transverse plane and the effects of the asymmetry.
The advantage of using a dimensionless unit is that we are no longer dependent on the real value of the variable or the size of the pelvis. The index of asymmetry (ABGi) yields a percentage of asymmetry for the planned variable that is more pertinent in the context of our study. The significant ABGi is established for six variables: a positive asymmetry where the right is superior to the left with respect to the acetabulum axis (Fig. 5) and the angle of the iliac crest orientation (Fig. 3), and a negative asymmetry where the left is superior to the right for the lateral sacral mass/pelvic breadth ratio (Figs 1 and 2), the angles of the superior lunate surface of the acetabulum (Wiberg and Hilgenreiner) (Fig. 6), and the angle between the sacro-iliac joint and the acetabulum (Fig. 1). There is convergence because these six variables have been found to be asymmetric not only in a dimensional unit, but also in the orientation of their asymmetry. Thus, the use of the dimensionless unit makes it easier to select and discriminate the most significant variables. The ABGi increases the sensitivity and reliability of estimating the asymmetry of the pelvis. In comparison with the dimensional variables, the ABGi is a better tool for assessing pelvic asymmetry. The Pearson correlation matrix between these six significant ABGi reveals no significant correlation between them. They are therefore independent and individually informative as regards the asymmetry of the pelvis, but none of them can summarize the entire asymmetry individually.
In practice, only two results can be exploited clinically (Fig. 9): the lateral sacral mass/pelvic breadth ratio through radiology (the percentage of asymmetry for this variable is 47%) (Fig. 1); and the iliac crest orientation (Figs 3 and 12) (the percentage of asymmetry for this variable is 8%). Consequently, the entire asymmetry involving the right and left pelvis appears to designate a spiral path in the pelvis, the upper part with the iliac blades rotating clockwise and the lower part with the pubic symphysis rotating anticlockwise (Fig. 10).
Clinical assessment of spine and lower limb relationships
Pelvic asymmetry can be easily evaluated in clinical examination by measuring iliac crest orientation (Figs 3 and 12). The ASIS, PSIS and the tubercle of the iliac crest are identified by palpation and marked with a pen. The goniometer measures the iliac crest orientation angle (Figs 3 and 12). The iliac crest orientation angle determines the degree of asymmetry of the pelvis independently of the patient's position. We must bear in mind, however, that only the degree of symmetry of the upper pelvis can be measured by this kind of clinical examination. This assessment must be considered in conjunction with the clinical scoliosis evaluation. Finally, the validity and reliability of this clinical measurement must be assessed in a healthy population.
The lower part of the pelvic asymmetry, particularly at the acetabulum level, is not accessible in a clinical examination; its assessment can be defined using magnetic resonance imaging and/or computer-assisted surgery. Because of osseous superpositions, it is very difficult to measure the asymmetry of the pelvis at the acetabulum level with only an X-ray pelvic view.
Walking cannot be considered a strictly symmetric activity, even if the temporal and spatial variables of stride (length, duration) are symmetrical during a stride phase. The differences involve the kinematic variables, such as the range of motion of the lower limb joints at the different moments in the walking cycle, and the electromyography (EMG), disclosing an asymmetry of contraction of some muscles (in particular the soleus during the propulsion phase) (Ounpuu & Winter, 1989). The relationship of upper limb dominance is unclear because the exclusive dominance of a hemibody is exceptional for all tasks. For each task, including walking, each individual develops strategies in which dominance varies (Ounpuu & Winter, 1989). However, kinetic analysis of strictly right-handed people shows that the dominant lower limb has a greater role in propulsion and the non-dominant lower limb has a greater role in the kinetic loading response at heelstrike (Sadeghi et al. 2000; Sadeghi, 2003). Thus, the relation between this pelvic asymmetry, which was unidirectional in our sample, and the asymmetric variables of stride in relation to walking strategies poses a problem. Consequently, it would be relevant to study walking strategies in a normal population (using EMG, kinetics and kinematics) and to search for a correlation with the pelvic symmetry revealed by a simple clinical examination. The range of stride asymmetry reported in a normal population, necessarily varying according to brain dominance, contrasts with the relative constancy and the unidirectional nature of the pelvic asymmetry found in our sample.
Acknowledgments
We would like to thank the Montpellier ERRF Association for the grant and their participation in the project, and Claire Twork for help with editing.
References
- Abitbol MM. Evolution of the lumbosacral angle. Am J Phys Anthropol. 1987a;72:361–372. doi: 10.1002/ajpa.1330720309. [DOI] [PubMed] [Google Scholar]
- Abitbol MM. Evolution of the sacrum in hominoids. Am J Phys Anthropol. 1987b;74:65–81. doi: 10.1002/ajpa.1330740107. [DOI] [PubMed] [Google Scholar]
- Abitbol MM. Sacral curvature and supine posture. Am J Phys Anthropol. 1989;80:379–389. doi: 10.1002/ajpa.1330800311. [DOI] [PubMed] [Google Scholar]
- Bellugue P. Le membre inférieur. In: Bellugue P, editor. Introduction a l'Etude de la Forme Humaine, Anatomie Plastique et Mécanique. Paris: Maloine; 1963. pp. 35–50. [Google Scholar]
- Berge C. Functional interpretation of the dimensions of the pelvis of Australpithecus afarensis (AL 288–1) Z Morph Anthrop. 1991;78:321–330. [PubMed] [Google Scholar]
- Bonnett C, Brown J, Perry J, Nickel V. Evolution of treatement of paralytic scoliosis at Rancho Los Amigos Hospital. J Bone Joint Surg. 1975;57:206–215. A. [PubMed] [Google Scholar]
- Boulay C, Tardieu C, Hecquet J, et al. Anatomical reliability of two fundamental radiological and clinical pelvic parameters: Incidence and Thickness. Eur J Orthop Surg Traumatol. 2055. in press.
- Coppens Y. L'originalité anatomique et fonctionnelle de la première bipédie. Bull Acad Natle Méd. 1991;175:977–993. [PubMed] [Google Scholar]
- Dubousset J. Importance de la notion de la vertèbre pelvienne dans l'équilibre rachidien. Application à la chirurgie de la colonne vertébrale chez l'enfant et l'adolescent. In: Dubousset J, editor. Pied, Equilibre et Rachis. Paris: Frison Roche; 1998. pp. 141–148. [Google Scholar]
- Ducroquet R, Ducroquet J, Ducroquet P. Le pas pelvien. Press Méd. 1964;72:2095–2099. [PubMed] [Google Scholar]
- Ducroquet R, Ducroquet J, Ducroquet P. La Marche et les BoiteriesEtude des Marches Normales et Pathologiques. Paris: 1965. [Google Scholar]
- During J, Goudfrooij H, Keessen W, Beeker TW, Crowe A. Toward standards for posture. Postural characteristics of the lower back system in normal and pathologic conditions. Spine. 1985;10:83–87. [PubMed] [Google Scholar]
- Duval-Beaupère G, Poiffaut A, Bouvier CL, Garibal JC, Assicot J. Molded plexidur corrective corsets in the treatment of paralytic scolioses. Evaluation after 7 years usage. Acta Orthopaedica Belgica. 1975;41:652–659. [PubMed] [Google Scholar]
- Duval-Beaupère G, Lespargot A, Grossiord A. Scoliosis and trunk muscles. J Pediatr Orthop. 1984;4:195–200. doi: 10.1097/01241398-198403000-00008. [DOI] [PubMed] [Google Scholar]
- Duval-Beaupère G, Schmidt C, Cosson P. A Barycentremetric study of the sagittal shape of spine and pelvis: the conditions required for an economic standing position. Ann Biomed Eng. 1992;20:451–462. doi: 10.1007/BF02368136. [DOI] [PubMed] [Google Scholar]
- Endo B. Morphological investigation of innominate bones from Pleistocene in Japan with special reference to the Akashi Man. J Anthrop Soc Nippon. 1982;90:27–52. [Google Scholar]
- Farfan HF. The biomechanical advantage of lordosis and hip extension for upright activity. Man as compared with other anthropoids. Spine. 1978;3:336–342. doi: 10.1097/00007632-197812000-00006. [DOI] [PubMed] [Google Scholar]
- Hensinger R. Standarts in Pediatric Orthopedics: Tables, Charts and Graphs Illustrating Growth. New York: Raven Press; 1986. [Google Scholar]
- Hodgkinson I, Jindrich ML, Metton G, Berard C. Bassin oblique, luxation de hanche et scoliose dans une population de 120 adultes polyhandicapes. Etude descriptive: pelvis obliquity, hip excentration and scoliosis in a population of 120 polyhandicaped adults. Descriptive study. Ann Readapt Med Phys. 2002;45:57–61. doi: 10.1016/s0168-6054(01)00177-5. [DOI] [PubMed] [Google Scholar]
- Itoi E. Roentgenographic analysis of posture in spinal osteoporotics. Spine. 1991;16:750–756. doi: 10.1097/00007632-199107000-00011. [DOI] [PubMed] [Google Scholar]
- Jordan K, Dziedzic K, Jones PW, Ong BN, Dawes PT. The reliability of the three-dimensional FASTRAK measurement system in measuring cervical spine and shoulder range of motion in healthy subjects. Rheumatology. 2000;39:382–388. doi: 10.1093/rheumatology/39.4.382. [DOI] [PubMed] [Google Scholar]
- Kapandji IA. Le membre inférieur. In: Kapandji IA, editor. Physiologie Articulaire. Paris: Maloine; 1980. pp. 24–25. [Google Scholar]
- Kilfoyle R, Foley J, Norton P. Spine and pelvic deformity in childhood and adolescent paraplegia. J Bone Joint Surg. 1965;47:659–682. A. [PubMed] [Google Scholar]
- Lavelle M. Natural selection and development sexual variation in the human pelvis. Am J Phys Anthropol. 1995;98:59–72. doi: 10.1002/ajpa.1330980106. [DOI] [PubMed] [Google Scholar]
- LeDamany P. L'adaptation de l'Homme à la station debout. Journal de l'anatomie et de la physiologie normales et pathologiques des hommes et des animaux. 1905;XLI:133–170. [Google Scholar]
- Legaye J, Hecquet J, Marty C, Duval-Beaupere G. Equilibre sagittal du rachis. Relations entre bassin et courbures rachidiennes sagittales en position debout. Rachis. 1993;5:215–226. [Google Scholar]
- Legaye J, Duval-Beaupere G, Hecquet J, Marty C. Pelvic incidence: a fundamental pelvic parameter for three-dimensional regulation of spinal sagittal curves. Eur Spine J. 1998;7:99–103. doi: 10.1007/s005860050038. [DOI] [PMC free article] [PubMed] [Google Scholar]
- Lovejoy CO. The origin of Man. Science. 1981;211:341–350. doi: 10.1126/science.211.4480.341. [DOI] [PubMed] [Google Scholar]
- Luque E. Paralytic scoliosis in growing children. Clin Orthop. 1982;163:202–209. [PubMed] [Google Scholar]
- Maffey-Ward L, Jull G, Wellington L. Toward a clinical test of lumbar spine kinesthesia. J Orthop Sports Phys Ther. 1996;24:354–358. doi: 10.2519/jospt.1996.24.6.354. [DOI] [PubMed] [Google Scholar]
- Marty C, Boisaubert B, Descamps H, et al. The sagittal anatomy of the sacrum among young adults, infants, and spondylolisthesis patients. Eur Spine J. 2002;11:119–125. doi: 10.1007/s00586-001-0349-7. [DOI] [PMC free article] [PubMed] [Google Scholar]
- McMaster M, Ohtsuka K. The natural history of congenital scoliosis: a study of 251 patients. J Bone Joint Surg. 1982;64:1128–1147. A. [PubMed] [Google Scholar]
- O'Brien JP, Dwyer AP, Hodgson AR. Paralytic pelvic obliquity. J Bone Joint Surg. 1975;57:626–631. A. [PubMed] [Google Scholar]
- Ounpuu S, Winter DA. Bilateral electromyographical analysis of the lower limbs during walking in normal adults. Electroencephalogr Clin Neurophysiol. 1989;72:429–438. doi: 10.1016/0013-4694(89)90048-5. [DOI] [PubMed] [Google Scholar]
- Reimers T. The stability of the hip in children. A radiological study of the results of muscle surgery in cerebral palsy. Acta Orthopaedica Scand Suppl. 1980. pp. 1–100. [DOI] [PubMed]
- Rickenmann E. Beiträge zur Vergleichenden Anatomie Insbesondere des Beckens bei Catarrhinen. Basel: Karger S; 1957. [PubMed] [Google Scholar]
- Rouvière H. Anatomie humaine. In: Rouvière H, editor. Anatomie Humaine. Paris: Masson; 1948. pp. 668–672. [Google Scholar]
- Sadeghi H. Local or global asymmetry in gait of people without impairments. Gait Posture. 2003;17:197–204. doi: 10.1016/s0966-6362(02)00089-9. [DOI] [PubMed] [Google Scholar]
- Sadeghi H, Allard P, Prince F, Labelle H. Symmetry and limb dominance in able-bodied gait: a review. Gait Posture. 2000;12:34–45. doi: 10.1016/s0966-6362(00)00070-9. [DOI] [PubMed] [Google Scholar]
- Schultz AH. Les Primates. In: Schultz AH, editor. Grande Encyclopédie de la Nature. Paris: Bordas; 1972. pp. 105–125. [Google Scholar]
- Stewart D. The pelvis as a passageway. Evolution and adaptations. Br J Obstet Gynaecol. 1984;91:611–617. doi: 10.1111/j.1471-0528.1984.tb04818.x. [DOI] [PubMed] [Google Scholar]
- Swinkels A, Dolan P. Regional assessment of joint position sense in the spine. Spine. 1998;23:590–597. doi: 10.1097/00007632-199803010-00012. [DOI] [PubMed] [Google Scholar]
- Tague R, Lovejoy C. The obstetric pelvis of A.L. 288–1 (Lucy) J Hum Evol. 1986;15:237–255. [Google Scholar]
- Testut L, Latarjet A. Ostéologie, arthrologie, myologie. In: Testut L, Latarjet A, editors. Traité d'Anatomie Humaine. Paris: Doin & Cie; 1948. pp. 71–84. 356 393. [Google Scholar]
- Vidal J, Marnay T. Morphology and anteroposterior body equilibrium in spondylolisthesis L5–S1. Rev Chir Orthop. 1983;69:17–28. [PubMed] [Google Scholar]
- Vidal J, Marnay T. Sagittal deviations of the spine, and trial of classification as a function of the pelvic balance. Rev Chir Orthop. 1984;70:124–126. [PubMed] [Google Scholar]
- Wiberg G. Studies on dysplastic acetabula and congenital subluxation of the hip joint. Acta Chir Scand. 1939;83:1–135. [Google Scholar]
- Willems J, Jull G. An in vivo study of the primary and coupled rotations of the thoracic spine. Clin Biomech (Bristol, Avon) 1996;11:311–316. doi: 10.1016/0268-0033(96)00017-4. [DOI] [PubMed] [Google Scholar]


