Abstract
The developmental mechanisms underlying the formation of human cortical convolutions (gyri and sulci) remain largely unknown. Genetic causes of lissencephaly (literally ‘smooth brain’) would imply that disorders in neuronal migration cause the loss of cortical convolutions. However, prior studies have suggested that loss of sulci and gyri can also arise from impaired proliferation, disrupted lamination and loss of intracortical connections. To gain further insight into the mechanisms underlying the formation of cortical convolutions, we examined the progressive brain development of the gyrencephalic ferret. In this study, we used magnetic resonance imaging to follow the temporal and spatial pattern of neuronal migration, proliferation and differentiation in relation to the onset and development of cortical convolutions. In this manner, we demonstrate that the onset of gyrification begins largely after completion of neuronal proliferation and migration. Gyrification occurs in a lateral to medial gradient, during the period of most rapid cerebral cortical growth. Cortical folding is also largely complete prior to myelination of the underlying cortical axons. These observations are consistent with gyrification arising secondary to cortical processes involving neuronal differentiation.
Keywords: cortical development, ferret, gyri, gyrification, MRI, sulci
Introduction
Disruptions of multiple developmental processes have been thought to cause lissencephaly (literally ‘smooth brain’) with the loss of cortical convolutions (sulci and gyri) in the human brain. Impairments in neuronal proliferation affect the number of neurons produced, thereby presumably altering the number of neurons needed to induce cortical folding. Impairments in neuronal migration and motility through loss-of-function mutations in the lissencephaly 1 and doublecortin genes have actually been shown to cause lisssencephaly in humans (Clark, 2001). Impairments in cortical lamination also probably influence sulcal and gyral formation as the relative number of neurons found within deep layers of the cortical plate has been shown to increase near gyral crowns and conversely to decrease near sulcal fundi (Hilgetag & Barbas, 2005). Finally, axonal elongation has been proposed to create the tension between corticocortical axonal projections that may be necessary to cause inward folding of a relatively pliable embryonic cortex during brain expansion (Van Essen, 1997). Individually, impairments in each of these developmental events are probably sufficient to disrupt cortical folding but the direct mechanisms leading to gyrification remain unclear.
Disruptions in neuronal proliferation, migration and differentiation do not necessarily lead to loss of cortical convolutions (reviewed in Sheen & Walsh, 2003; Francis et al. 2006). Failure in cell division, in general, results in a smaller brain with preservation of sulcal and gyral folds, albeit on a smaller scale. For example, genetic mutations in centromere-related genes such as ASPM and CDK5RAP2/CENPJ and DNA repair genes such as Nijmegen breakage and Microcephalin give rise to microcephaly. Likewise, a failure in neuronal migration due to mutations in the filaminA or ARFGEF2 genes gives rise to nodules of neurons along the ventricular zone (so-called periventricular heterotopia), but does not appear to alter the overlying cortical folds. Finally, impairments in neuronal differentiation can lead to altered cell contacts and interactions, as seen with the neuroligin genes and autism, but no gross alterations in brain morphology. In this context, it is unclear which aspects of proliferation, migration and differentiation are responsible for and contribute to cortical folding and which are not.
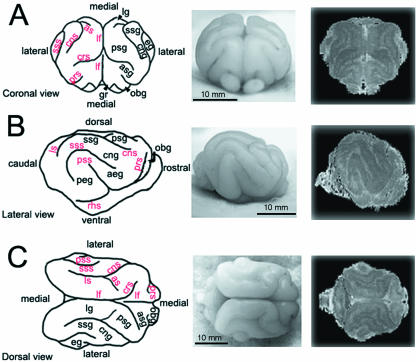
Here we studied the progressive gyrification of the ferret brain by magnetic resonance (MR) imaging to associate the temporal and spatial pattern of gyrification with the progressive cortical developmental stages. Unlike rat and mouse brains and like human brains, ferret brains are gyrencephalic with cortical folds and indentations along the surface of the brain (Fig. 1) (Smart & McSherry, 1986a). Formation of sulcal and gyral folds occurs during the postnatal period (Jackson et al. 1989). This developmental time frame enables the use of MR imaging to provide a direct means to observe gross structural changes in the brain, progressive differentiation of regional areas in the brain, and a means for quantification of these changes (Van der Linden et al. 1998; Benveniste & Blackband, 2002; Marino et al. 2003). We find that the onset of gyral and sulcal formation in the ferret brain corresponds to a developmental period that occurs largely after completion of neuronal proliferation and migration, before the period of extensive subcortical myelination and during the period of ongoing neuronal differentiation. These observations suggest that gyrification probably arises from intracortical processes invoked during neuronal differentiation.
Fig. 1.
Gross anatomical profiles of the ferret brain at 4 weeks of age. Camera lucida renderings (left), photomicrographs (centre), and 3D reconstructions of the 4-week-old ferret brain are displayed in coronal (A), lateral (B) and dorsal (C) views. The prominent, rounded elevations found on the surface of the brain tissue (gyri) with their corresponding acronyms are denoted in black. The furrows along the surface of the brain (sulci) with their corresponding acronyms are denoted in red. The actual sulcal and gyral labels for these abbreviations are listed in Table 2.
Materials and methods
Animal protocol
All studies were performed in accordance with animal welfare protocols at the Beth Israel Deaconess Medical Center and Harvard Medical School. Ferrets were obtained from Marshall Farms Co. (New York).
For in vivo studies, the ferrets were anaesthetized with inhaled 1% isofluorane in N2O:O2. All animals were placed in a prone or vertical position with their heads firmly fixed in a custom-made stereotactic device. The respiratory and cardiac status of ferrets was monitored during MR imaging, and the body temperature was maintained by a heating pad and heat from the coil.
MRI protocol
Ferrets were studied at ten different time points, postnatal day 1 (P1), P4, P8, P11, P15, P21, P28, P42, P63 and adulthood (6 months of age). A single ferret was imaged at each time point. Raw data were taken from each time point to produce depth-cut animations as well as three-dimensional (3D) viewpoints using propriety software (Paravision, Bruker Co.). The animals were then killed and the MR images were correlated with images obtained from serial histological sections.
The MR system and radio frequency (RF) coil were selected depending upon the animal size. MR imaging for P1 to P15 was conducted with a 8.5-T microimaging system, operating at 360 MHz proton frequency, with 20- or 35-mm bird-cage RF coil (DRX-360, Bruker BioSpin MRI, Inc., Karlsruhe, Germany). For P21 to adult, a 4.7-T microimaging system with a 72-mm bird-cage RF coil (Biospec, Bruker BioSpin MRI, Inc.) was used. T2-weighted sagittal images were subsequently acquired with a 3D fast spin-echo imaging technique at a pulse repetition time and echo time of 2000–2500 ms and 70–80 ms, respectively. The MR imaging sequence that we used was rapid acquisition with relaxation enhancement (RARE) and the other imaging parameters were determined due to the brain sizes as follows: 128 × 128 × 64 image matrix size and 2 × 2 × 1.5–4 × 3.2 × 3.2 cm3 field of view, resulting in a total scan time of approximately 2 h 20 min. Those imaging sets yielded contiguous images of 117 × 117–312 × 312 mm2 in-plane resolution and 234–500 mm slice thickness (see Table 1 for spatial resolutions of various aged ferrets) (Takahashi et al. 2003).
Table 1.
Table of spatial resolutions for the various aged ferret MR imaging studies
| Postnatal age | Field of view (cm) | Matrix dimension | Recovery time (ms) |
|---|---|---|---|
| P1 | 2 × 1.5 × 1.5 | 128 × 128 × 64 | 2000 |
| P4* | 2.5 × 2.5 | 256 × 256 | 2000 |
| P8 | 2.8 × 2.5 × 2.5 | 128 × 128 × 64 | 2000 |
| P11* | 3 × 3 | 256 × 256 | 2000 |
| P15 | 2.8 × 2.3 × 2.3 | 128 × 128 × 64 | 2000 |
| P21* | 3.5 × 3.5 | 128 × 128 | 2500 |
| P28 | 3.6 × 3.2 × 3.2 | 128 × 128 × 64 | 2000 |
| P42* | 5 × 5 | 128 × 128 | 2500 |
| P63 | 4 × 3.2 × 3.2 | 128 × 128 × 64 | 2500 |
| Adult | 4 × 3.2 × 3.2 | 128 × 128 × 64 | 2000 |
Indicates raw data collected in two dimensions.
One of the difficulties of imaging microarchitecture in vivo is the achievement of sufficient resolution and signal-to-noise ratio (SNR) to resolve individual structures. As higher magnetic field strength and smaller RF coils improve SNR, we used either an 8.5-T (from P1 to P15) or a 4.7-T MR scanner with the smallest RF coil possible for the various aged animals. Subsequently, adequate field of view was selected to encompass the entire brain. As relaxation times are magnetic field dependent and individual tissue composition changes with age, fundamentally it is not possible to obtain exactly the same tissue contrast among the different ages. However, we tried to enhance the contrast between white and grey matter by adjusting TR on the T2-weighted images.
3D reconstructions
The MR images were imported into Analyze 4.0 (Biomedical Imaging Resource, Mayo Foundation, Rochester, MN, USA; AnalyzeDirect Inc., Lenexa, KS, USA), and the brain was segmented from other tissues and background using a semi-automated method. This method employed a region-growing algorithm (from a seed voxel within the brain tissue) based on image contrast as well as user knowledge of anatomy. All non-brain voxels in the image were set to zero. The segmented images were then imported into the Analyze 3D rendering module. To ensure correct scaling for visualization, a linear interpolation was performed to reformat the voxels to isotropic dimensions. The brain image was rendered in three dimensions using a surface projection algorithm, which best visualized the surface and sulci of the brain. The 3D rendered images were then rotated and manipulated in a manner that best visualized the brain morphology, and movies were generated.
Quantitative volumetric analyses
Serial sections of coronal MR images from various aged ferret brains were used for quantification of regional volumes. The contours of two regions (the cortex along the surface of the brain and the underlying subcortical structures) were visually separated using standard image analysis software (NIH Image J). Areas of the respective regions were calculated for the individual MR sections and collectively summed to yield a representative volume. Rates of change were determined by calculating the slope of the volume over time.
Gyrification index
In this study, gyrification index (GI) is based on a ratio of inner vs. outer contour length of the cortex (GI = inner contour/outer contour) (Jou et al. 2005). The outer contour represents the most superficial region of the cortex surrounding the external gyral surfaces while excluding the inner sulci. The inner contour forms the adjacent boundary of the outer contour in addition to the sulcal groove. Measurements were obtained by manually tracing inner and outer contours of coronal MRI sections from P1, P7, P14, P28, and adult ferrets using imageJ software. Serial images were taken at every fifth coronal section between the rostral level of the olfactory bulbs and the caudal midbrain. For each time point, the average and standard deviation of the GI was plotted and fitted with a sigmoid-Boltzmann curve (r2 = 0.986).
Histological sections
Ferrets of the various ages were killed under inhaled anaesthesia, perfused with phosphate-buffered saline and fixed with 4% paraformaldehyde in phosphate-buffered saline. Dissected brains were blocked into four sections, embedded in paraffin, and sectioned at 8-µm intervals (Histo-scientific research laboratories, Jackson, VA, USA). Alternate sections were stained using the cresyl violet method to label Nissl substance.
Anatomical labelling and nomenclature
Sulcal and gyral terminology is based on Fox (1998; Table 2). The ferret terminology used follows the same nomenclature used for sulci across many species.
Table 2.
Nomenclature for the abbreviated sulci and gyri terms
| Abbreviation | Definition |
|---|---|
| aeg | anterior ectosylvian gyrus |
| as | ansinate sulcus |
| asg | anterior sigmoid gyrus |
| cng | coronal gyrus |
| cns | coronal sulcus |
| crs | cruciate sulcus |
| gr | gyrus rectus |
| lf | longitudinal fissure |
| lg | lateral gyrus |
| ls | lateral sulcus |
| obg | orbital gyrus |
| os | olfactory sulcus |
| peg | posterior ectosylvian gyrus |
| prs | presylvian sulcus |
| psg | posterior sigmoid gyrus |
| pss | pseudosylvian sulcus |
| rhs | rhinal sulcus |
| scs | splenocruciate sulcus |
| ssg | suprasylvian gyrus |
| sss | suprasylvian sulcus |
*All terminaology taken from Fox (1998).
Results
Temporal course of sulcal and gyral development in ferret brain
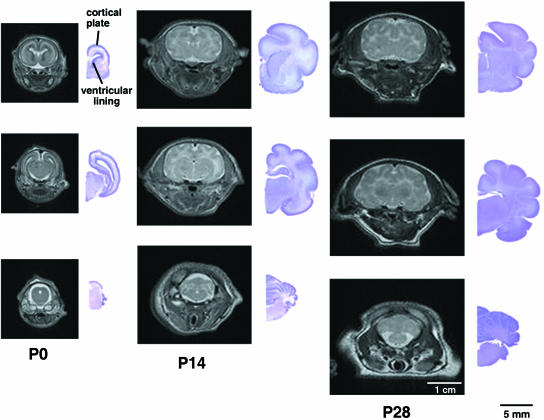
Gyrification in the developing ferret brain occurs postnatally and is largely complete within the first 28 postnatal days (Fig. 2). At P0 (postnatal day 0), the ferret brain appears lissencephalic, sharing many gross features seen in the developing mouse and rat brains. All the sulci and gyri are largely formed by P14 in both rostral and caudal regions of the ferret brain, with further maturation of the sulcal indentations and gyral folds occurring over the following 2 weeks.
Fig. 2.
Sulcal and gyral folds in the ferret brain form postnatally. Rostral to caudal coronal MR images (left) with corresponding cresyl violet sections (right) are shown from various aged ferret brains (postnatal day 0, P14, P28).
Spatial course of sulcal and gyral development in ferret brain
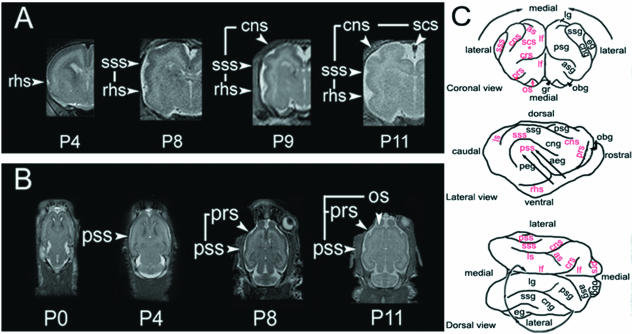
During early development, sulci remain fixed while the gyri expand within the intersulcal segments, thus making relative sulcal depth an indicator of the degree of cortical maturation (Smart & McSherry, 1986a). In this context, gyrification in the developing ferret brain follows a lateral to medial gradient during development (Fig. 3A). The first sulcus can be visualized by P4 on coronal MR images, develops into the ventrolateral region of the brain, and matures into the rhinal sulcus (RHS). At P8, a shallow invagination arises dorsal and slightly medial to the RHS, ultimately to form the suprasylvian sulcus (SSS). MR images taken subsequent to P8 show the gradual maturation of the coronal sulcus (CNS) and the splenocruciate sulcus (SCS); both are situated medial to the earlier formed sulci. Overall, the dorsomedial position and relatively late formation of the CNS and SCS indicate the presence of a ventrolateral to dorsomedial gradient of cortical folding, as well as cortical maturation.
Fig. 3.
Ferret sulcal and gyral formation progress along a lateral to medial gradient. (A) Coronal MR images of early developmental time points show initial development of the more lateral rhinal sulcus, followed by the appearance of the more medial suprasylvian sulci and finally, the most medially positioned coronal and splenocruciate sulci. (B) Axial MR images of early developmental time points similarly display a lateral to medial progression of sulcal development, beginning with the pseudosylvian sulcus and later followed by development of the more medially positioned presylvian sulcus and the most medial olfactory sulcus. (C) Camera lucida drawings (coronal, lateral and dorsal views) of the 4-week brain surface display the overall lateral to medial progression of sulcal and gyral development (arrows). The SCS (asterisk) is obscured and lies ventral and lateral to the longitudinal fasiculus (lf).
A similar sequence of gyrification, seen on the coronal sections, can be appreciated from axial MR views (Fig. 3B). The P0 ferret brain largely appears lissencephalic at the level of the thalamus. By P4, an initial invagination can be seen on the lateral surface of the brain, corresponding to the pseudosylvian sulcus (PSS). The PSS corresponds to one of the most ventrolateral sulci in the ferret brain. By P8, a second sulcus is seen anterior and medial to the PSS; this sulcus corresponds to the presylvian sulcus (PRS). By P11, the most medial sulcus can be seen posterior to the olfactory bulb, corresponding to the olfactory sulcus (OS). The axial images similarly demonstrate a lateral to medial gradient of sulcal/gyral development. Moreover, the posterior to anterior progression of development appears to reflect the gradual upward and inward involution of the suprasylvian and pseudosylvian sulci that can be visualized on the brain surface (Fig. 3C).
Gyrification occurs after completion of neuronal proliferation and migration
Prior histological studies of ferret brain development involving neurogenesis, migration and differentiation provide a framework with which to compare the ferret MR imaging studies (McSherry, 1984; Smart & McSherry, 1986a,b; Jackson et al. 1989; Noctor et al. 1997). Neurogenesis begins as early as embryonic day 20 (E20), is largely complete prior to birth (ferret gestational period of 41 days) but extends up to 2 weeks postnatally. Prenatally generated neurons complete their migration in 1 week or less, most postnatally generated neurons require approximately 2 weeks to complete their migration, but the majority of migratory neurons have reached their destination within the first postnatal week. Thereafter, neurons undergo a progressive differentiation.
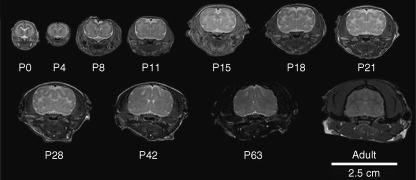
Several observations can be made with respect to cortical development and the onset of gyrification by comparison of the serial MR images (Figs 4 and 5). On coronal sections, the surface of the P0 brain has a dark uniform appearance, consistent with the dense cellularity seen in the cortical plate. The same dark signal is apparent along the lining of the lateral ventricles, suggestive of the dense cellularity and highly immature state of progenitor cells within the ventricular zone (VZ). These changes were confirmed on comparison of the MRI studies with Nissl-stained cell bodies seen on the histological sections (see Fig. 2). The T2 dark signal initially increases along the cortical surface but diminishes along the periventricular region between the P4 and P8 period. This observation probably corresponds to the progressive migration of postmitotic neurons from the VZ to the cortical plate and the gradual diminished proliferation of the neural progenitor population along the VZ. Thereafter, the cortical plate achieves a less dense appearance with T2 brightening on MR, suggestive of the gradual differentiation and maturation of the neurons and supporting cells.
Fig. 4.
Neuronal proliferation and migration in postnatal ferret by MR imaging. Coronal MR images of the ferret brain were obtained at various ages [P0 to adulthood (6 months)]. At P0, the T2-weighted dark signal located along lateral ventricular lining (arrow) suggests the presence of a high density of progenitor cells. At P4 and P8, this dark contrast progressively diminishes along the ventricles but increases at the outer cortical surface (arrowhead). This corresponds to the gradual completion of neuronal proliferation at the ventricular zone and the progression of postmitotic neuronal migration from the ventricular zone to the cortical plate during the first postnatal week.
Fig. 5.
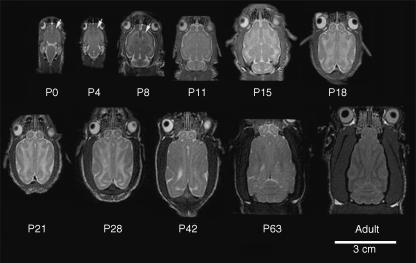
Oligodendrocyte myelination in postnatal ferret by MR imaging. Serial T2-weighted axial MR images of the ferret brain were obtained at various ages (birth until adulthood). The same T2 dark labelling (arrows) seen along the ventricular lining and later in the cortical plate in the coronal sections is appreciated on the axial views during the first postnatal week, probably corresponding to the migration of immature neuroblasts from the VZ to the cortical plate. From P0 to P28, rapid brain expansion is accompanied by an increase in T2 brightening beneath the cortical plate, consistent with progressive elaboration of axonal projections. Thereafter, axial images display gradual tapering of the rostral forebrain and an increase in T2 darkening beneath the cortical plate, consistent with an increase in axonal fibre tract myelination, and a decrease in the overall number of axonal tracts in the brain.
A similar sequence of developmental events can be seen on axial MR imaging of the ferret brain over various ages (Fig. 5). The surface of the cortex appears T2 dark along the entire rostral to caudal extent of the ferret brain, again consistent with densely packed, immature neurons in the cortical plate. The T2 dark signal increases by P8, and the corresponding small T2 dark region (white arrowheads) that can be seen in the anterior and subcortical region surrounding the ventricles at P0 and P4 is largely gone by P8. This periventricular cellular group again comprises those neurons undergoing migration into the cortical plate. Moreover, the diminished T2 signal along the VZ also reflects a decrease in or absence of ongoing neural progenitor proliferation. In summary, neuronal proliferation and migration are largely complete before or just during the initial onset of gyrification.
Gyrification occurs during the period of greatest increase in cerebral cortical size
The development and maturation of the sulcal indentations and gyral folds follow the completion of proliferation and migration within the ferret brain. The cortical width increases between P14 and P28 as revealed by MR imaging of the ferret brain (see Fig. 2). This increase in size of the cortex is also mirrored by the decreased signal intensity on MR imaging along the cortical ribbon, suggesting ongoing neuronal differentiation (differentiating neurons becoming larger and less dense). Moreover, further maturation of the cortical convolutions occurs over this same period, as evidenced by the increasing sulcal depths and gyral expansion (see Fig. 4). No significant change in the size and characteristics of the underlying white matter are observed. The white matter remains relatively unmyelinated and appears T2 bright on MR imaging. Thus, the developmental period for cortical convolutions overlaps extensively with the period of ongoing neuronal differentiation.
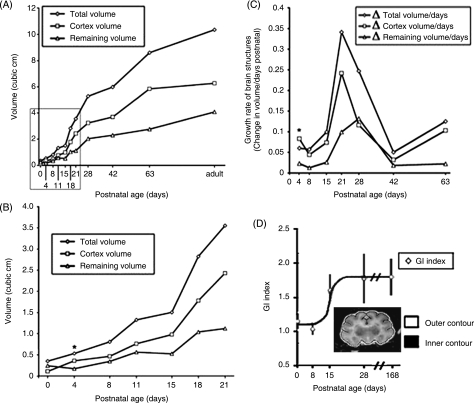
The same qualitative observations made with respect to sulcal and gyral growth on MR imaging can be confirmed quantitatively. Volumetric data from MR images allows for the comparison of the volumes and growth rates of the whole brain, the superficial cortex and underlying basal structures, as well as the relative rate of gyrification (gyrification index) (Fig. 6D). Early during the first week of development, the cortical volume increases more rapidly than the total brain and subcortical volumes (Fig. 6A). By P4, the volume of the cortex exceeds that of the underlying basal structures (Fig. 6B). This early, rapid postnatal growth in the cortical volume probably reflects an ongoing migration of neurons into the cortical plate. As migration significantly tapers off over the first postnatal week, an expected drop in the rate of cortical growth can be seen over P4 to P8 (Fig. 6C). Following this initial rapid cortical expansion, the entire brain undergoes a sustained and progressive growth from P8 to P28, probably related to glial proliferation and neuronal differentiation (Fig. 6C). It is also during this period that the greatest change is observed in the gyrification index, which reflects the ratio between the inner contour (accounting for the sulcal and gyral folds) and the outer surface contour of the brain. The rapid increase in the GI between the second and third postnatal weeks reflects the rapid ongoing development of cortical convolutions during this time frame and is consistent again with a role for neuronal differentiation in dictating gyrification (Fig. 6D). Thereafter, a slow progressive maturation and growth in all brain structures occurs, in part related to oligodendrocyte myelination, which approaches a plateau in the ferrets near 24 weeks of age.
Fig. 6.
Gyrification occurs during the period of greatest increase in cerebral cortical volume. (A) The volume of ferret brain structures (cortex, subcortical structures, entire brain) shows the greatest increase between the 2nd and 4th weeks of postnatal development. (B) Magnified view of the inset in (A) shows that the cortical volume actually surpasses the volume of the subcortical structures by the fourth postnatal day (asterisk). This time frame corresponds to the progressive migration of neurons from the ventricular zone to the cortical plate. (C) The cortical growth rate exceeds both the growth rate of the total brain and its underlying structures (remaining volume) in the first postnatal week (asterisk), consistent with expansion of the cortical plate. Thereafter, the cortex undergoes a sustained period of growth between the second and fourth weeks of growth. (D) Gyrification index indicates that gyrification advances most rapidly during the third postnatal week, consistent with the period of most rapid cortical growth. Subsequently, the gyral formation plateaus until adulthood. Image displays a manually traced P28 coronal section used to calculate GI.
Gyrification occurs before the onset of white matter myelination
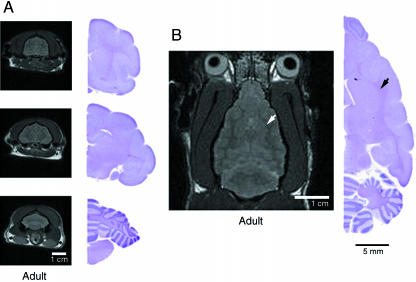
Myelination follows the completion of gyral development. The first 3–4 postnatal weeks are marked by lateral brain expansion, basal forebrain expansion and rostrocaudal elongation (Fig. 5; see supplementary Figs S1–9). Coincidentally, the regions underlying and adjacent to the cortical plate show T2 contrast brightening suggestive of an increase in water diffusion, consistent with the extension of fibre tracts. Thereafter, and into adulthood, the ferret brains display further rostrocaudal expansion along with gradual tapering of the rostral forebrain caused by postorbital narrowing of the anterior skull (Fig. 7). During this period, the MR images show a progressive darkening in subcortical regions immediately underlying the cortical plate consistent with the decrease in water relaxation time caused by myelination of white matter tracts as seen on histology. Thus, progressive expansion of the underlying cortical structures due to oligodendrocyte myelination does not appear to contribute significantly to gyrification.
Fig. 7.
Increase in brain size from axonal myelination does not contribute to sulcal and gyral formation. (A) Serial T2-weighted coronal MR images and corresponding cresyl violet brain sections from adult ferret brain at 6 months of age. The now densely myelinated fibre tracts are T2 dark and appear denser than the overlying cortical structures and deeper basal structures. The cerebral cortex has become less dense (T2 dark) with increasing neuronal maturation. (B) A single axial MR image at the level of the interventricular foramen. The densely myelinated fibres (black arrowhead) on cresyl violet staining corresponds to the T2 dark signal (white arrowhead) on the MR image. Although the overall size of the ferret brain has increased between 4 weeks and 6 months of age as a result of axonal myelination, there is no change in the sulcal and gyral patterns.
Discussion
The study of cortical gyrification is, in general, restricted to higher order species, as mice and rats are naturally lissencephalic. In order to gain insight into the relative contribution of cellular events to sulcal and gyral formation, we examined the temporal and spatial development of ferret brains by MR imaging. The current observations show that the time period of ongoing cortical neuronal differentiation corresponds to the same period of ongoing development of cortical convolutions. Thus, while disorders in neural proliferation and migration can disrupt the formation of sulci and gyri, it is likely that neuronal maturation and establishment of intracortical connectivity guide gyrification.
The changes observed by MR imaging correspond with the known histology of ferret brain development. Coronal MR images at P0 and P4 show T2 dark contrast surrounding the lateral ventricles, suggestive of a high density of progenitors located at the ventricular zone. By P8, the MR images of the brain reveal a loss in this contrast while the cortical plate actually displays an increase in thickness that is also increasingly T2-dark. This progression on serial MR images suggests an ongoing and gradual migration of neuroblasts from the VZ to the cortical plate during the first postnatal week. Moreover, this time frame corresponds with the initial rapid increases in cortical growth as compared with the other brain structures. By comparison, neural birthdating studies of the ferret cortex demonstrate that the majority of neurons have migrated to the cortex within the first postnatal week (Noctor et al. 1997). During this developmental period, the ferret brain predominantly remains lissencephalic, suggesting that neuronal proliferation and migration, while probably necessary for cortical folding (meaning that a sufficient number of cells must have been generated and migrated into the cortex for gyrification to occur), do not actually initiate gyrification. MR images of the ferret brain after the first postnatal week demonstrate a gradual and progressive increase in the size of both cortical and subcortical structures. Moreover, the MR intensities are largely diminished in all brain structures, suggesting neuronal maturation and differentiation. The lateral to medial progression of cortical folding is also consistent with the known progression of cortical maturation. Histological studies of ferret brain during these time periods suggest ongoing neuronal differentiation (increase in cell soma size and extension of projections) in the brain, as well as an increase in the supporting glial cell population (Voigt, 1989; Voigt et al. 1993; Juliano et al. 1996). These events take place subsequent to neuronal proliferation and migration, and largely coincide with the onset and development of cortical folding. Thus, the differentiation of cortical plate neurons and their formation of cortical connections are probably the terminal processes that underlie initial gyral formation.
The period of greatest change in ferret sulcal and gyral formation corresponds with the period of known ferret neuronal differentiation and maturation. The GI provides a quantitative assessment of degrees of gyral folding, allowing for comparison either between species or within a single species at various times during cortical development. The GI of the early postnatal ferret approaches 1, similar to that of a lissencephalic rodent. The rapid increase in the index occurs after the first postnatal week; this developmental period coincides with the known period of ongoing neuronal differentiation within the ferret cerebral cortex and at a time point when neuronal migration and proliferation are largely complete. With maturation into adulthood, the ferret GI approaches 1.8 (by comparison, the adult human GI is 2.55; Zilles et al. 1988).
Disruptions of earlier cellular events, including proliferation and migration, probably cause lissencephaly because they can affect later developmental processes, such as cortical folding. In human malformations of cortical development, the most severe form of lissencephaly is seen in Miller Dieker syndrome (MDS) where loss of the lissencephaly1 (LIS1) gene function is associated with a broader region of chromosomal loss. Human neural progenitors from MDS not only exhibit impairments in cell motility (as expected from loss of LIS1 function), but also have problems in cellular proliferation and undergo increased cell death, presumably due to the loss of the adjacent contiguous genes (Sheen et al. 2006). MR imaging in humans demonstrates a thickened cortical width and enlarged ventricles. The isolated LIS1 or Doublecortin gene mutations show milder forms of lissencephaly by MR imaging. In these brains, a large population of neurons resides within the white matter beneath a thin pseudocortex, consistent with impairments in neuronal motility (Clark, 2001). Finally, the mildest form of lissencephaly with cerebellar hypoplasia has been attributed to Reelin mutations. In humans, the cortical surface exhibits less pronounced sulcal indentations and wider gyal folds (so-called pachygyria) (Hong et al. 2000). Neurons from Reeler mice, which harbour a loss-of-function in this gene, exhibit no problems in cell motility. Rather, the neurons fail to arrest in their proper laminar location, presumably from a failure in signalling (Francis et al. 2006). The ferret MR studies would suggest that the perturbations caused by each of these genes probably precede the onset of any cortical folding. Thus, each of these genes, while disrupting various aspects of development, ultimately and indirectly alters the cortical lamination, thereby interfering with the neuronal differentiation and intracortical connectivity in the brain. Moreover, these genetic studies and the human MR images suggest a gradient of severity for lissencephaly, whereby disruption of earlier development events lead to more severe alterations in cortical folding.
While mutations in genes involved in proliferation and migration give rise to widespread lissencephaly, impairments in genes involved in differentiation may lead to more focal disruptions of cortical folding. Gyrification itself probably represents part of the process of neuronal differentiation. The current radiographic studies of the ferret already suggest that neurons from lateral regions of the brain initially exist in a more differentiated state than those located medially. Thus, it is likely that different gene sequences that direct differentiation are restricted spatially and/or temporally to different regions of the brain. As a consequence, mutations in genes involved in neuronal differentiation and contributing to the folding of the cortex are more likely to be restricted to focal areas of the brain and give rise to focal pachygyria or polymicrogyria. Such an example can be appreciated from recent studies describing a bilateral frontoparietal polymicrogyria due to mutations in the G-protein coupled receptor GPR56 gene (Piao et al. 2005).
The current study provides a direct examination of sulci and gyri formation within the ferret brain by MR imaging. The human malformations of cortical development are almost all uniformly diagnosed by this same imaging modality. Understanding the changes that can be appreciated radiographically and what consequences these changes have on cortical development will be paramount in understanding how the cortical malformation disorders give rise to the human phenotype.
Acknowledgments
This work was supported by grants to C.A.W. from the NINDS (2R37 NS35129 and 1PO1NS40043), the March of Dimes, and the McKnight Foundation. C.A.W. is an Investigator of the Howard Hughes Medical Institute. V.L.S. is supported by grants from Julian and Carol Cohen, the NIMH (1K08MH/NS63886-01), and the Ellison foundation. V.L.S. is a Charles A. Dana fellow and a Beckman Young Investigator.
Supplementary material
The following supplementary material is available for this article at www.blackwell-synergy.com:
Development of ferret sulci and gyri is largely complete by 4 weeks of age. Serial camera lucida renderings, T2-weighted coronal MR images, and corresponding cresyl violet tissue sections demonstrate that the same convolutional folds along the surface of the brain seen in the adult ferret can be appreciated in the ferret at this early age. The images progress in a rostral to caudal direction. MR imaging, however, shows T2 bright signaling just beneath the dark cortical ribbon along the cortical surface, consistent with nonmyelinated fibre tracts as seen on Nissl staining. The T2 dark signal along the cortical surface corresponds to the width of the cortical plate. The cell-dense basal ganglia structures are also T2 dark on MR imaging. The T2 dark signal within the lateral ventricles represents the cell-dense choroids plexus. In the setting of formed sulci and gyri, the absence of myelination would suggest that progressive expansion of deep brain structures is probably not the causal force behind gyrification.
Development of ferret sulci and gyri is largely complete by 4 weeks of age. Serial camera lucida renderings and T2-weighted axial MR images further demonstrate well-formed sulcal and gyral folds, progressing from a dorsal to ventral orientation.
Development of ferret sulci and gyri is largely complete by 4 weeks of age. Serial camera lucida renderings and T2-weighted sagittal MR images demonstrate well-formed sulcal and gyral folds, progressing from a lateral to medical orientation.
References
- Benveniste H, Blackband S. MR microscopy and high resolution small animal MRI: applications in neuroscience research. Prog Neurobiol. 2002;67:393–420. doi: 10.1016/s0301-0082(02)00020-5. [DOI] [PubMed] [Google Scholar]
- Clark GD. Cerebral gyral dysplasias: molecular genetics and cell biology. Curr Opin Neurol. 2001;14:157–162. doi: 10.1097/00019052-200104000-00004. [DOI] [PubMed] [Google Scholar]
- Fox JG. Biology and Diseases of the Ferret. Baltimore, MD: Lippincott, Williams & Wilkins; 1998. [Google Scholar]
- Francis F, Meyer G, Fallet-Bianco C, et al. Human disorders of cortical development: from past to present. Eur J Neurosci. 2006;23:877–893. doi: 10.1111/j.1460-9568.2006.04649.x. [DOI] [PubMed] [Google Scholar]
- Hilgetag CC, Barbas H. Developmental mechanics of the primate cerebral cortex. Anat Embryol (Berl) 2005;210:411–417. doi: 10.1007/s00429-005-0041-5. [DOI] [PubMed] [Google Scholar]
- Hong SE, Shugart YY, Huang DT, et al. Autosomal recessive lissencephaly with cerebellar hypoplasia is associated with human RELN mutations. Nat Genet. 2000;26:93–96. doi: 10.1038/79246. [DOI] [PubMed] [Google Scholar]
- Jackson CA, Peduzzi JD, Hickey TL. Visual cortex development in the ferret. I. Genesis and migration of visual cortical neurons. J Neurosci. 1989;9(4):1242–1253. doi: 10.1523/JNEUROSCI.09-04-01242.1989. [DOI] [PMC free article] [PubMed] [Google Scholar]
- Jou RJ, Hardan AY, Keshavan MS. Reduced cortical folding in individuals at high risk for schizophrenia: a pilot study. Schizophr Res. 2005;75:309–313. doi: 10.1016/j.schres.2004.11.008. [DOI] [PubMed] [Google Scholar]
- Juliano SL, Palmer SL, Sonty RV, Noctor S, Hill GF. Development of local connections in ferret somatosensory cortex. J Comp Neurol. 1996;374:259–277. doi: 10.1002/(SICI)1096-9861(19961014)374:2<259::AID-CNE8>3.0.CO;2-1. [DOI] [PubMed] [Google Scholar]
- Marino L, Sudheimer K, Pabst DA, McLellan WA, Johnson JI. Magnetic resonance images of the brain of a dwarf sperm whale (Kogia simus) J Anat. 2003;203:57–76. doi: 10.1046/j.1469-7580.2003.00199.x. [DOI] [PMC free article] [PubMed] [Google Scholar]
- McSherry GM. Mapping of cortical histogenesis in the ferret. J Embryol Exp Morphol. 1984;81:239–252. [PubMed] [Google Scholar]
- Noctor SC, Scholnicoff NJ, Juliano SL. Histogenesis of ferret somatosensory cortex. J Comp Neurol. 1997;387:179–193. [PubMed] [Google Scholar]
- Piao X, Chang BS, Bodell A, et al. Genotype-phenotype analysis of human frontoparietal polymicrogyria syndromes. Ann Neurol. 2005;58:680–687. doi: 10.1002/ana.20616. [DOI] [PubMed] [Google Scholar]
- Sheen VL, Ferland RJ, Neal J, et al. Impaired proliferation and migration in human Miller Dieker neural precursors. Ann Neurol. 2006;60:137–144. doi: 10.1002/ana.20843. [DOI] [PubMed] [Google Scholar]
- Sheen VL, Walsh CA. Developmental genetic malformations of the cerebral cortex. Curr Neurol Neurosci Rep. 2003;3:433–441. doi: 10.1007/s11910-003-0027-8. [DOI] [PubMed] [Google Scholar]
- Smart IH, McSherry GM. Gyrus formation in the cerebral cortex in the ferret. I. Description of the external changes. J Anat. 1986a;146:141–152. [PMC free article] [PubMed] [Google Scholar]
- Smart IH, McSherry GM. Gyrus formation in the cerebral cortex in the ferret. I. Description of the internal histological changes. J Anat. 1986b;147:27–43. [PMC free article] [PubMed] [Google Scholar]
- Takahashi M, Uematsu H, Hatabu H. MR imaging at high magnetic fields. Eur J Radiol. 2003;46:45–52. doi: 10.1016/s0720-048x(02)00331-5. [DOI] [PubMed] [Google Scholar]
- Van der Linden A, Verhoye M, Van Auderkerke J, et al. Non invasive in vivo anatomical studies of the oscine brain by high resolution MRI microscopy. J Neurosci Meth. 1998;81:45–52. doi: 10.1016/s0165-0270(98)00013-2. [DOI] [PubMed] [Google Scholar]
- Van Essen DC. A tension-based theory of morphogenesis and compact wiring in the central nervous system. Nature. 1997;385:313–318. doi: 10.1038/385313a0. [DOI] [PubMed] [Google Scholar]
- Voigt T. Development of glial cells in the cerebral wall of ferrets: direct tracing of their transformation from radial glia into astrocytes. J Comp Neurol. 1989;289:74–88. doi: 10.1002/cne.902890106. [DOI] [PubMed] [Google Scholar]
- Voigt T, De Lima AD, Beckmann M. Synaptophysin immunohistochemistry reveals inside-out pattern of early synaptogenesis in ferret cerebral cortex. J Comp Neurol. 1993;330:48–64. doi: 10.1002/cne.903300105. [DOI] [PubMed] [Google Scholar]
- Zilles K, Armstrong E, Schleicher A, Kretschmann HJ. The human pattern of gyrification in the cerebral cortex. Anat Embryol (Berl) 1988;179:173–179. doi: 10.1007/BF00304699. [DOI] [PubMed] [Google Scholar]
Associated Data
This section collects any data citations, data availability statements, or supplementary materials included in this article.
Supplementary Materials
Development of ferret sulci and gyri is largely complete by 4 weeks of age. Serial camera lucida renderings, T2-weighted coronal MR images, and corresponding cresyl violet tissue sections demonstrate that the same convolutional folds along the surface of the brain seen in the adult ferret can be appreciated in the ferret at this early age. The images progress in a rostral to caudal direction. MR imaging, however, shows T2 bright signaling just beneath the dark cortical ribbon along the cortical surface, consistent with nonmyelinated fibre tracts as seen on Nissl staining. The T2 dark signal along the cortical surface corresponds to the width of the cortical plate. The cell-dense basal ganglia structures are also T2 dark on MR imaging. The T2 dark signal within the lateral ventricles represents the cell-dense choroids plexus. In the setting of formed sulci and gyri, the absence of myelination would suggest that progressive expansion of deep brain structures is probably not the causal force behind gyrification.
Development of ferret sulci and gyri is largely complete by 4 weeks of age. Serial camera lucida renderings and T2-weighted axial MR images further demonstrate well-formed sulcal and gyral folds, progressing from a dorsal to ventral orientation.
Development of ferret sulci and gyri is largely complete by 4 weeks of age. Serial camera lucida renderings and T2-weighted sagittal MR images demonstrate well-formed sulcal and gyral folds, progressing from a lateral to medical orientation.


